| Param | Original file | Final file |
|---|---|---|
| Filename | modeM0/AS1T03_214T01_9000003758_25930cztM0_level2.evt | modeM0/AS1T03_214T01_9000003758_25930cztM0_level2_quad_clean.evt |
| Size (bytes) | 726,318,720 | 94,000,320 |
| Size | 692.7 MB | 89.6 MB |
| Events in quadrant A | 11,707,150 | 452,141 |
| Events in quadrant B | 3,170,223 | 661,283 |
| Events in quadrant C | 3,164,590 | 630,906 |
| Events in quadrant D | 3,494,920 | 628,497 |
| Mode M0 | |||
|---|---|---|---|
| Quadrant | BADHDUFLAG | Total packets | Discarded packets |
| A | 0 | 39447 | 0 |
| B | 0 | 13948 | 0 |
| C | 0 | 13821 | 0 |
| D | 0 | 15342 | 0 |
| Mode M9 | |||
|---|---|---|---|
| Quadrant | BADHDUFLAG | Total packets | Discarded packets |
| A | 0 | 5 | 0 |
| B | 0 | 5 | 0 |
| C | 0 | 5 | 0 |
| D | 0 | 5 | 0 |
| Quadrant | Total seconds | Saturated seconds | Saturation percentage |
|---|---|---|---|
| A | 6727 | 3989 | 59.298350% |
| B | 6793 | 36 | 0.529957% |
| C | 6799 | 51 | 0.750110% |
| D | 6787 | 84 | 1.237660% |
Noise dominated data is calculated using 1-second bins in cleaned event files. If a bin has >2000 counts, and if more than 50% of those come from <1% of pixels, then it is considered to be noise-dominated and hence unusable.
| Quadrant | # 1 sec bins | Bins with >0 counts | Bins with >2000 counts | High rate bins dominated by noise | Noise dominated (total time) | Noise dominated (detector-on time) | Marked lightcurve |
|---|---|---|---|---|---|---|---|
| A | 7251 | 6739 | 3495 | 3495 | 48.20% | 51.86% | 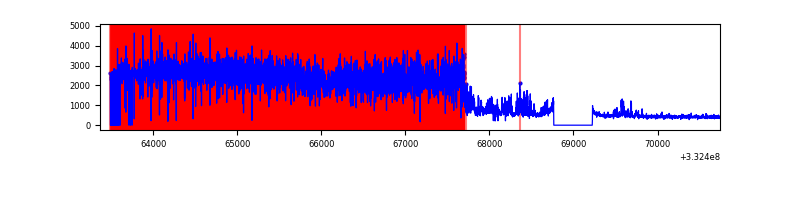 |
| B | 7331 | 6827 | 0 | 0 | 0.00% | 0.00% | 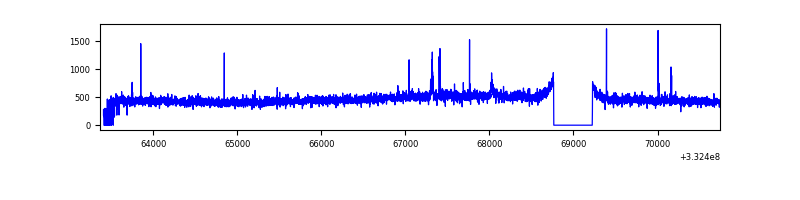 |
| C | 7373 | 6833 | 0 | 0 | 0.00% | 0.00% | 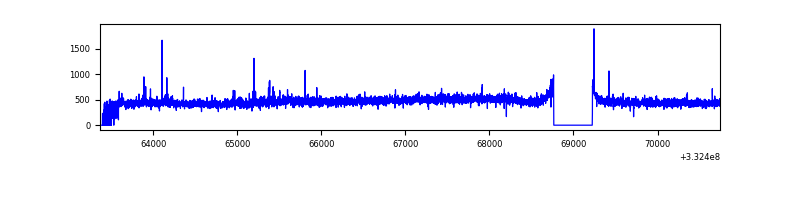 |
| D | 7334 | 6816 | 47 | 47 | 0.64% | 0.69% | 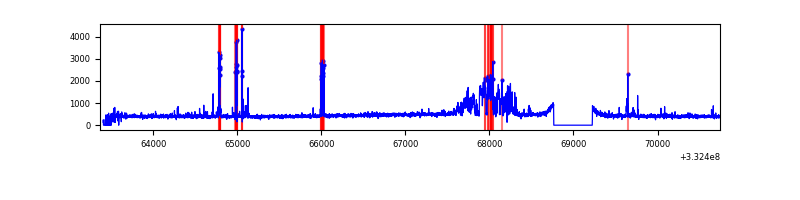 |
Top three noisy pixels from each quadrant. If the there are fewer than three noisy pixels in the level2.evt file, extra rows are filled as -1
| Pixel properties | Quadrant properties | ||||||
|---|---|---|---|---|---|---|---|
| Quadrant | DetID | PixID | Counts | Sigma | Mean | Median | Sigma |
| A | 0 | 13 | 9520807 | 83483.61 | 564 | 551 | 114.0 |
| A | 12 | 16 | 9887 | 81.87 | 564 | 551 | 114.0 |
| A | 13 | 254 | 7750 | 63.13 | 564 | 551 | 114.0 |
| B | 0 | 245 | 25128 | 161.7 | 789 | 770 | 150.6 |
| B | 0 | 190 | 20755 | 132.67 | 789 | 770 | 150.6 |
| B | 12 | 111 | 18624 | 118.52 | 789 | 770 | 150.6 |
| C | 14 | 238 | 120350 | 673.46 | 756 | 759 | 177.6 |
| C | 3 | 233 | 74149 | 413.29 | 756 | 759 | 177.6 |
| C | 8 | 128 | 10381 | 54.19 | 756 | 759 | 177.6 |
| D | 7 | 80 | 383625 | 2096.68 | 760 | 738 | 182.6 |
| D | 1 | 52 | 197497 | 1077.45 | 760 | 738 | 182.6 |
| D | 2 | 234 | 28277 | 150.8 | 760 | 738 | 182.6 |
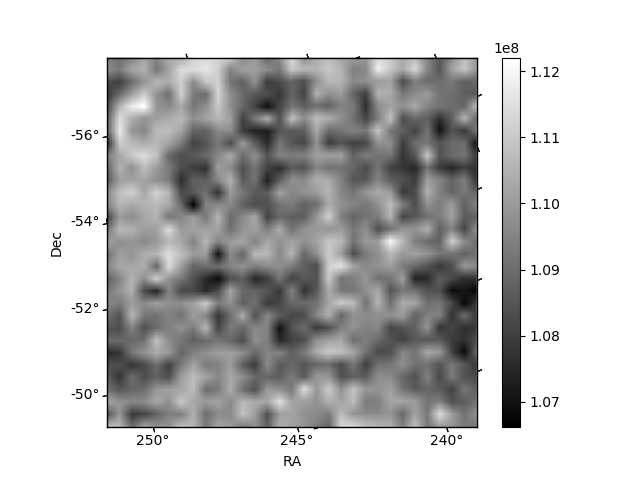
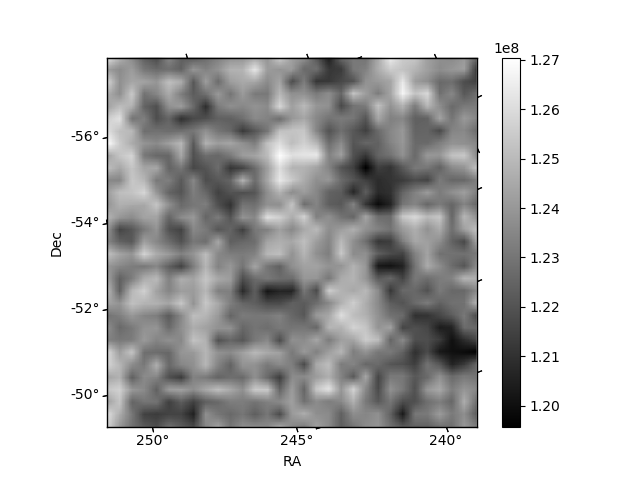
Histogram calculated using DETX and DETY for each event in the final _common_clean file
| Quadrant A |  |
 |
Quadrant B |
|---|---|---|---|
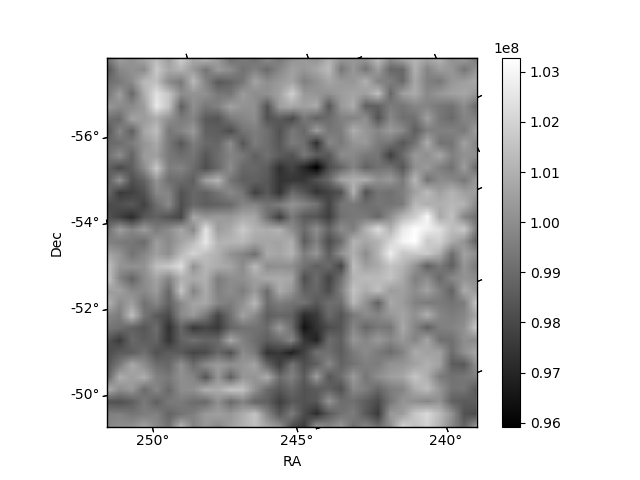
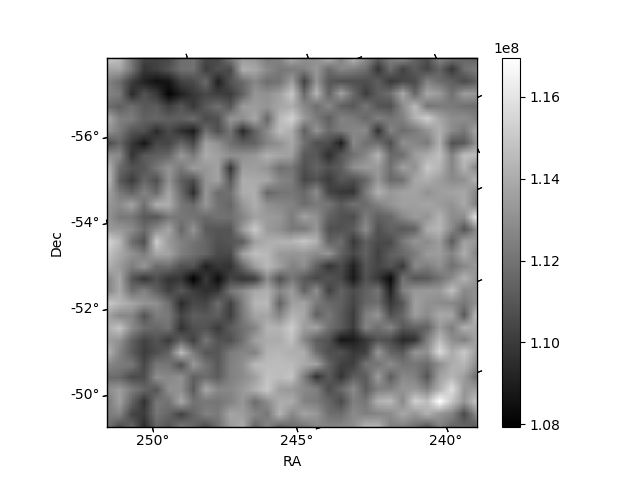
| Quadrant D | 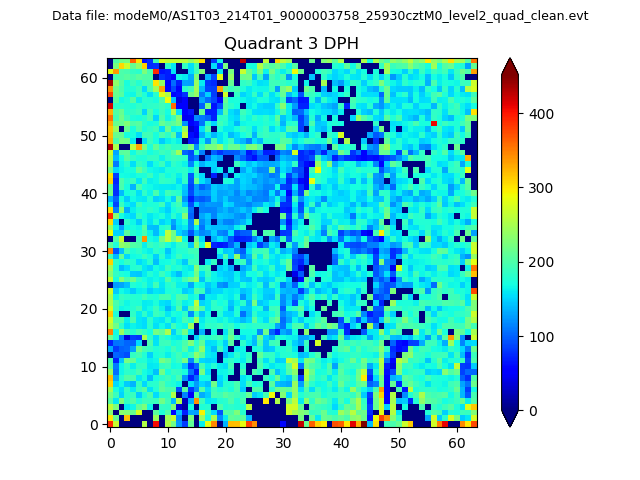 |
 |
Quadrant C |
| Plot type | Count rate plots | Images |
|---|---|---|
| Comparison with Poisson distribution Blue bars denote a histogram of data divided into 1 sec bins. Red curve is a Poisson curve with rate = median count rate of data. |
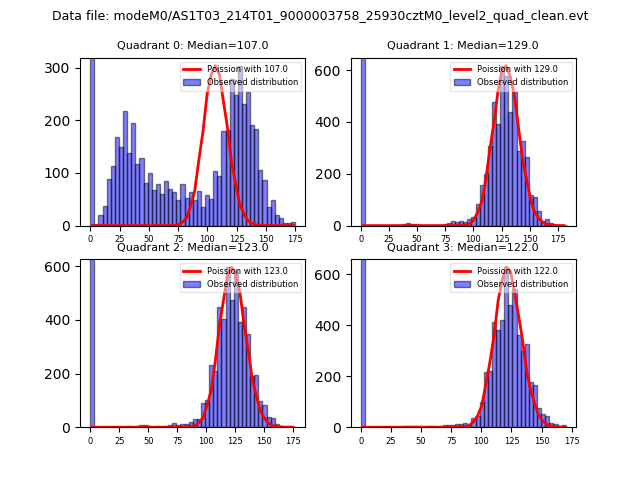 |
 |
| Quadrant-wise count rates Data is divided into 100 sec bins |
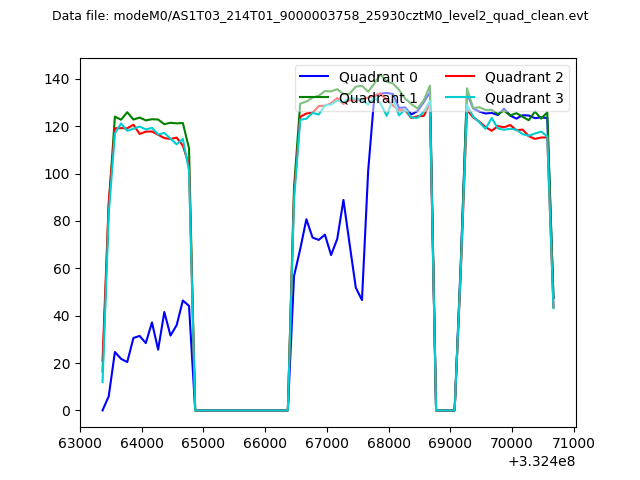 |
|
| Module-wise count rates for Quadrant A Data is divided into 100 sec bins |
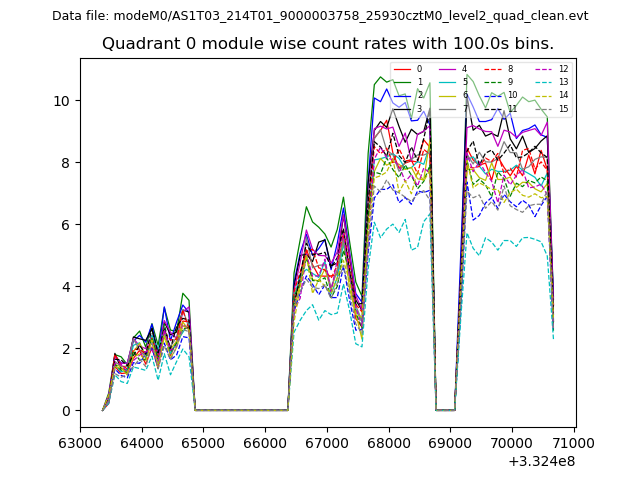 |
 |
| Module-wise count rates for Quadrant B Data is divided into 100 sec bins |
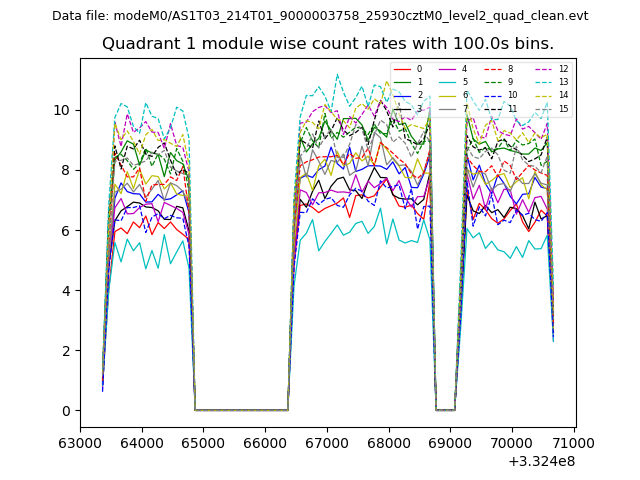 |
 |
| Module-wise count rates for Quadrant C Data is divided into 100 sec bins |
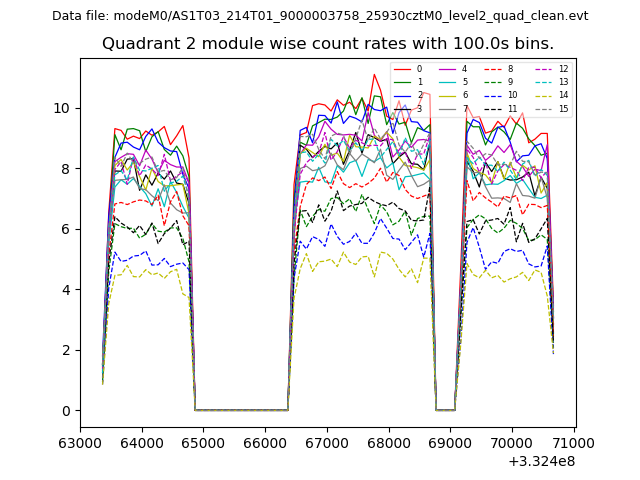 |
 |
| Module-wise count rates for Quadrant D Data is divided into 100 sec bins |
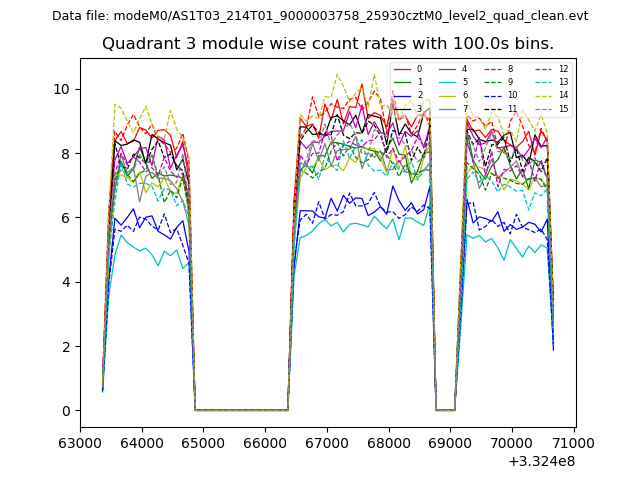 |
 |
| Parameter | Plot |
|---|---|
| CZT HV Monitor | 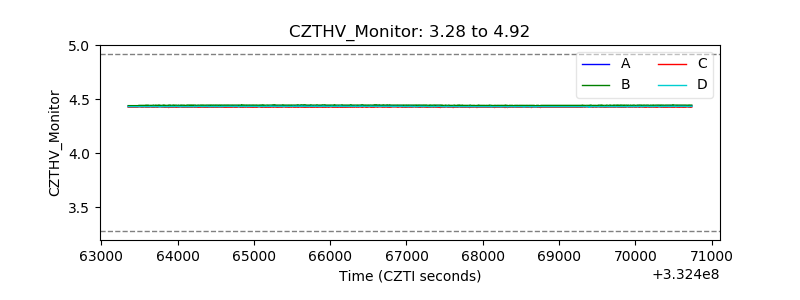 |
| D_VDD | 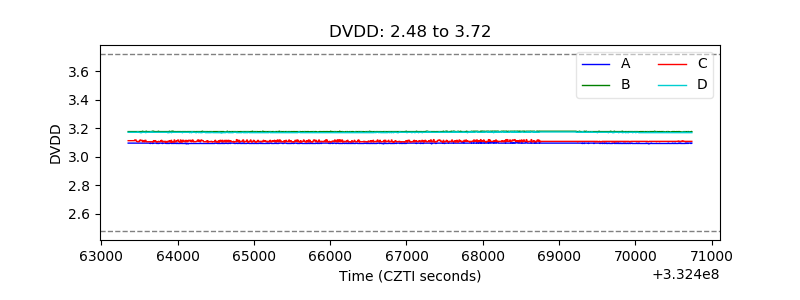 |
| Temperature 1 | 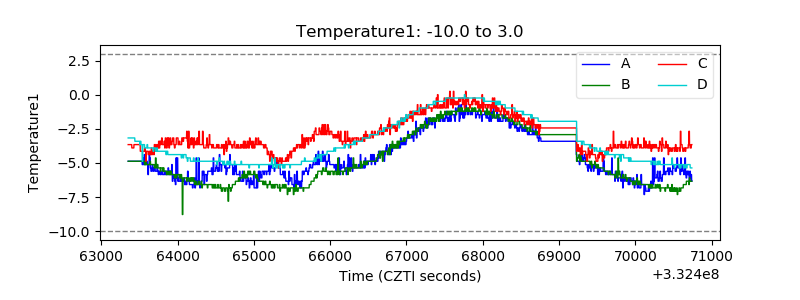 |
| Veto HV Monitor | 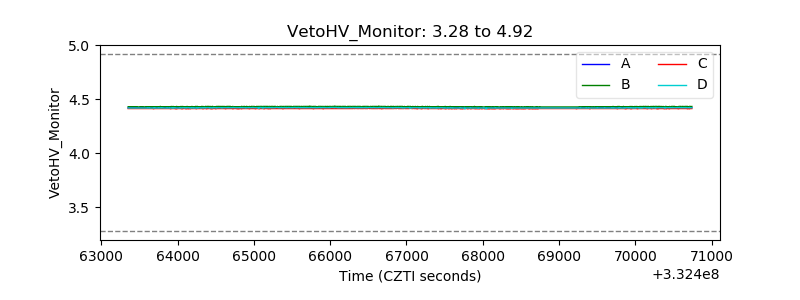 |
| Veto LLD | 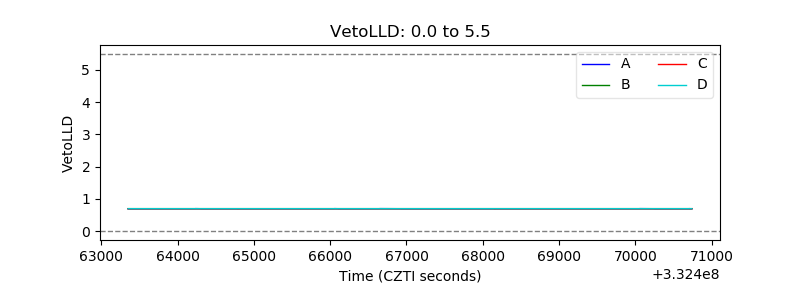 |
| Alpha Counter | 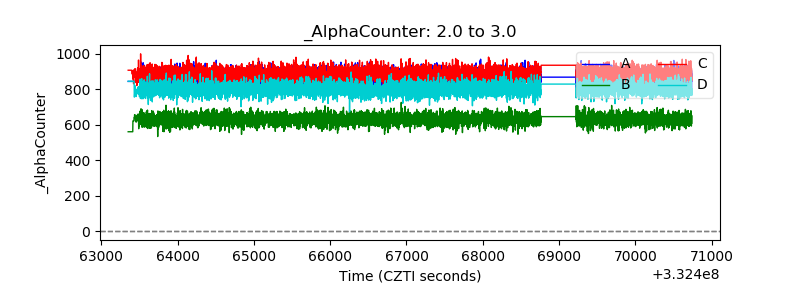 |
| _CPM_Rate | 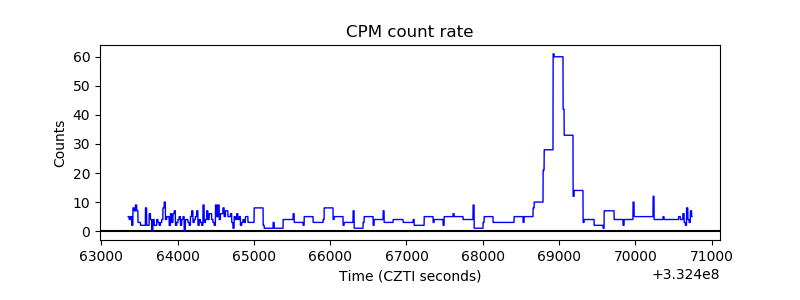 |
| CZT Counter | 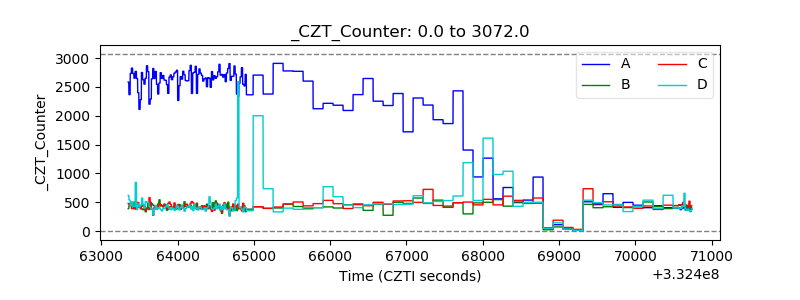 |
| +2.5 Volts monitor |  |
| +5 Volts monitor |  |
| _ROLL_ROT | 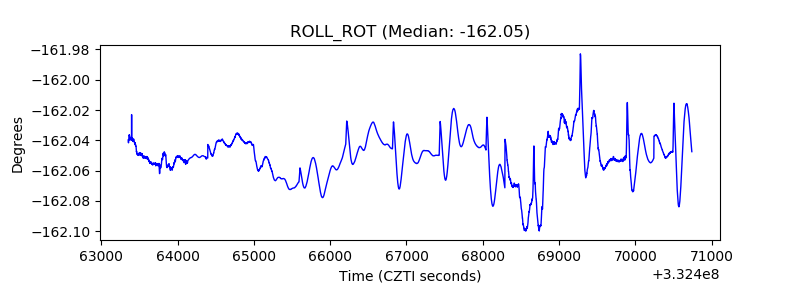 |
| _Roll_DEC | 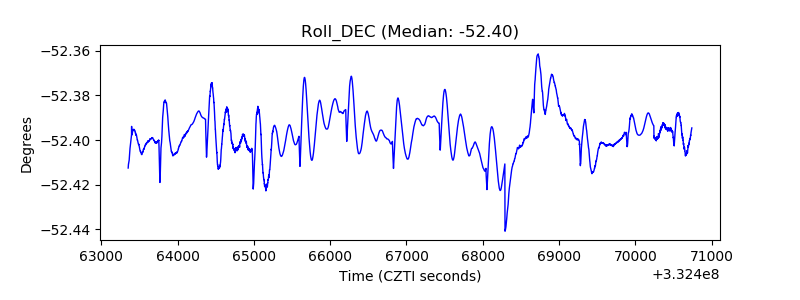 |
| _Roll_RA | 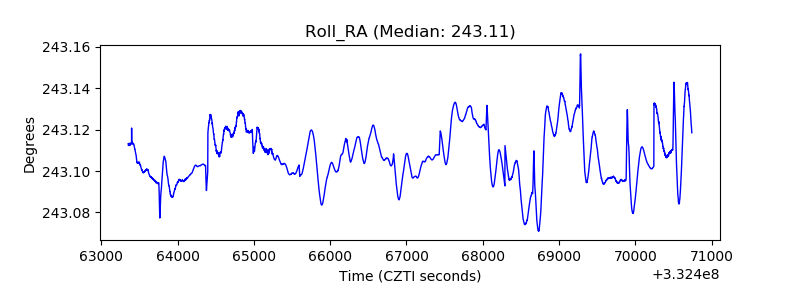 |
| Veto Counter | 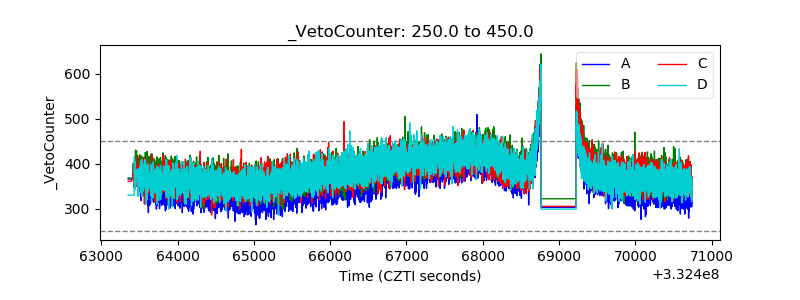 |