| Param | Original file | Final file |
|---|---|---|
| Filename | modeM0/AS1T03_214T01_9000003758_25932cztM0_level2.evt | modeM0/AS1T03_214T01_9000003758_25932cztM0_level2_quad_clean.evt |
| Size (bytes) | 348,238,080 | 71,101,440 |
| Size | 332.1 MB | 67.8 MB |
| Events in quadrant A | 2,496,565 | 451,721 |
| Events in quadrant B | 2,442,970 | 456,501 |
| Events in quadrant C | 2,487,836 | 438,157 |
| Events in quadrant D | 2,754,729 | 432,736 |
| Mode M0 | |||
|---|---|---|---|
| Quadrant | BADHDUFLAG | Total packets | Discarded packets |
| A | 0 | 10784 | 0 |
| B | 0 | 10594 | 0 |
| C | 0 | 10790 | 0 |
| D | 0 | 11899 | 0 |
| Mode M9 | |||
|---|---|---|---|
| Quadrant | BADHDUFLAG | Total packets | Discarded packets |
| A | 0 | 10 | 4 |
| B | 0 | 9 | 3 |
| C | 0 | 10 | 4 |
| D | 0 | 10 | 4 |
| Quadrant | Total seconds | Saturated seconds | Saturation percentage |
|---|---|---|---|
| A | 5197 | 9 | 0.173177% |
| B | 5209 | 17 | 0.326358% |
| C | 5231 | 30 | 0.573504% |
| D | 5218 | 22 | 0.421617% |
Noise dominated data is calculated using 1-second bins in cleaned event files. If a bin has >2000 counts, and if more than 50% of those come from <1% of pixels, then it is considered to be noise-dominated and hence unusable.
| Quadrant | # 1 sec bins | Bins with >0 counts | Bins with >2000 counts | High rate bins dominated by noise | Noise dominated (total time) | Noise dominated (detector-on time) | Marked lightcurve |
|---|---|---|---|---|---|---|---|
| A | 6805 | 5362 | 0 | 0 | 0.00% | 0.00% | 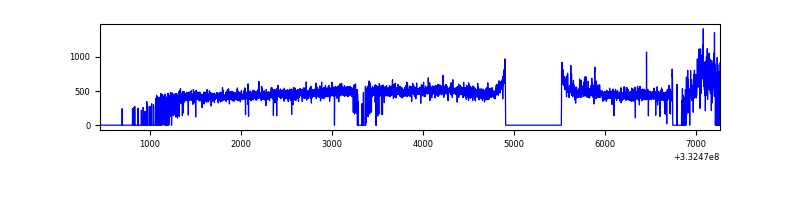 |
| B | 6696 | 5360 | 1 | 1 | 0.01% | 0.02% | 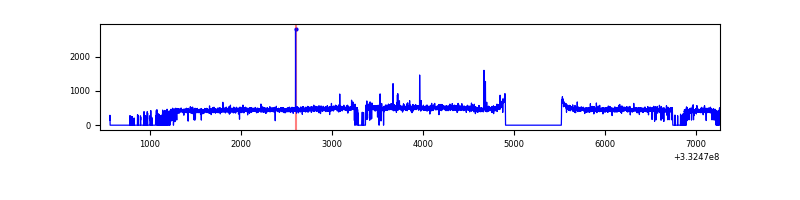 |
| C | 6578 | 5380 | 0 | 0 | 0.00% | 0.00% | 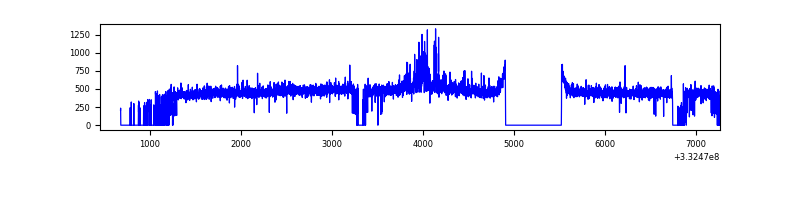 |
| D | 6683 | 5365 | 8 | 8 | 0.12% | 0.15% | 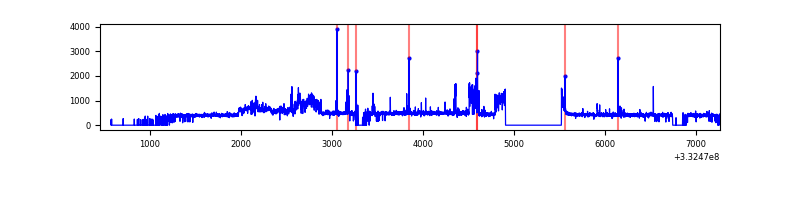 |
Top three noisy pixels from each quadrant. If the there are fewer than three noisy pixels in the level2.evt file, extra rows are filled as -1
| Pixel properties | Quadrant properties | ||||||
|---|---|---|---|---|---|---|---|
| Quadrant | DetID | PixID | Counts | Sigma | Mean | Median | Sigma |
| A | 0 | 13 | 116665 | 921.35 | 616 | 602 | 126.0 |
| A | 13 | 254 | 8118 | 59.66 | 616 | 602 | 126.0 |
| A | 3 | 137 | 5834 | 41.53 | 616 | 602 | 126.0 |
| B | 12 | 111 | 14457 | 117.78 | 615 | 599 | 117.7 |
| B | 0 | 190 | 13184 | 106.96 | 615 | 599 | 117.7 |
| B | 11 | 111 | 12913 | 104.66 | 615 | 599 | 117.7 |
| C | 14 | 238 | 95972 | 684.89 | 591 | 592 | 139.3 |
| C | 3 | 233 | 83864 | 597.95 | 591 | 592 | 139.3 |
| C | 13 | 61 | 4053 | 24.85 | 591 | 592 | 139.3 |
| D | 1 | 52 | 438001 | 3079.3 | 596 | 583 | 142.1 |
| D | 2 | 234 | 22558 | 154.7 | 596 | 583 | 142.1 |
| D | 2 | 120 | 17462 | 118.82 | 596 | 583 | 142.1 |
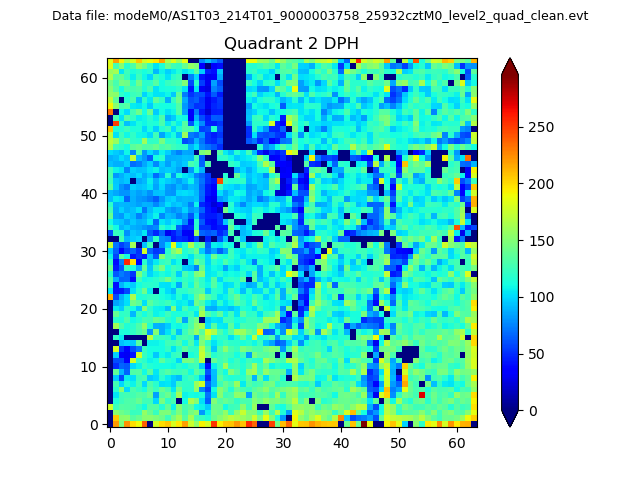
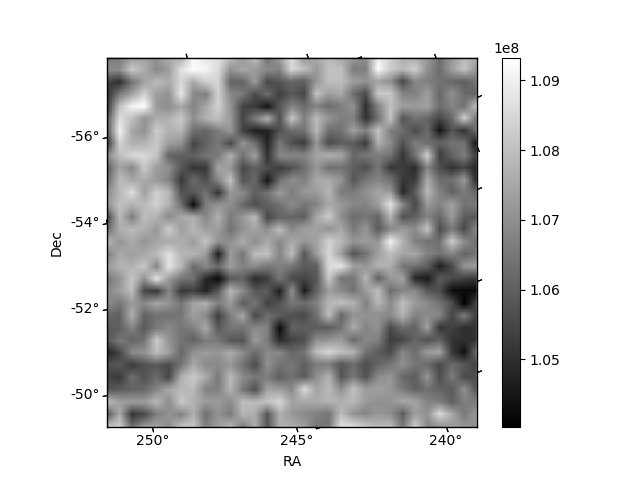
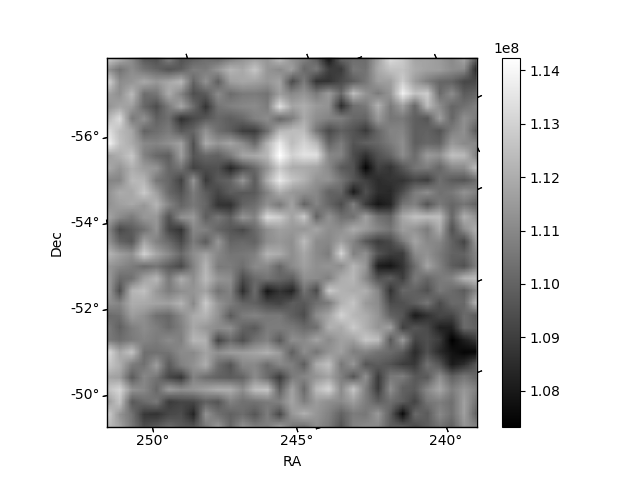
Histogram calculated using DETX and DETY for each event in the final _common_clean file
| Quadrant A |  |
 |
Quadrant B |
|---|---|---|---|
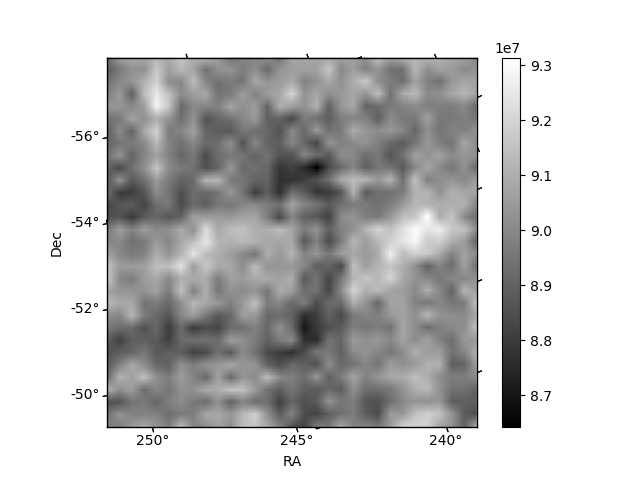
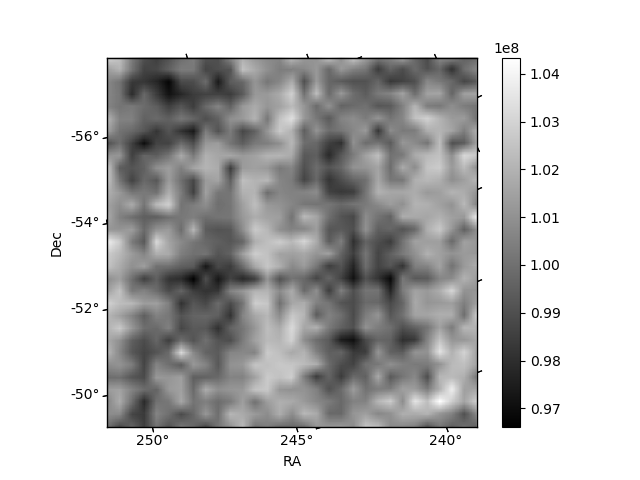
| Quadrant D |  |
 |
Quadrant C |
| Plot type | Count rate plots | Images |
|---|---|---|
| Comparison with Poisson distribution Blue bars denote a histogram of data divided into 1 sec bins. Red curve is a Poisson curve with rate = median count rate of data. |
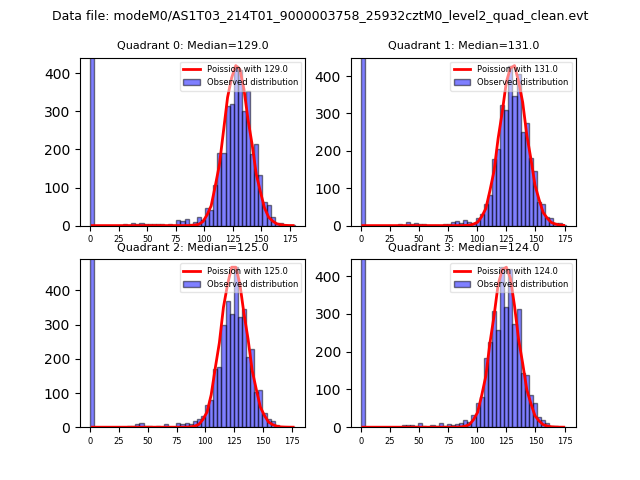 |
 |
| Quadrant-wise count rates Data is divided into 100 sec bins |
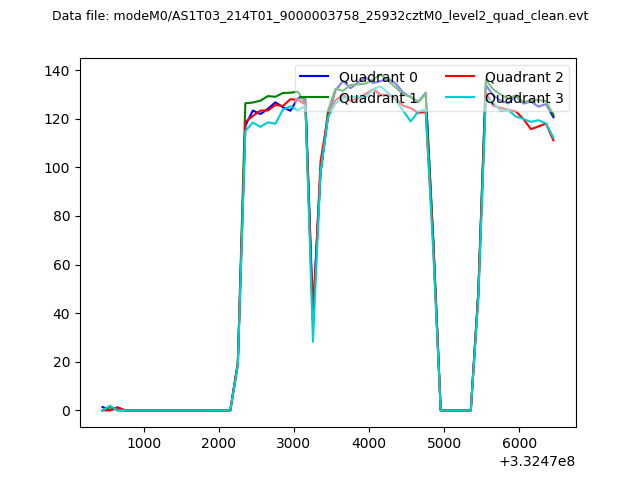 |
|
| Module-wise count rates for Quadrant A Data is divided into 100 sec bins |
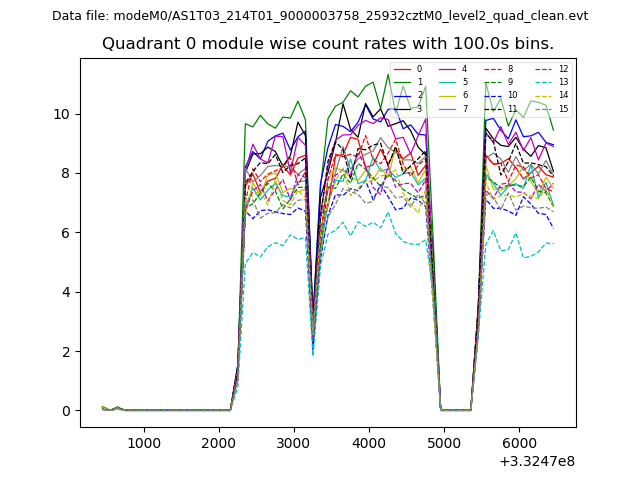 |
 |
| Module-wise count rates for Quadrant B Data is divided into 100 sec bins |
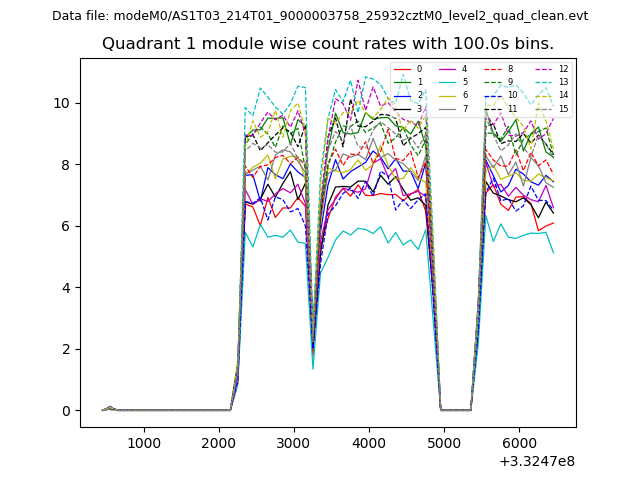 |
 |
| Module-wise count rates for Quadrant C Data is divided into 100 sec bins |
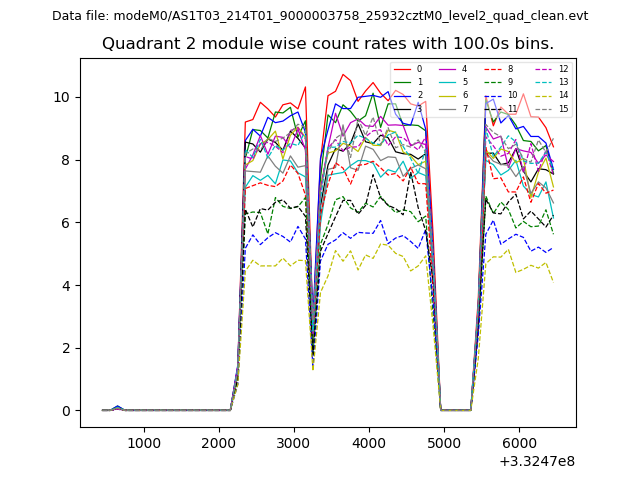 |
 |
| Module-wise count rates for Quadrant D Data is divided into 100 sec bins |
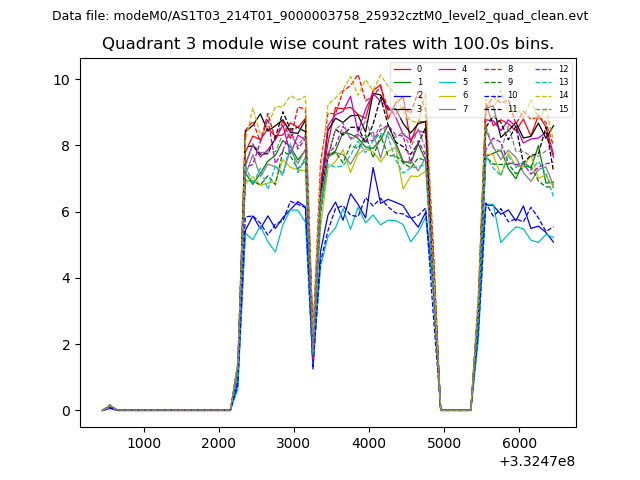 |
 |
| Parameter | Plot |
|---|---|
| CZT HV Monitor | 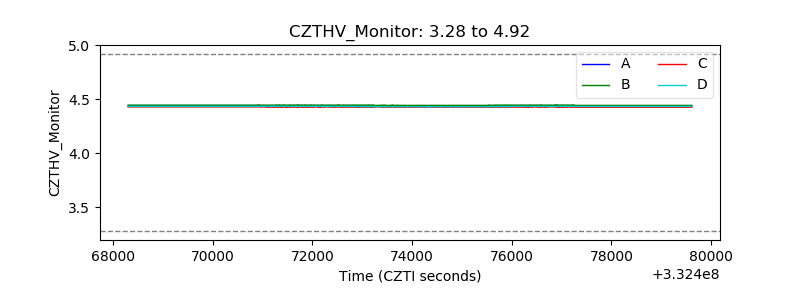 |
| D_VDD | 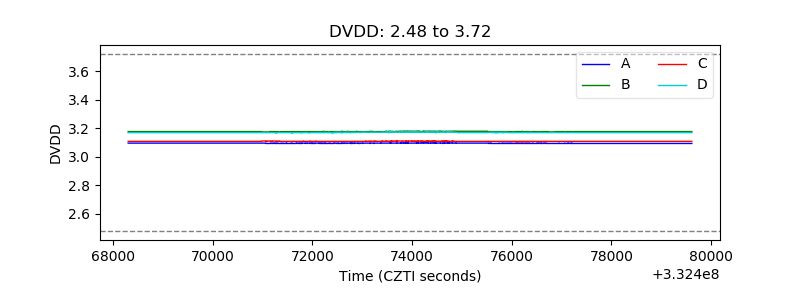 |
| Temperature 1 | 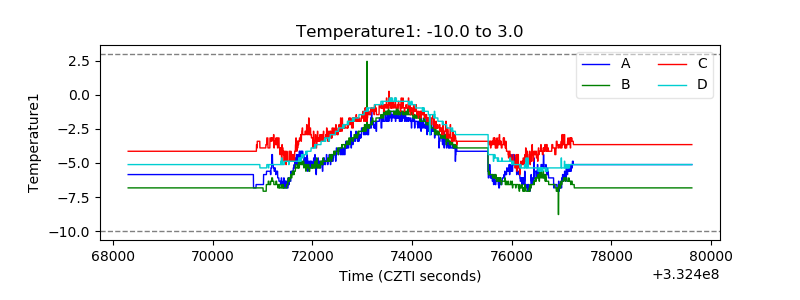 |
| Veto HV Monitor | 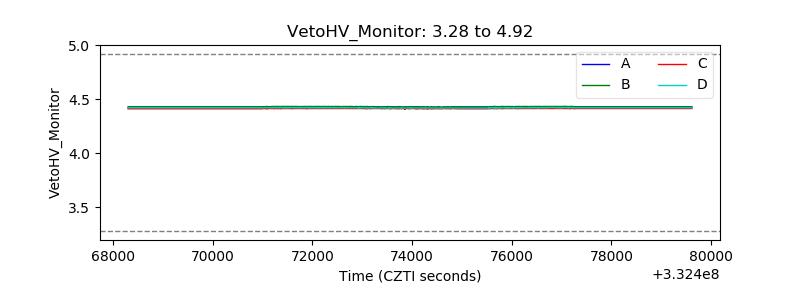 |
| Veto LLD | 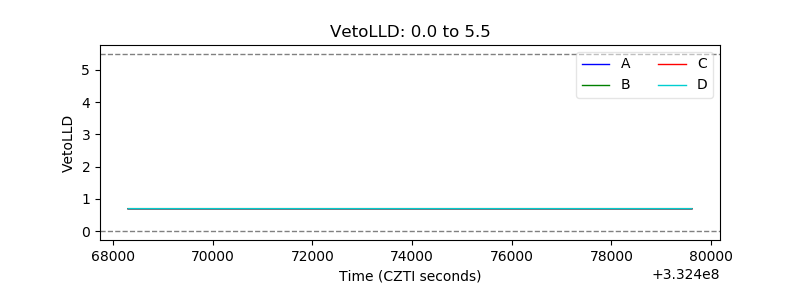 |
| Alpha Counter | 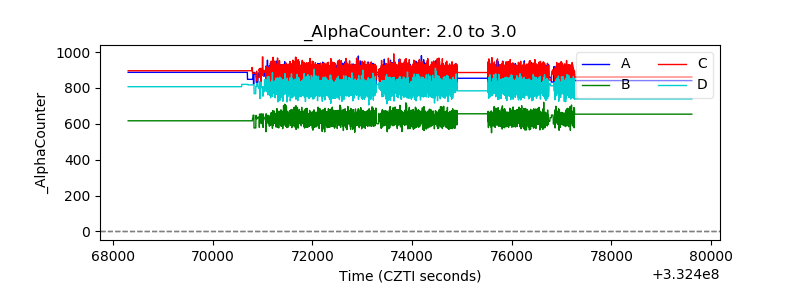 |
| _CPM_Rate | 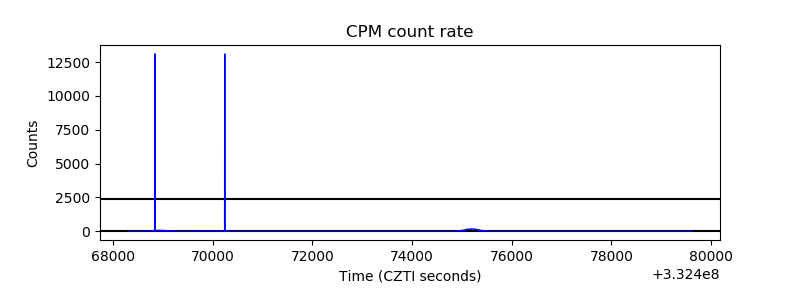 |
| CZT Counter | 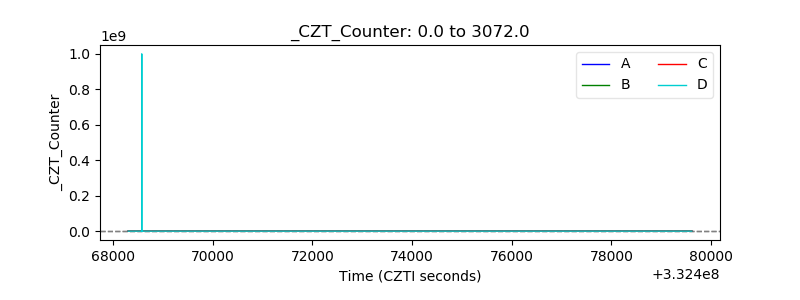 |
| +2.5 Volts monitor |  |
| +5 Volts monitor | 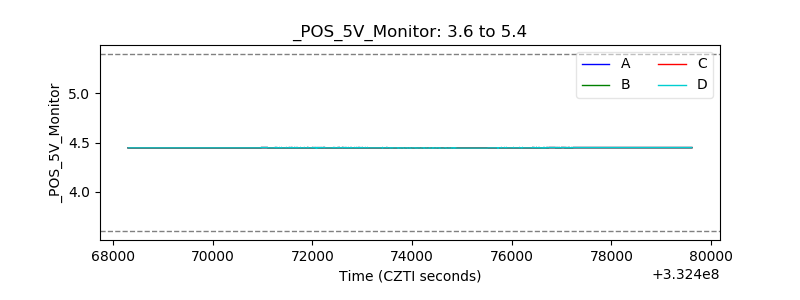 |
| _ROLL_ROT | 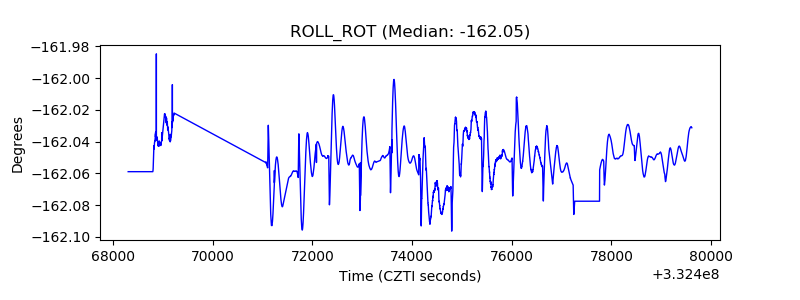 |
| _Roll_DEC | 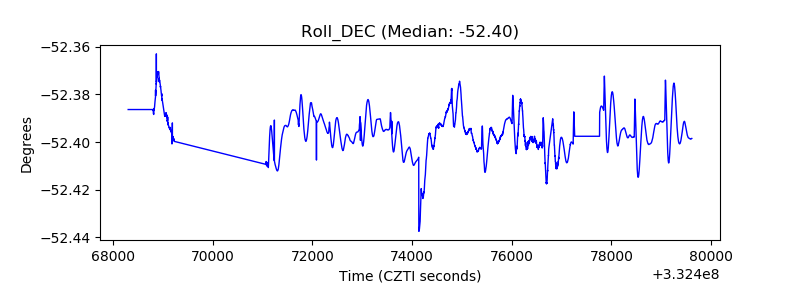 |
| _Roll_RA | 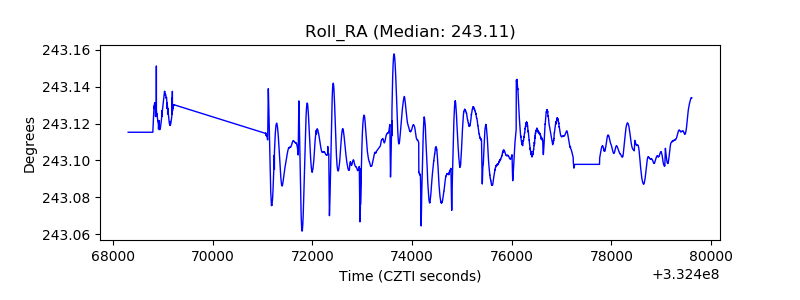 |
| Veto Counter | 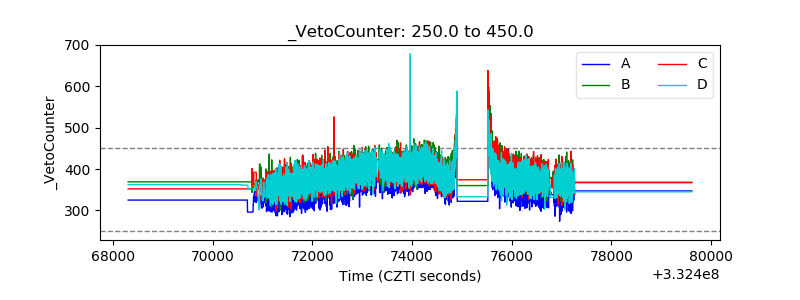 |