| Param | Original file | Final file |
|---|---|---|
| Filename | modeM0/AS1T03_214T01_9000003758_25933cztM0_level2.evt | modeM0/AS1T03_214T01_9000003758_25933cztM0_level2_quad_clean.evt |
| Size (bytes) | 3,827,088,000 | 421,502,400 |
| Size | 3.6 GB | 402.0 MB |
| Events in quadrant A | 60,538,548 | 1,715,683 |
| Events in quadrant B | 16,151,538 | 3,014,762 |
| Events in quadrant C | 16,164,721 | 2,884,209 |
| Events in quadrant D | 20,749,131 | 2,797,280 |
| Mode M0 | |||
|---|---|---|---|
| Quadrant | BADHDUFLAG | Total packets | Discarded packets |
| A | 0 | 203149 | 0 |
| B | 0 | 70314 | 0 |
| C | 0 | 70174 | 0 |
| D | 0 | 85702 | 0 |
| Mode M9 | |||
|---|---|---|---|
| Quadrant | BADHDUFLAG | Total packets | Discarded packets |
| A | 0 | 33 | 5 |
| B | 0 | 33 | 5 |
| C | 0 | 33 | 4 |
| D | 0 | 34 | 6 |
| Quadrant | Total seconds | Saturated seconds | Saturation percentage |
|---|---|---|---|
| A | 34060 | 19702 | 57.844979% |
| B | 34206 | 169 | 0.494065% |
| C | 34217 | 292 | 0.853377% |
| D | 34118 | 1246 | 3.652031% |
Noise dominated data is calculated using 1-second bins in cleaned event files. If a bin has >2000 counts, and if more than 50% of those come from <1% of pixels, then it is considered to be noise-dominated and hence unusable.
| Quadrant | # 1 sec bins | Bins with >0 counts | Bins with >2000 counts | High rate bins dominated by noise | Noise dominated (total time) | Noise dominated (detector-on time) | Marked lightcurve |
|---|---|---|---|---|---|---|---|
| A | 38435 | 34172 | 17524 | 17524 | 45.59% | 51.28% | 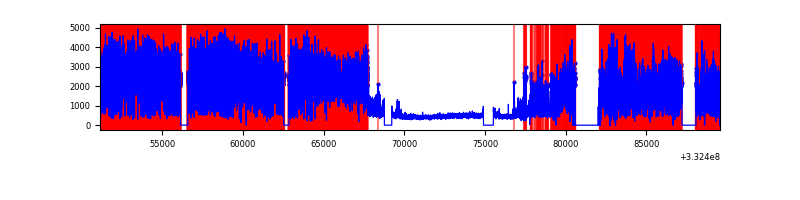 |
| B | 38435 | 34313 | 2 | 2 | 0.01% | 0.01% | 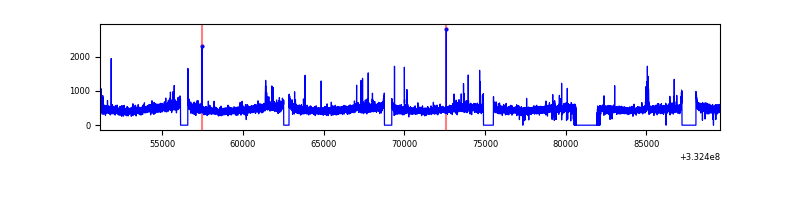 |
| C | 38435 | 34306 | 3 | 3 | 0.01% | 0.01% | 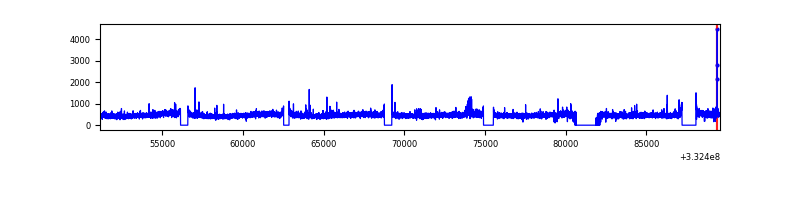 |
| D | 38435 | 34217 | 964 | 964 | 2.51% | 2.82% | 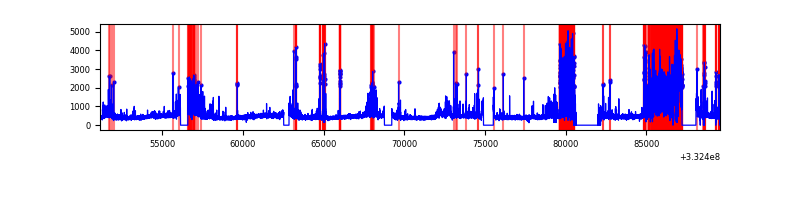 |
Top three noisy pixels from each quadrant. If the there are fewer than three noisy pixels in the level2.evt file, extra rows are filled as -1
| Pixel properties | Quadrant properties | ||||||
|---|---|---|---|---|---|---|---|
| Quadrant | DetID | PixID | Counts | Sigma | Mean | Median | Sigma |
| A | 0 | 13 | 50476284 | 97521.85 | 2604 | 2550 | 517.6 |
| A | 13 | 254 | 35492 | 63.65 | 2604 | 2550 | 517.6 |
| A | 3 | 137 | 23768 | 41.0 | 2604 | 2550 | 517.6 |
| B | 0 | 190 | 160190 | 207.18 | 4034 | 3934 | 754.2 |
| B | 0 | 219 | 103683 | 132.26 | 4034 | 3934 | 754.2 |
| B | 12 | 111 | 94138 | 119.6 | 4034 | 3934 | 754.2 |
| C | 14 | 238 | 619506 | 680.08 | 3876 | 3884 | 905.2 |
| C | 3 | 233 | 376177 | 411.27 | 3876 | 3884 | 905.2 |
| C | 2 | 16 | 65273 | 67.82 | 3876 | 3884 | 905.2 |
| D | 1 | 52 | 5487031 | 5985.09 | 3858 | 3767 | 916.2 |
| D | 7 | 80 | 479158 | 518.9 | 3858 | 3767 | 916.2 |
| D | 2 | 234 | 146978 | 156.32 | 3858 | 3767 | 916.2 |
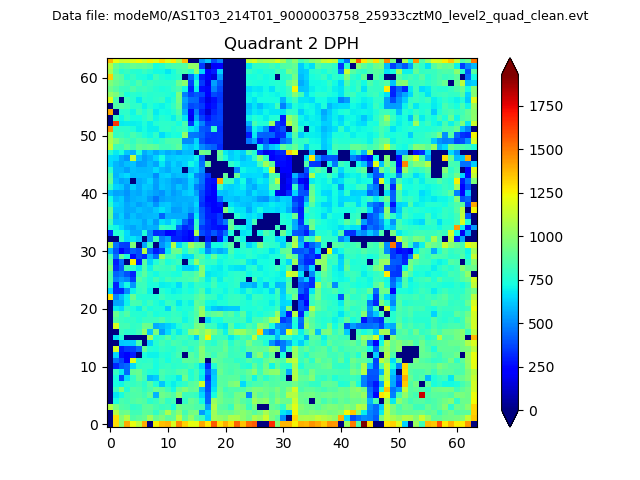
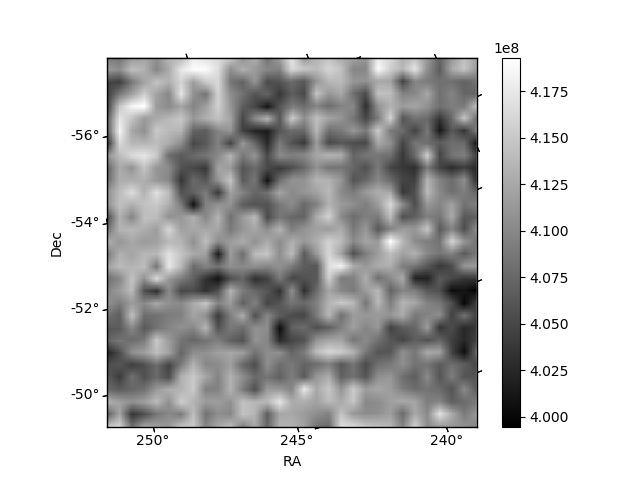
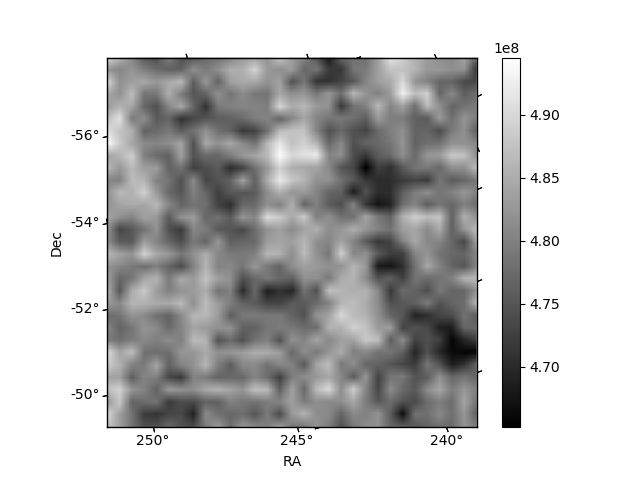
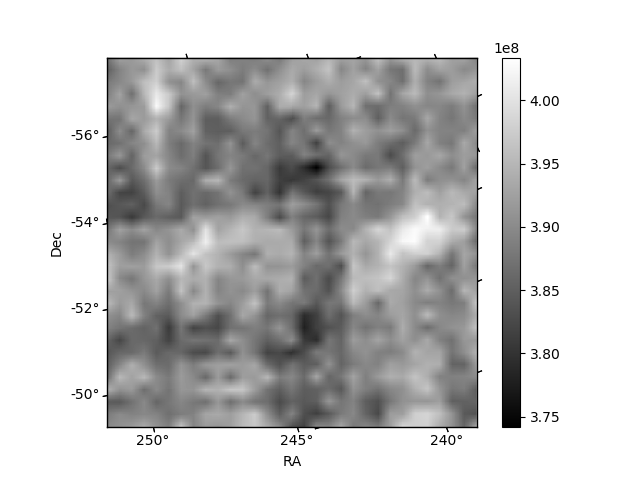
Histogram calculated using DETX and DETY for each event in the final _common_clean file
| Quadrant A |  |
 |
Quadrant B |
|---|---|---|---|
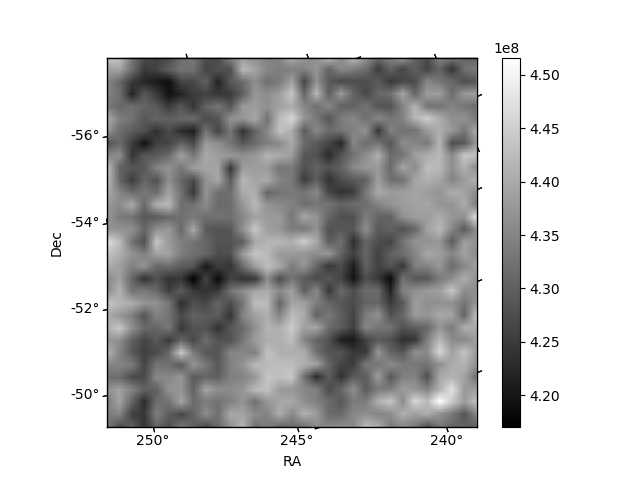
| Quadrant D | 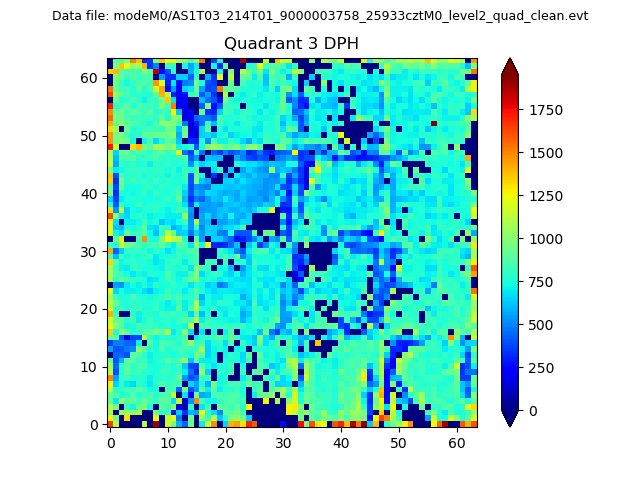 |
 |
Quadrant C |
| Plot type | Count rate plots | Images |
|---|---|---|
| Comparison with Poisson distribution Blue bars denote a histogram of data divided into 1 sec bins. Red curve is a Poisson curve with rate = median count rate of data. |
 |
 |
| Quadrant-wise count rates Data is divided into 100 sec bins |
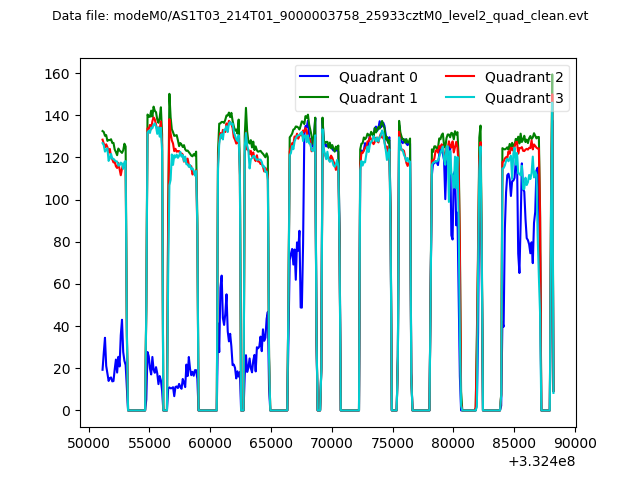 |
|
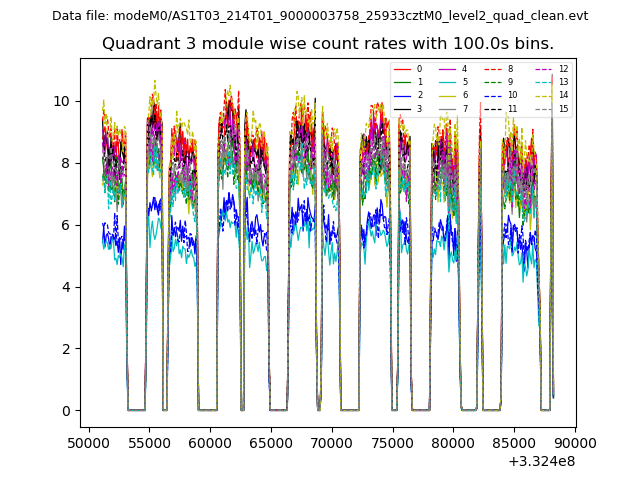
| Module-wise count rates for Quadrant A Data is divided into 100 sec bins |
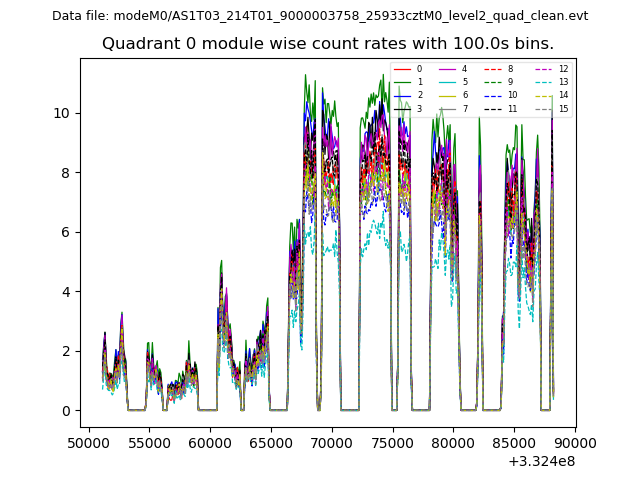 |
 |
| Module-wise count rates for Quadrant B Data is divided into 100 sec bins |
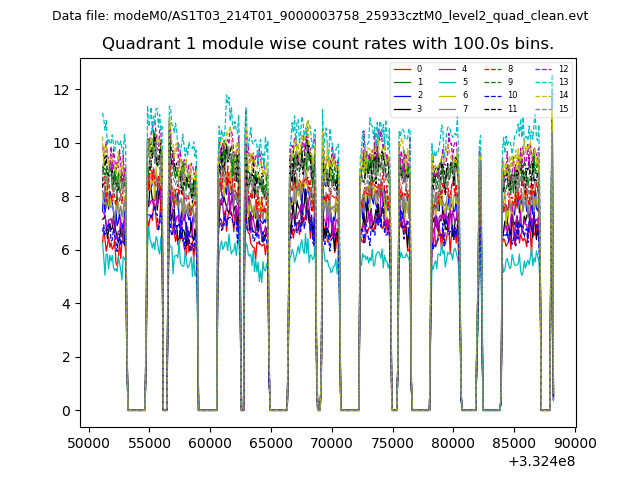 |
 |
| Module-wise count rates for Quadrant C Data is divided into 100 sec bins |
 |
 |
| Module-wise count rates for Quadrant D Data is divided into 100 sec bins |
 |
 |
| Parameter | Plot |
|---|---|
| CZT HV Monitor |  |
| D_VDD | 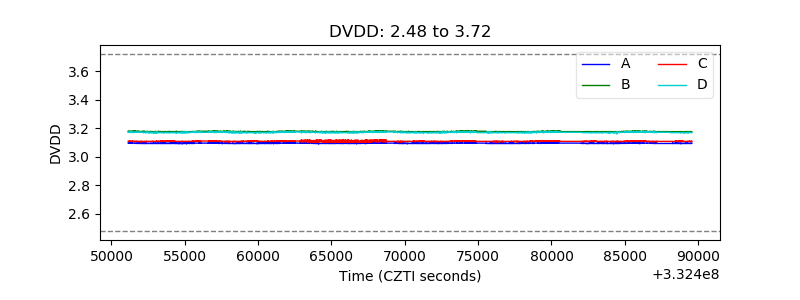 |
| Temperature 1 | 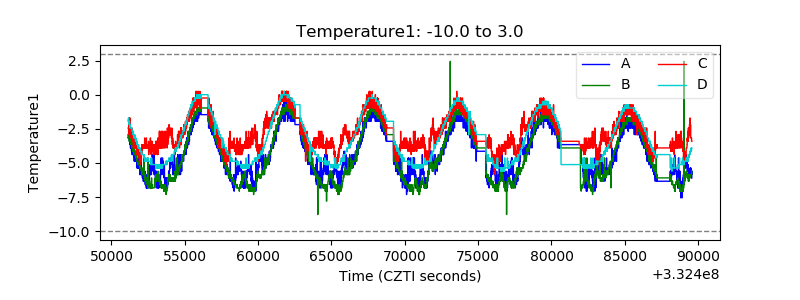 |
| Veto HV Monitor | 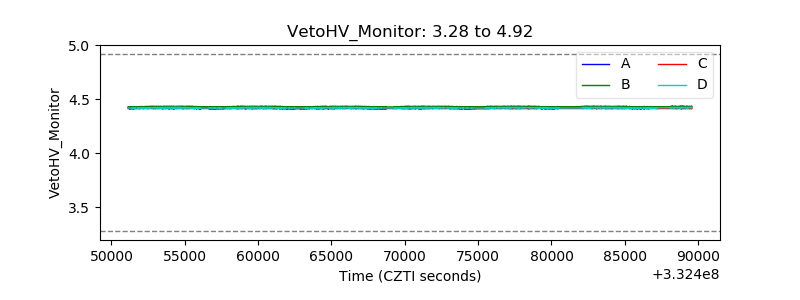 |
| Veto LLD | 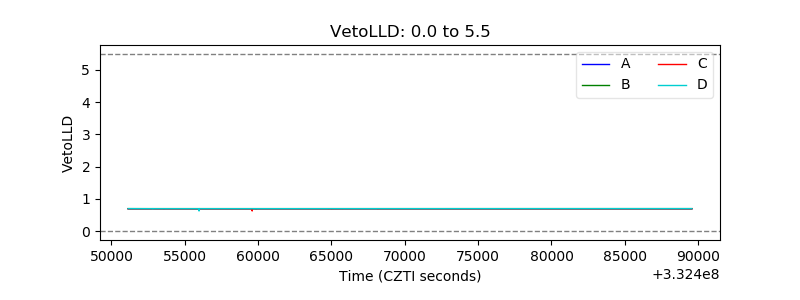 |
| Alpha Counter | 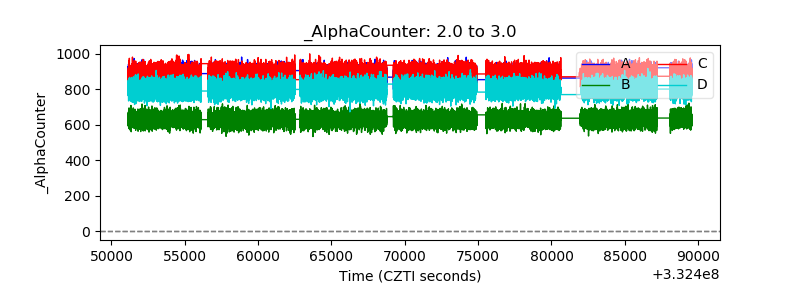 |
| _CPM_Rate | 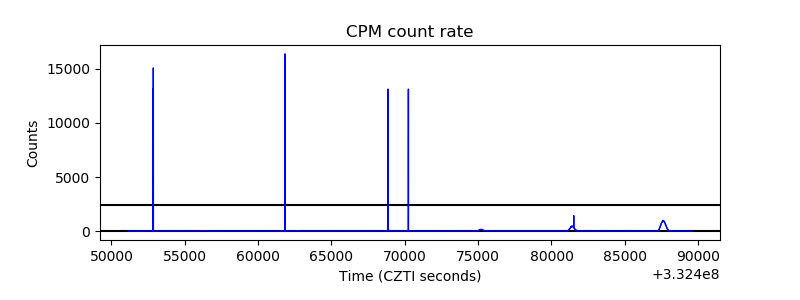 |
| CZT Counter | 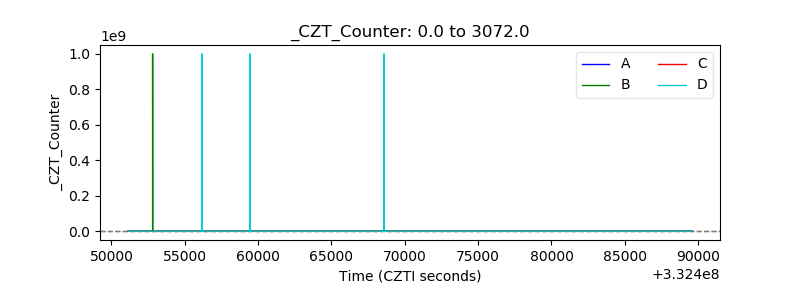 |
| +2.5 Volts monitor |  |
| +5 Volts monitor |  |
| _ROLL_ROT | 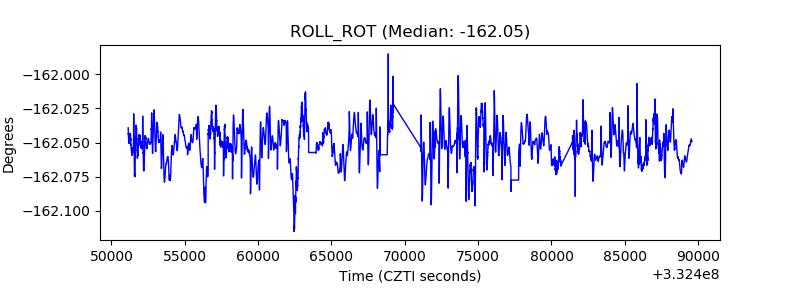 |
| _Roll_DEC | 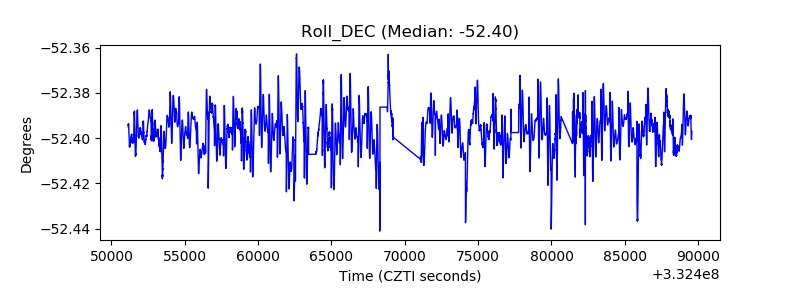 |
| _Roll_RA | 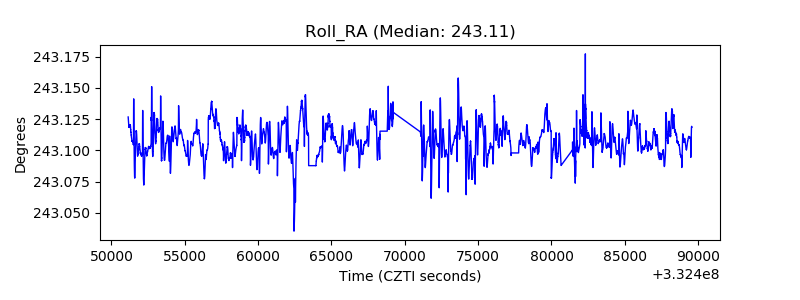 |
| Veto Counter | 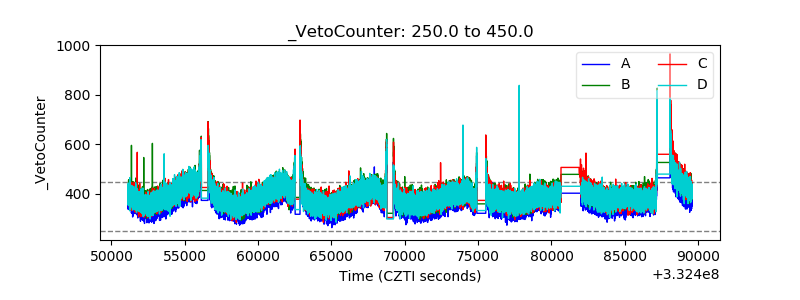 |