| Param | Original file | Final file |
|---|---|---|
| Filename | modeM0/AS1T03_214T01_9000003758_25934cztM0_level2.evt | modeM0/AS1T03_214T01_9000003758_25934cztM0_level2_quad_clean.evt |
| Size (bytes) | 727,865,280 | 71,245,440 |
| Size | 694.1 MB | 67.9 MB |
| Events in quadrant A | 10,924,267 | 294,085 |
| Events in quadrant B | 3,307,587 | 479,284 |
| Events in quadrant C | 3,414,237 | 462,301 |
| Events in quadrant D | 3,949,482 | 458,861 |
| Mode M0 | |||
|---|---|---|---|
| Quadrant | BADHDUFLAG | Total packets | Discarded packets |
| A | 0 | 37091 | 0 |
| B | 0 | 13934 | 0 |
| C | 0 | 14320 | 0 |
| D | 0 | 16086 | 0 |
| Mode M9 | |||
|---|---|---|---|
| Quadrant | BADHDUFLAG | Total packets | Discarded packets |
| A | 0 | 11 | 0 |
| B | 0 | 11 | 0 |
| C | 0 | 11 | 0 |
| D | 0 | 11 | 0 |
| Quadrant | Total seconds | Saturated seconds | Saturation percentage |
|---|---|---|---|
| A | 6630 | 2781 | 41.945701% |
| B | 6631 | 47 | 0.708792% |
| C | 6630 | 117 | 1.764706% |
| D | 6630 | 144 | 2.171946% |
Noise dominated data is calculated using 1-second bins in cleaned event files. If a bin has >2000 counts, and if more than 50% of those come from <1% of pixels, then it is considered to be noise-dominated and hence unusable.
| Quadrant | # 1 sec bins | Bins with >0 counts | Bins with >2000 counts | High rate bins dominated by noise | Noise dominated (total time) | Noise dominated (detector-on time) | Marked lightcurve |
|---|---|---|---|---|---|---|---|
| A | 7665 | 6631 | 2353 | 2353 | 30.70% | 35.48% | 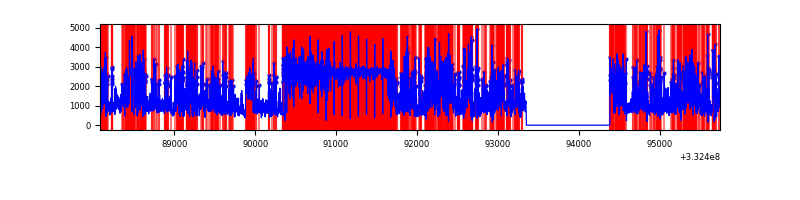 |
| B | 7666 | 6632 | 1 | 1 | 0.01% | 0.02% | 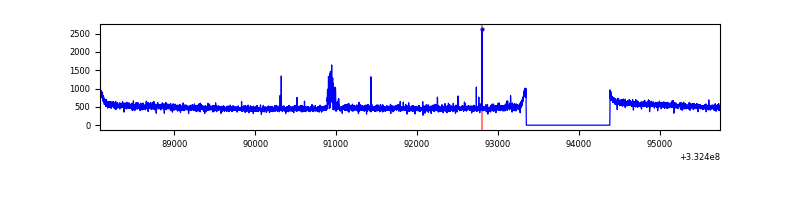 |
| C | 7665 | 6631 | 22 | 22 | 0.29% | 0.33% | 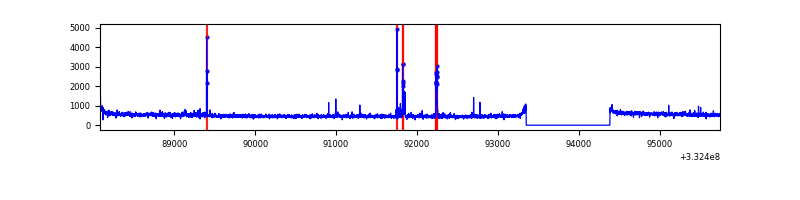 |
| D | 7665 | 6631 | 86 | 86 | 1.12% | 1.30% | 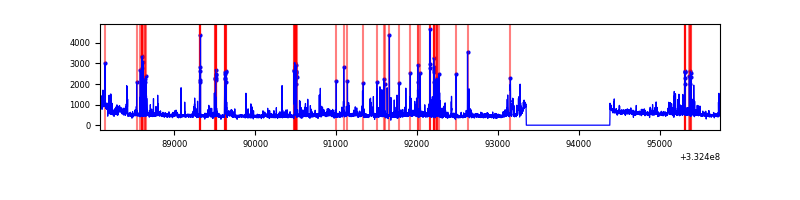 |
Top three noisy pixels from each quadrant. If the there are fewer than three noisy pixels in the level2.evt file, extra rows are filled as -1
| Pixel properties | Quadrant properties | ||||||
|---|---|---|---|---|---|---|---|
| Quadrant | DetID | PixID | Counts | Sigma | Mean | Median | Sigma |
| A | 0 | 13 | 8425898 | 65332.05 | 647 | 635 | 129.0 |
| A | 13 | 254 | 7023 | 49.53 | 647 | 635 | 129.0 |
| A | 3 | 137 | 5662 | 38.98 | 647 | 635 | 129.0 |
| B | 0 | 190 | 52092 | 329.79 | 826 | 805 | 155.5 |
| B | 12 | 111 | 19221 | 118.42 | 826 | 805 | 155.5 |
| B | 11 | 111 | 17211 | 105.5 | 826 | 805 | 155.5 |
| C | 14 | 238 | 129049 | 688.3 | 802 | 807 | 186.3 |
| C | 2 | 16 | 118951 | 634.1 | 802 | 807 | 186.3 |
| C | 3 | 233 | 44352 | 233.71 | 802 | 807 | 186.3 |
| D | 1 | 52 | 747380 | 3923.27 | 805 | 788 | 190.3 |
| D | 12 | 233 | 139978 | 731.43 | 805 | 788 | 190.3 |
| D | 2 | 234 | 27116 | 138.35 | 805 | 788 | 190.3 |
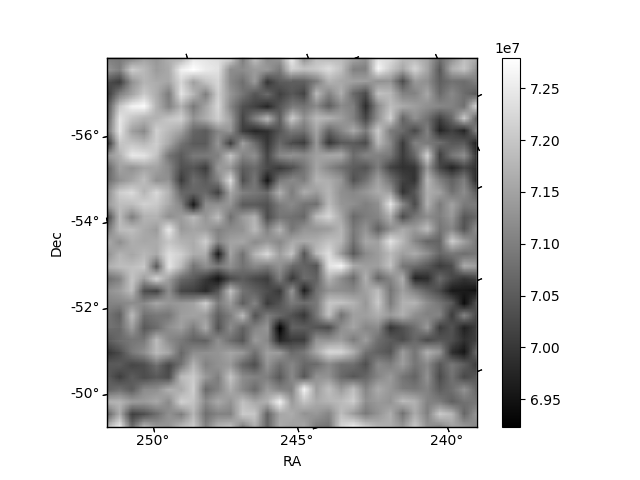
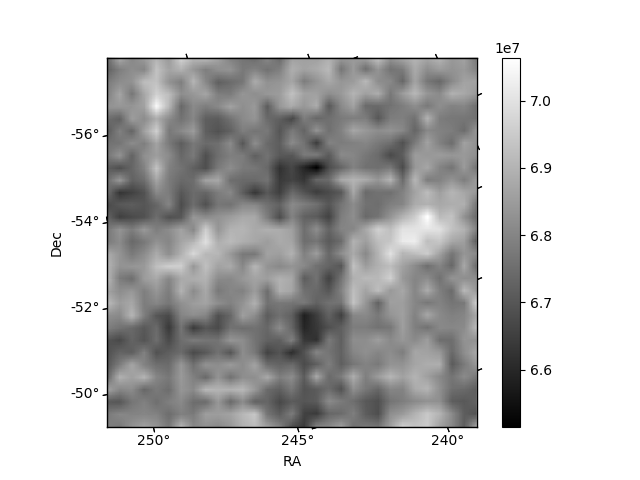
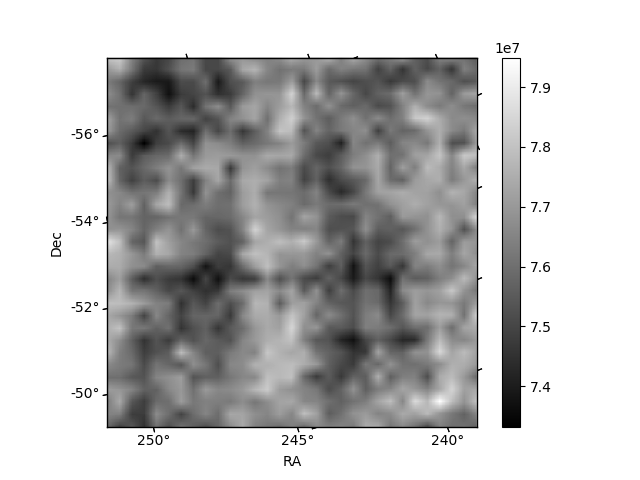
Histogram calculated using DETX and DETY for each event in the final _common_clean file
| Quadrant A | 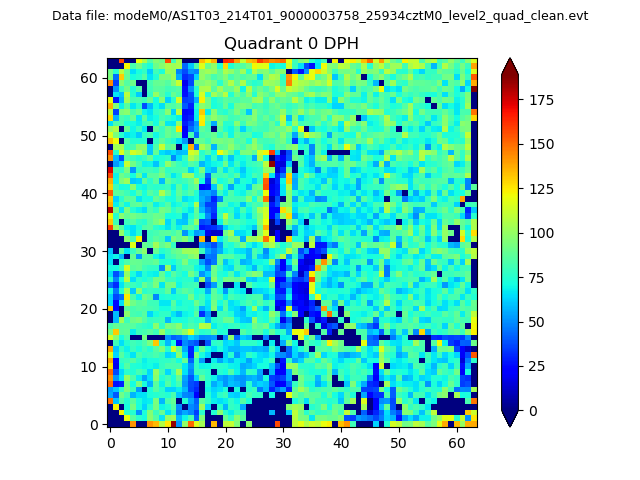 |
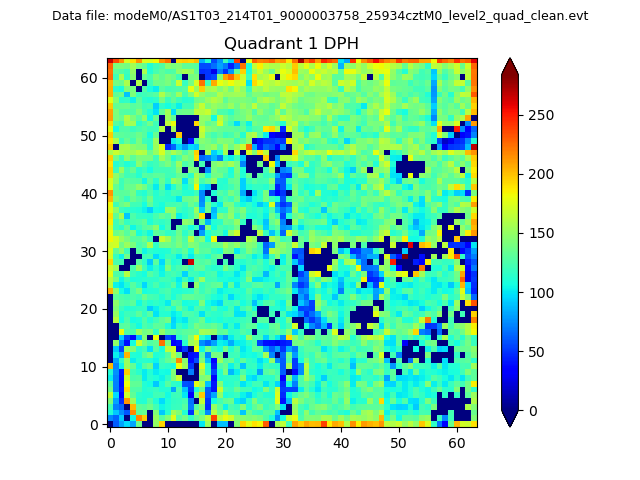 |
Quadrant B |
|---|---|---|---|
| Quadrant D | 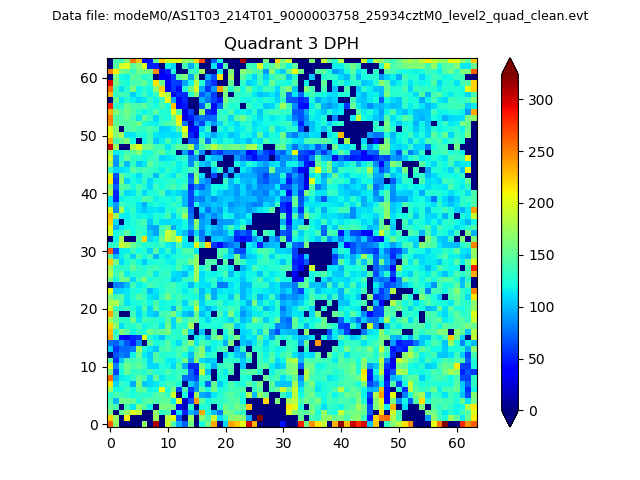 |
 |
Quadrant C |
| Plot type | Count rate plots | Images |
|---|---|---|
| Comparison with Poisson distribution Blue bars denote a histogram of data divided into 1 sec bins. Red curve is a Poisson curve with rate = median count rate of data. |
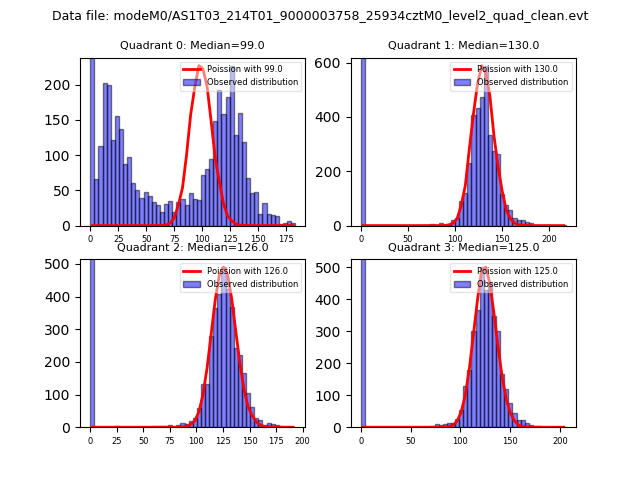 |
 |
| Quadrant-wise count rates Data is divided into 100 sec bins |
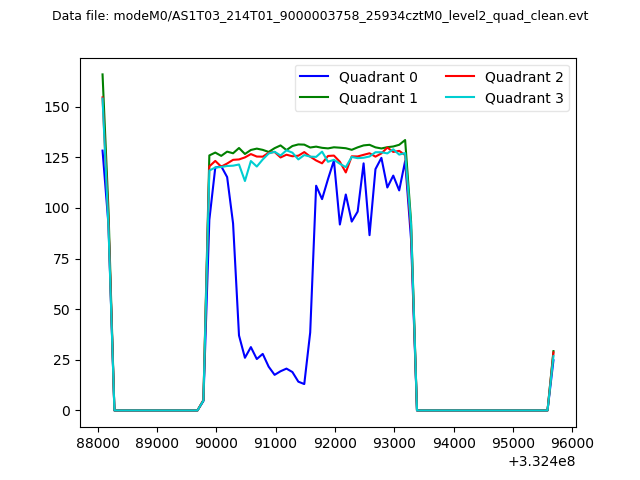 |
|
| Module-wise count rates for Quadrant A Data is divided into 100 sec bins |
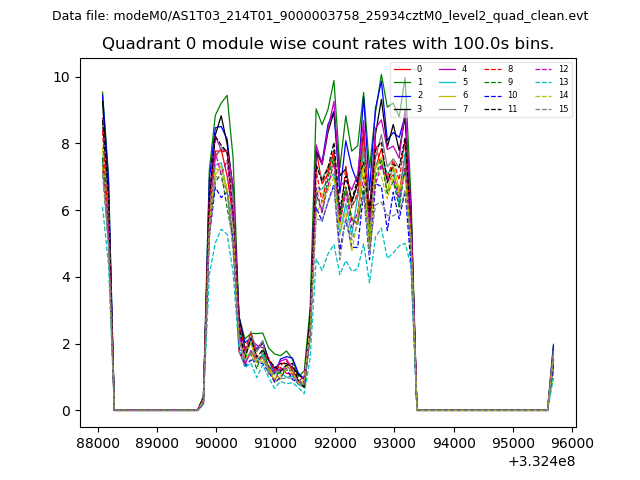 |
 |
| Module-wise count rates for Quadrant B Data is divided into 100 sec bins |
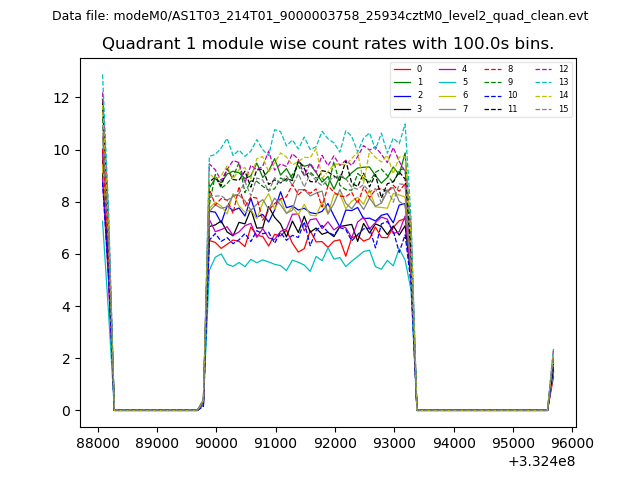 |
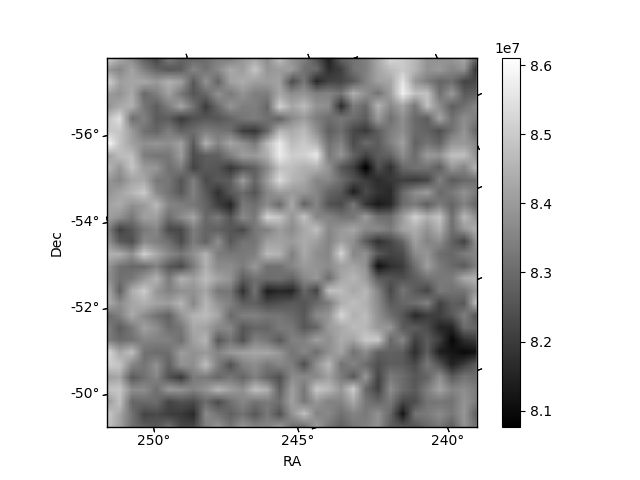 |
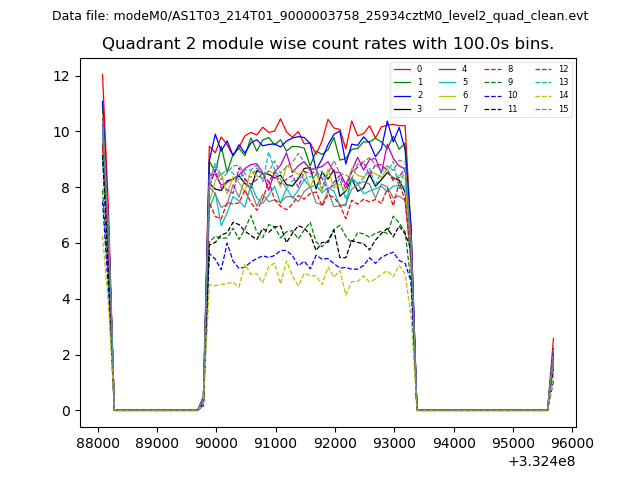
| Module-wise count rates for Quadrant C Data is divided into 100 sec bins |
 |
 |
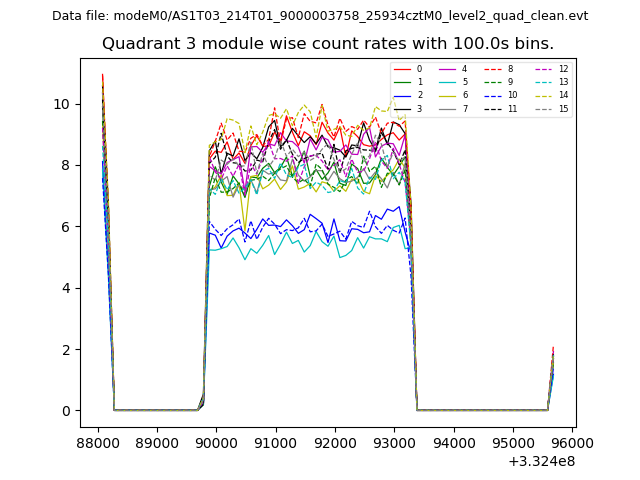
| Module-wise count rates for Quadrant D Data is divided into 100 sec bins |
 |
 |
| Parameter | Plot |
|---|---|
| CZT HV Monitor | 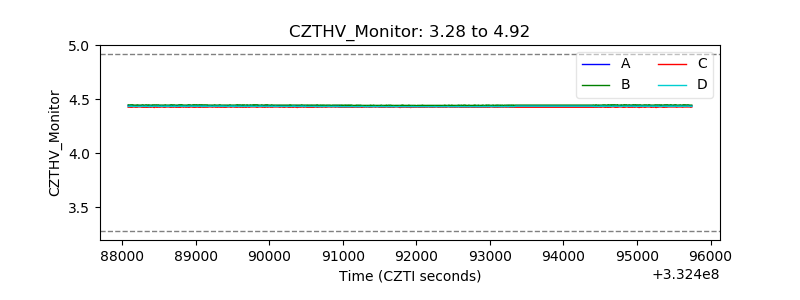 |
| D_VDD | 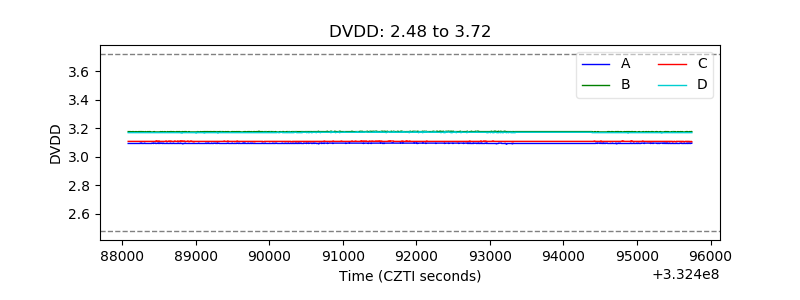 |
| Temperature 1 | 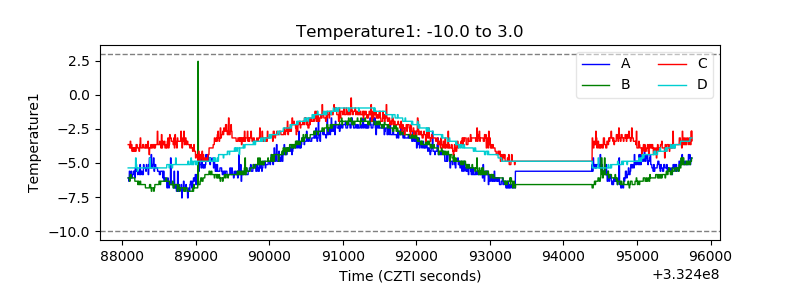 |
| Veto HV Monitor | 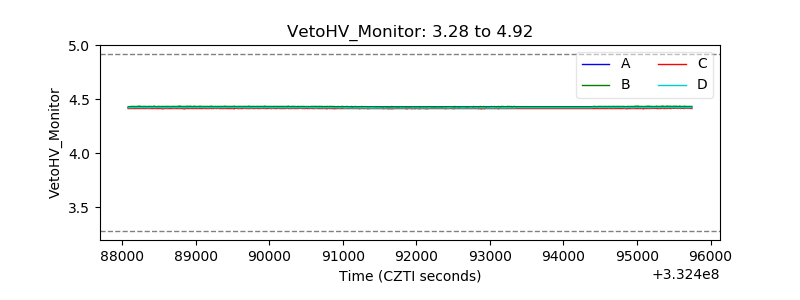 |
| Veto LLD | 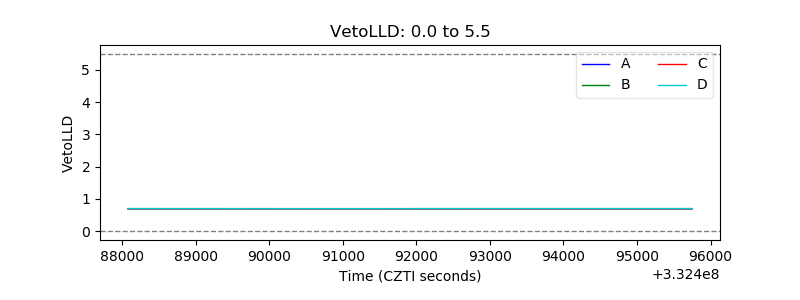 |
| Alpha Counter | 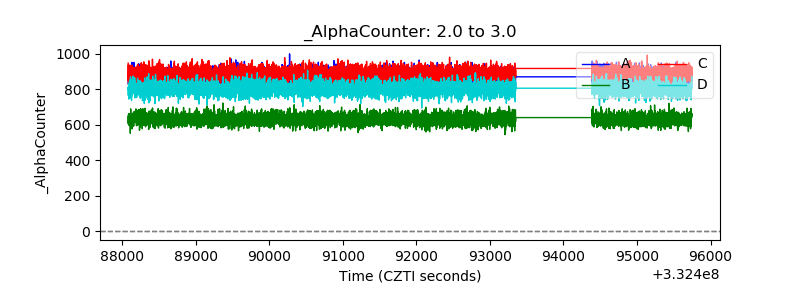 |
| _CPM_Rate | 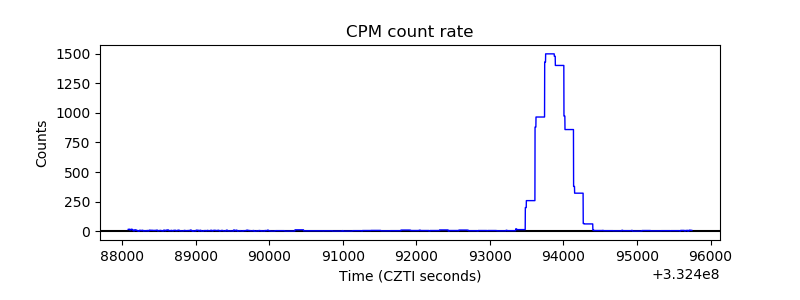 |
| CZT Counter |  |
| +2.5 Volts monitor |  |
| +5 Volts monitor |  |
| _ROLL_ROT | 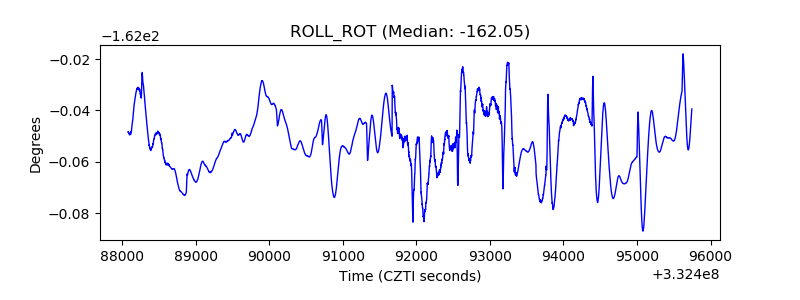 |
| _Roll_DEC | 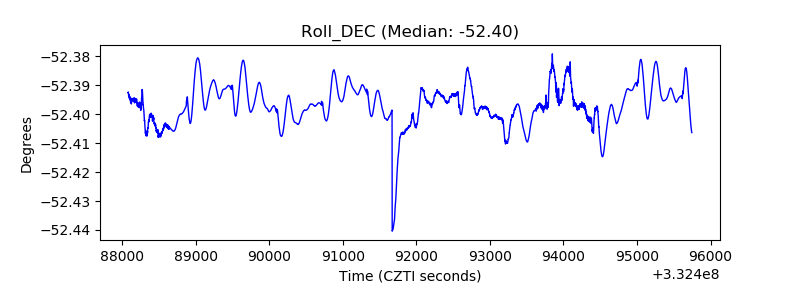 |
| _Roll_RA | 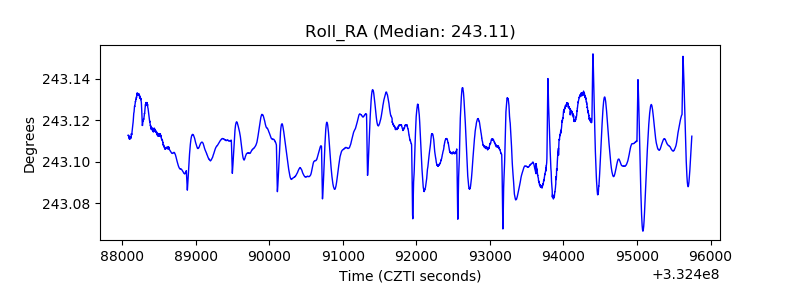 |
| Veto Counter | 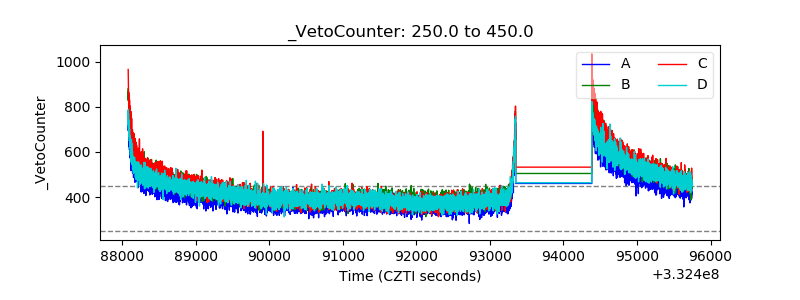 |