| Param | Original file | Final file |
|---|---|---|
| Filename | modeM0/AS1T03_214T01_9000003758_25936cztM0_level2.evt | modeM0/AS1T03_214T01_9000003758_25936cztM0_level2_quad_clean.evt |
| Size (bytes) | 802,598,400 | 81,984,960 |
| Size | 765.4 MB | 78.2 MB |
| Events in quadrant A | 12,729,791 | 322,368 |
| Events in quadrant B | 3,384,181 | 588,026 |
| Events in quadrant C | 3,506,984 | 565,739 |
| Events in quadrant D | 4,245,679 | 551,044 |
| Mode M0 | |||
|---|---|---|---|
| Quadrant | BADHDUFLAG | Total packets | Discarded packets |
| A | 0 | 42380 | 0 |
| B | 0 | 14133 | 0 |
| C | 0 | 14722 | 0 |
| D | 0 | 16889 | 0 |
| Mode M9 | |||
|---|---|---|---|
| Quadrant | BADHDUFLAG | Total packets | Discarded packets |
| A | 0 | 17 | 0 |
| B | 0 | 18 | 0 |
| C | 0 | 18 | 0 |
| D | 0 | 18 | 0 |
| Quadrant | Total seconds | Saturated seconds | Saturation percentage |
|---|---|---|---|
| A | 6511 | 4027 | 61.849178% |
| B | 6511 | 93 | 1.428352% |
| C | 6511 | 170 | 2.610966% |
| D | 6511 | 240 | 3.686070% |
Noise dominated data is calculated using 1-second bins in cleaned event files. If a bin has >2000 counts, and if more than 50% of those come from <1% of pixels, then it is considered to be noise-dominated and hence unusable.
| Quadrant | # 1 sec bins | Bins with >0 counts | Bins with >2000 counts | High rate bins dominated by noise | Noise dominated (total time) | Noise dominated (detector-on time) | Marked lightcurve |
|---|---|---|---|---|---|---|---|
| A | 7625 | 6510 | 3532 | 3532 | 46.32% | 54.25% | 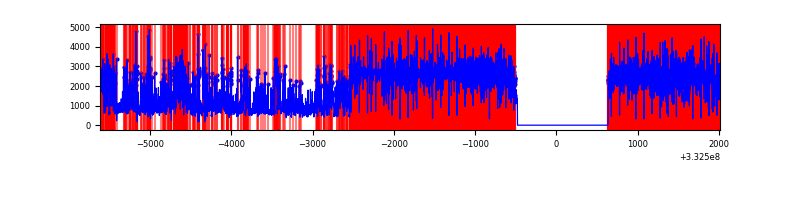 |
| B | 7626 | 6511 | 1 | 1 | 0.01% | 0.02% | 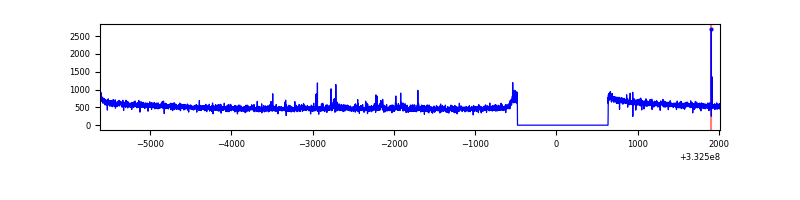 |
| C | 7626 | 6512 | 10 | 10 | 0.13% | 0.15% | 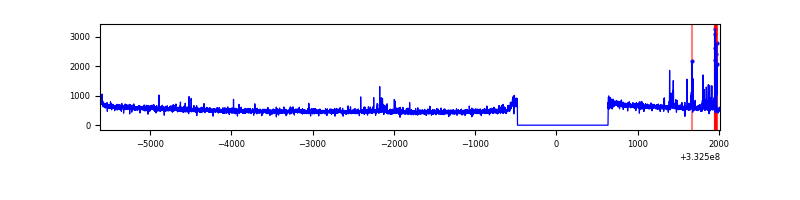 |
| D | 7626 | 6511 | 135 | 135 | 1.77% | 2.07% | 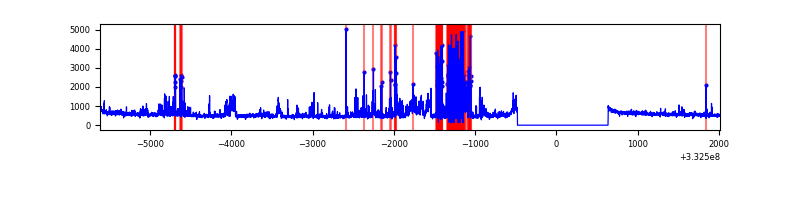 |
Top three noisy pixels from each quadrant. If the there are fewer than three noisy pixels in the level2.evt file, extra rows are filled as -1
| Pixel properties | Quadrant properties | ||||||
|---|---|---|---|---|---|---|---|
| Quadrant | DetID | PixID | Counts | Sigma | Mean | Median | Sigma |
| A | 0 | 13 | 10574155 | 96379.84 | 552 | 543 | 109.7 |
| A | 12 | 16 | 23072 | 205.35 | 552 | 543 | 109.7 |
| A | 12 | 194 | 7490 | 63.32 | 552 | 543 | 109.7 |
| B | 0 | 229 | 24265 | 147.43 | 852 | 830 | 159.0 |
| B | 12 | 111 | 19256 | 115.92 | 852 | 830 | 159.0 |
| B | 11 | 111 | 17125 | 102.51 | 852 | 830 | 159.0 |
| C | 14 | 238 | 134243 | 700.68 | 828 | 834 | 190.4 |
| C | 2 | 16 | 101473 | 528.57 | 828 | 834 | 190.4 |
| C | 3 | 233 | 47219 | 243.62 | 828 | 834 | 190.4 |
| D | 1 | 52 | 933428 | 4802.97 | 833 | 814 | 194.2 |
| D | 7 | 80 | 136558 | 699.08 | 833 | 814 | 194.2 |
| D | 12 | 233 | 24567 | 122.33 | 833 | 814 | 194.2 |
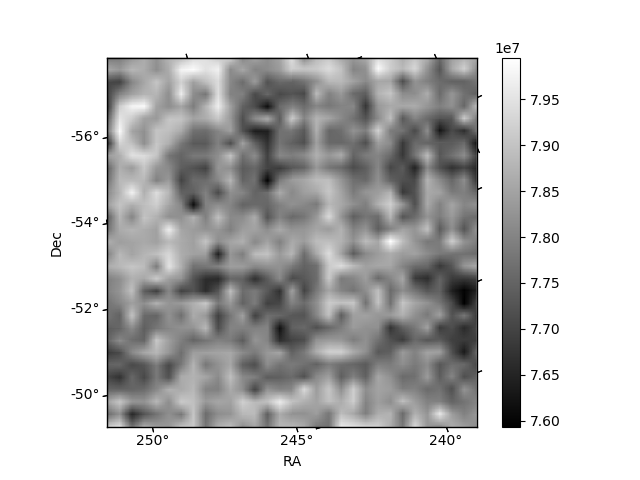
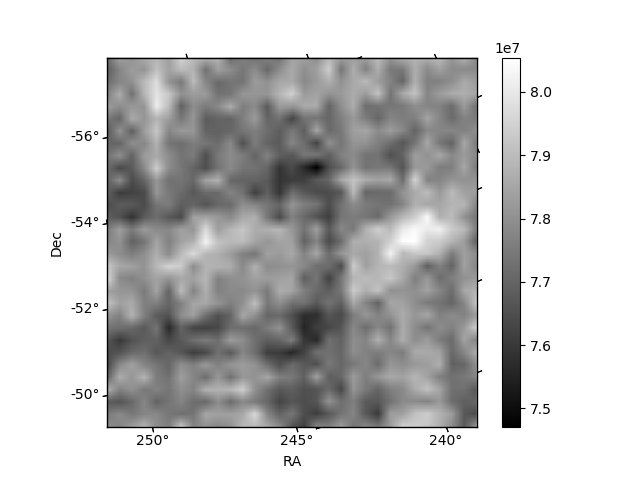
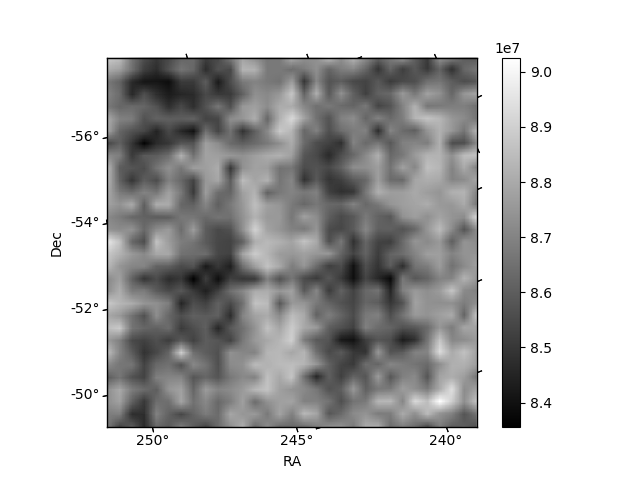
Histogram calculated using DETX and DETY for each event in the final _common_clean file
| Quadrant A | 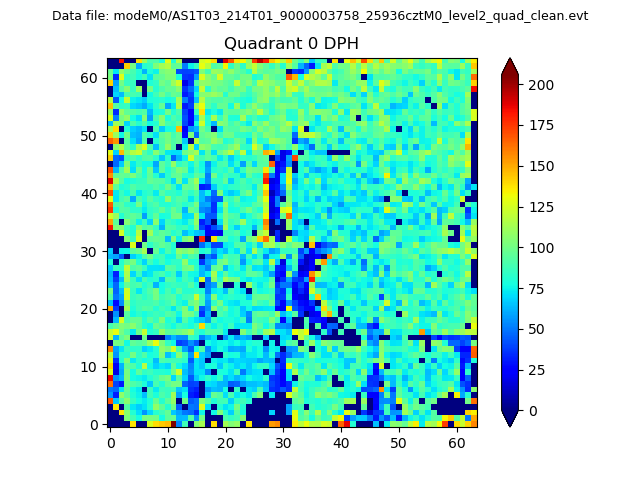 |
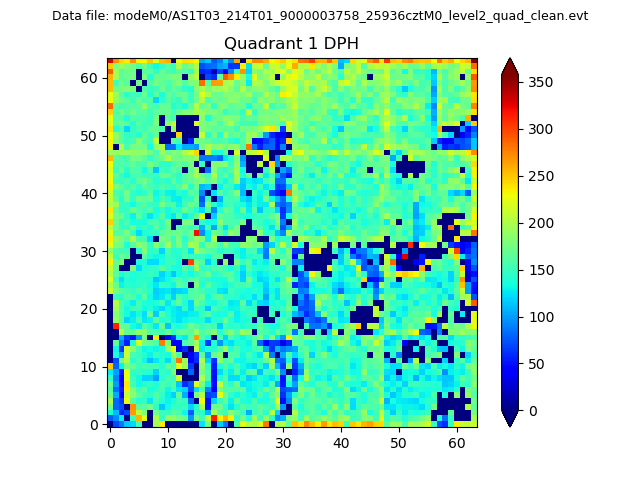 |
Quadrant B |
|---|---|---|---|
| Quadrant D |  |
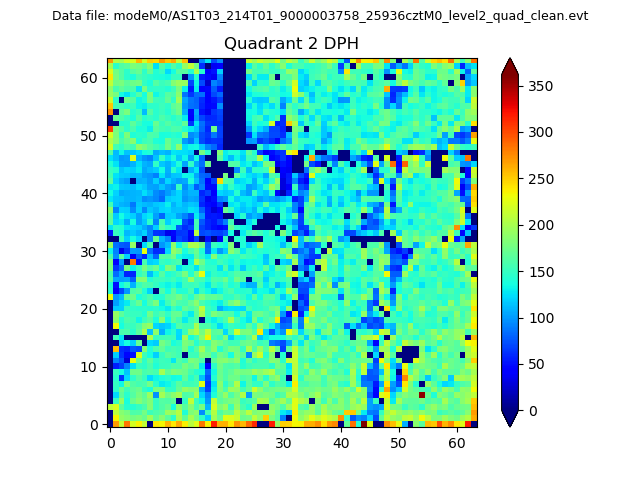 |
Quadrant C |
| Plot type | Count rate plots | Images |
|---|---|---|
| Comparison with Poisson distribution Blue bars denote a histogram of data divided into 1 sec bins. Red curve is a Poisson curve with rate = median count rate of data. |
 |
 |
| Quadrant-wise count rates Data is divided into 100 sec bins |
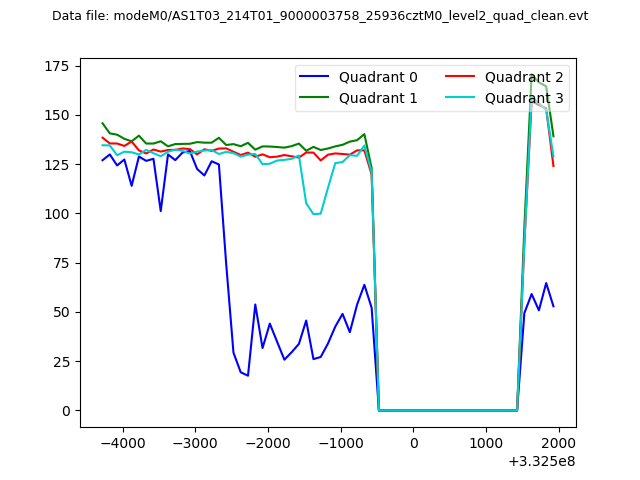 |
|
| Module-wise count rates for Quadrant A Data is divided into 100 sec bins |
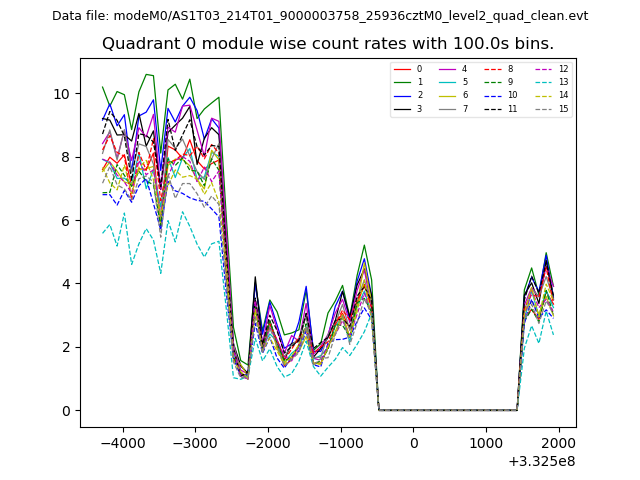 |
 |
| Module-wise count rates for Quadrant B Data is divided into 100 sec bins |
 |
 |
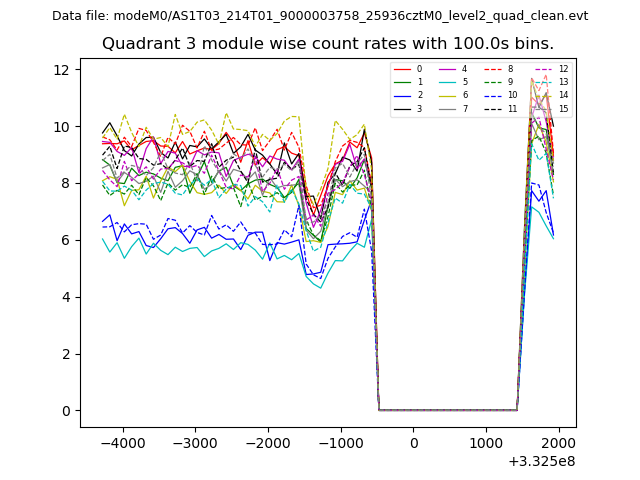
| Module-wise count rates for Quadrant C Data is divided into 100 sec bins |
 |
 |
| Module-wise count rates for Quadrant D Data is divided into 100 sec bins |
 |
 |
| Parameter | Plot |
|---|---|
| CZT HV Monitor |  |
| D_VDD | 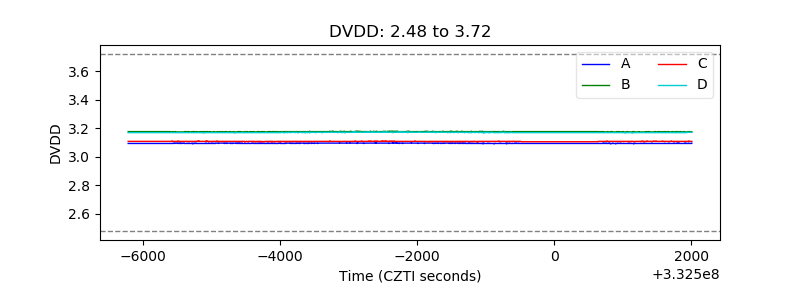 |
| Temperature 1 | 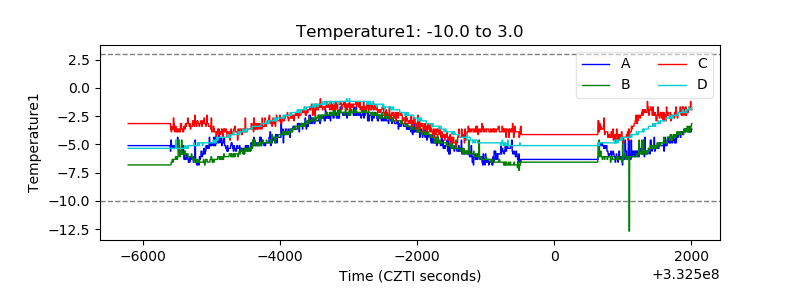 |
| Veto HV Monitor | 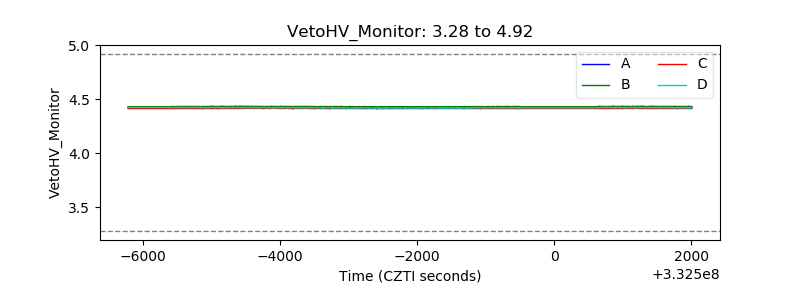 |
| Veto LLD | 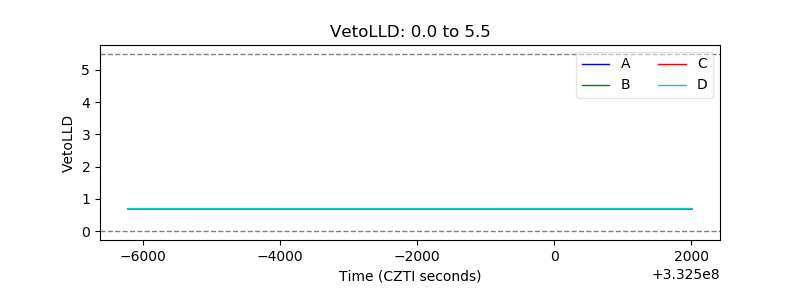 |
| Alpha Counter | 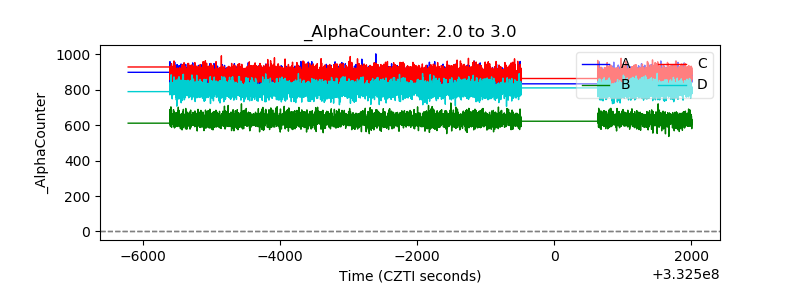 |
| _CPM_Rate | 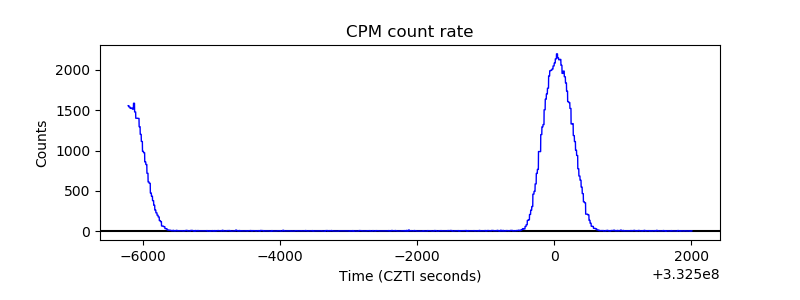 |
| CZT Counter | 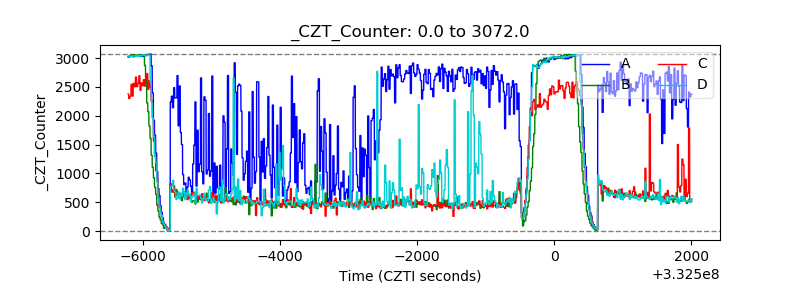 |
| +2.5 Volts monitor |  |
| +5 Volts monitor |  |
| _ROLL_ROT | 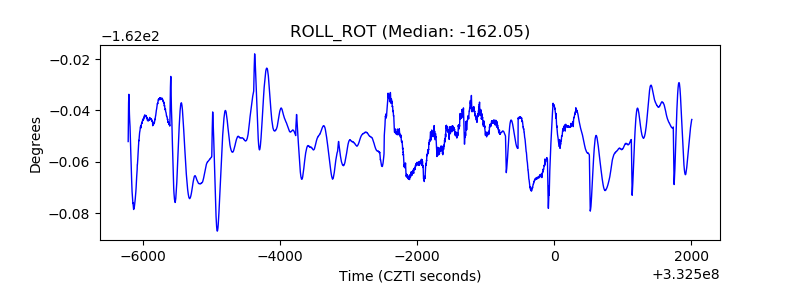 |
| _Roll_DEC | 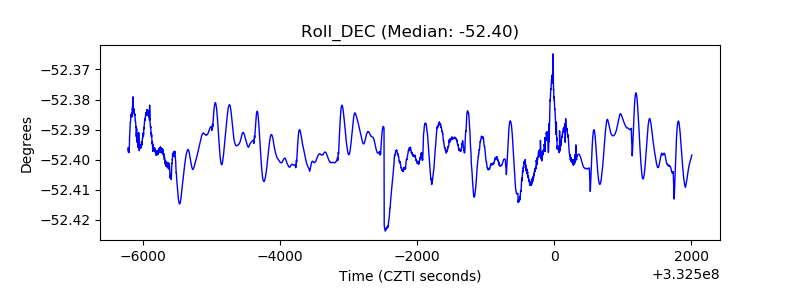 |
| _Roll_RA | 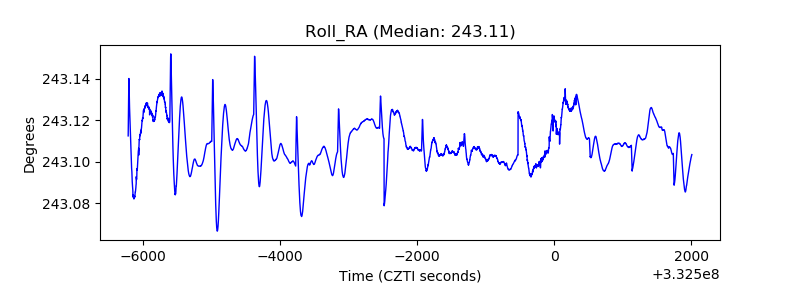 |
| Veto Counter | 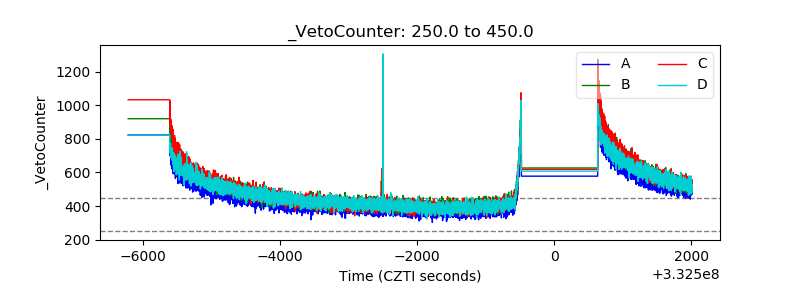 |