| Param | Original file | Final file |
|---|---|---|
| Filename | modeM0/AS1T03_214T01_9000003758_25937cztM0_level2.evt | modeM0/AS1T03_214T01_9000003758_25937cztM0_level2_quad_clean.evt |
| Size (bytes) | 466,283,520 | 45,230,400 |
| Size | 444.7 MB | 43.1 MB |
| Events in quadrant A | 8,189,314 | 108,081 |
| Events in quadrant B | 1,772,729 | 354,035 |
| Events in quadrant C | 1,882,943 | 337,487 |
| Events in quadrant D | 2,053,265 | 335,890 |
| Mode M0 | |||
|---|---|---|---|
| Quadrant | BADHDUFLAG | Total packets | Discarded packets |
| A | 0 | 26576 | 0 |
| B | 0 | 7293 | 0 |
| C | 0 | 7790 | 0 |
| D | 0 | 8217 | 0 |
| Mode M9 | |||
|---|---|---|---|
| Quadrant | BADHDUFLAG | Total packets | Discarded packets |
| A | 0 | 2 | 0 |
| B | 0 | 3 | 0 |
| C | 0 | 3 | 0 |
| D | 0 | 3 | 0 |
| Quadrant | Total seconds | Saturated seconds | Saturation percentage |
|---|---|---|---|
| A | 3276 | 3111 | 94.963370% |
| B | 3276 | 34 | 1.037851% |
| C | 3276 | 86 | 2.625153% |
| D | 3276 | 42 | 1.282051% |
Noise dominated data is calculated using 1-second bins in cleaned event files. If a bin has >2000 counts, and if more than 50% of those come from <1% of pixels, then it is considered to be noise-dominated and hence unusable.
| Quadrant | # 1 sec bins | Bins with >0 counts | Bins with >2000 counts | High rate bins dominated by noise | Noise dominated (total time) | Noise dominated (detector-on time) | Marked lightcurve |
|---|---|---|---|---|---|---|---|
| A | 3276 | 3276 | 2830 | 2830 | 86.39% | 86.39% | 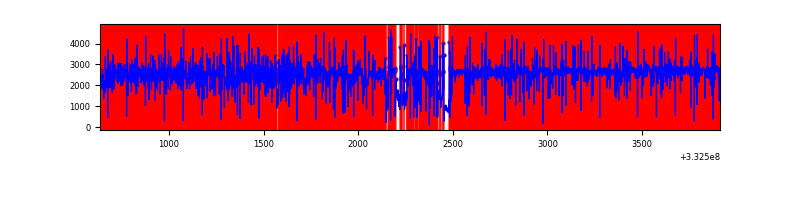 |
| B | 3276 | 3276 | 1 | 1 | 0.03% | 0.03% | 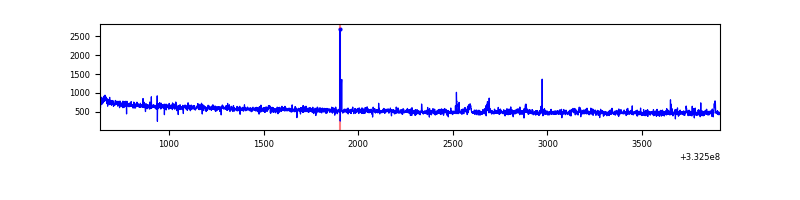 |
| C | 3276 | 3276 | 11 | 11 | 0.34% | 0.34% | 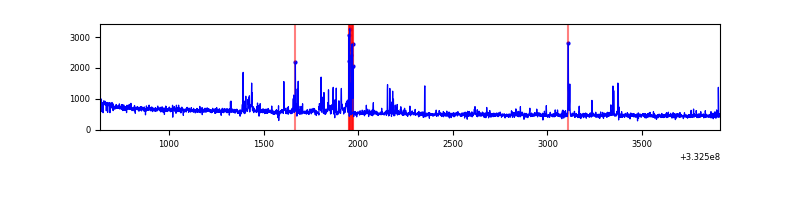 |
| D | 3276 | 3276 | 29 | 29 | 0.89% | 0.89% | 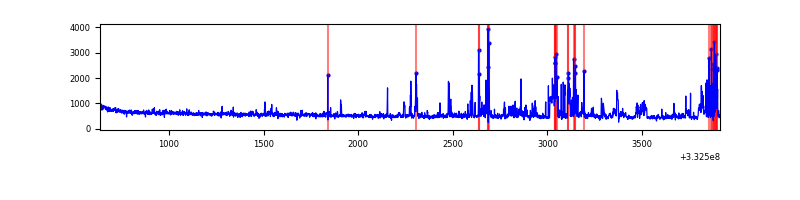 |
Top three noisy pixels from each quadrant. If the there are fewer than three noisy pixels in the level2.evt file, extra rows are filled as -1
| Pixel properties | Quadrant properties | ||||||
|---|---|---|---|---|---|---|---|
| Quadrant | DetID | PixID | Counts | Sigma | Mean | Median | Sigma |
| A | 0 | 13 | 7490661 | 200914.94 | 180 | 177 | 37.3 |
| A | 13 | 254 | 1975 | 48.23 | 180 | 177 | 37.3 |
| A | 0 | 226 | 1444 | 33.98 | 180 | 177 | 37.3 |
| B | 0 | 190 | 17386 | 205.65 | 443 | 435 | 82.4 |
| B | 0 | 229 | 12651 | 148.2 | 443 | 435 | 82.4 |
| B | 12 | 111 | 9485 | 109.79 | 443 | 435 | 82.4 |
| C | 2 | 16 | 126587 | 1260.34 | 430 | 432 | 100.1 |
| C | 14 | 238 | 71376 | 708.76 | 430 | 432 | 100.1 |
| C | 3 | 233 | 10971 | 105.29 | 430 | 432 | 100.1 |
| D | 1 | 52 | 360743 | 3480.32 | 440 | 431 | 103.5 |
| D | 12 | 233 | 26386 | 250.7 | 440 | 431 | 103.5 |
| D | 2 | 234 | 11913 | 110.91 | 440 | 431 | 103.5 |
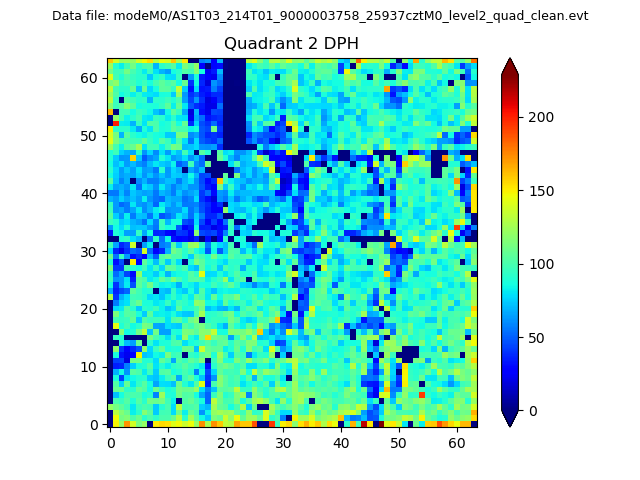
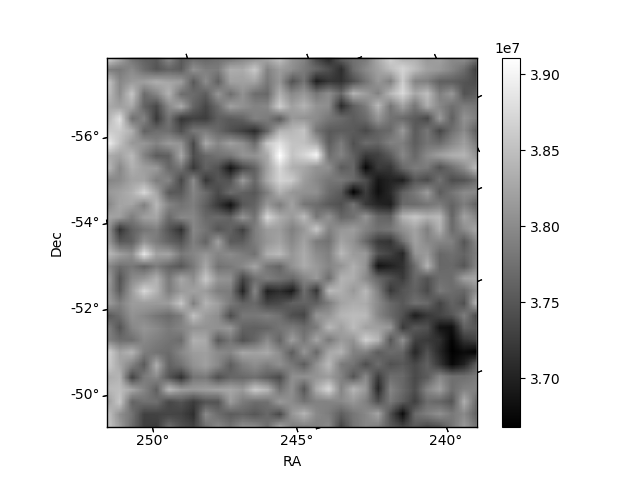
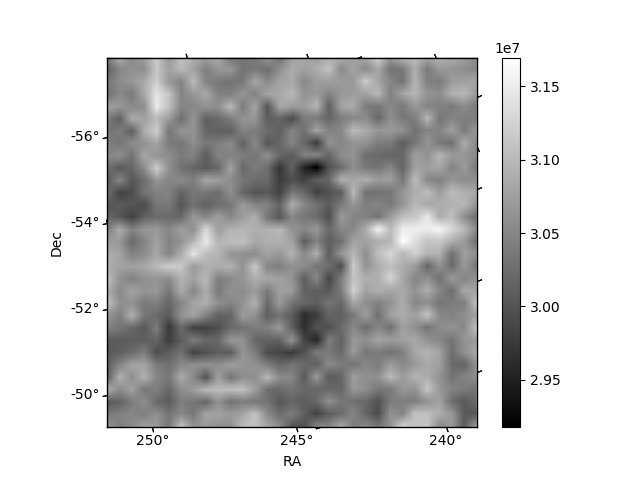
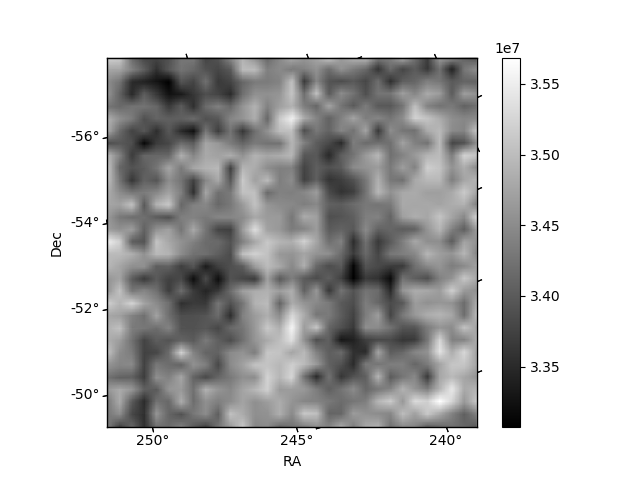
Histogram calculated using DETX and DETY for each event in the final _common_clean file
| Quadrant A | 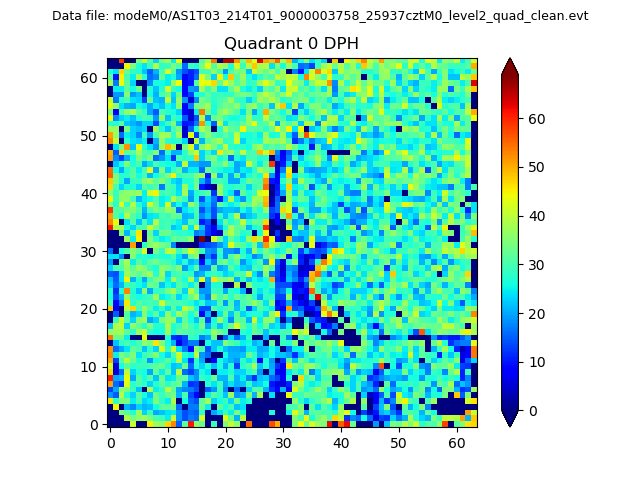 |
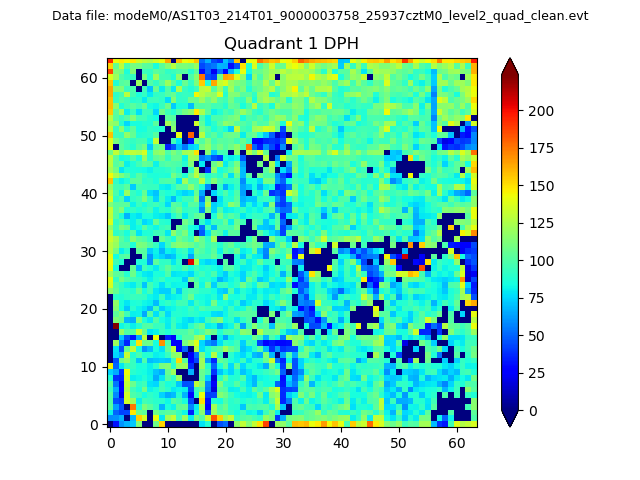 |
Quadrant B |
|---|---|---|---|
| Quadrant D | 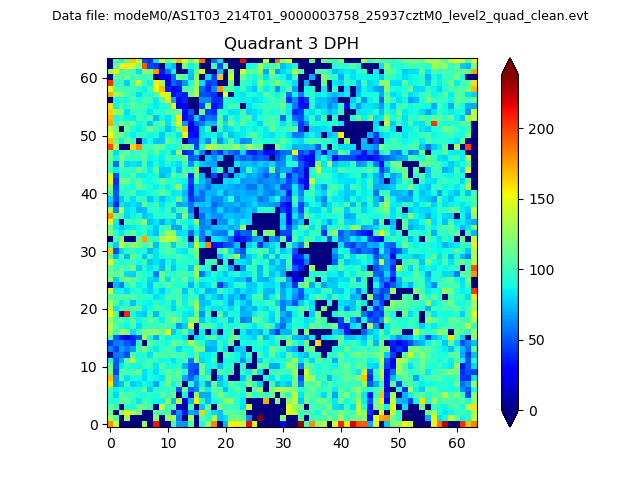 |
 |
Quadrant C |
| Plot type | Count rate plots | Images |
|---|---|---|
| Comparison with Poisson distribution Blue bars denote a histogram of data divided into 1 sec bins. Red curve is a Poisson curve with rate = median count rate of data. |
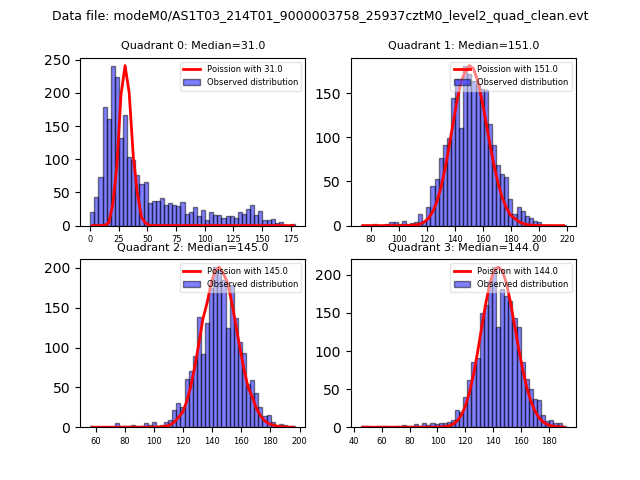 |
 |
| Quadrant-wise count rates Data is divided into 100 sec bins |
 |
|
| Module-wise count rates for Quadrant A Data is divided into 100 sec bins |
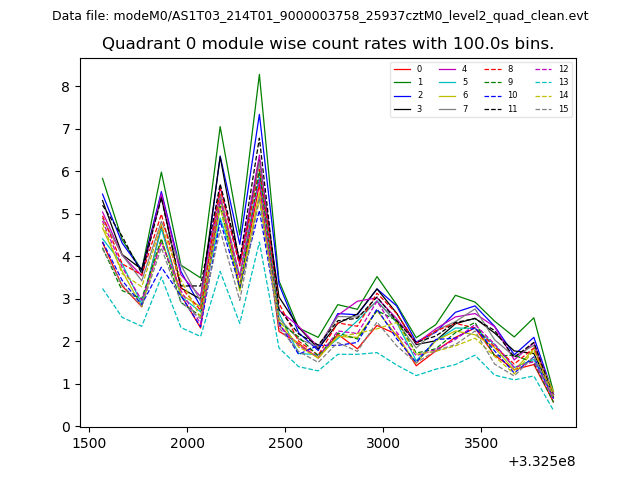 |
 |
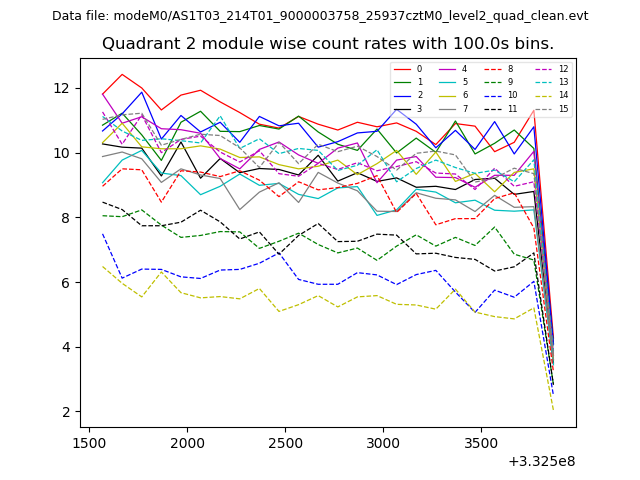
| Module-wise count rates for Quadrant B Data is divided into 100 sec bins |
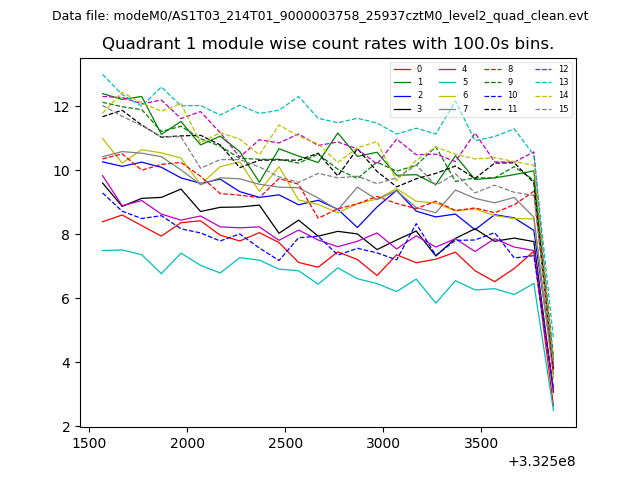 |
 |
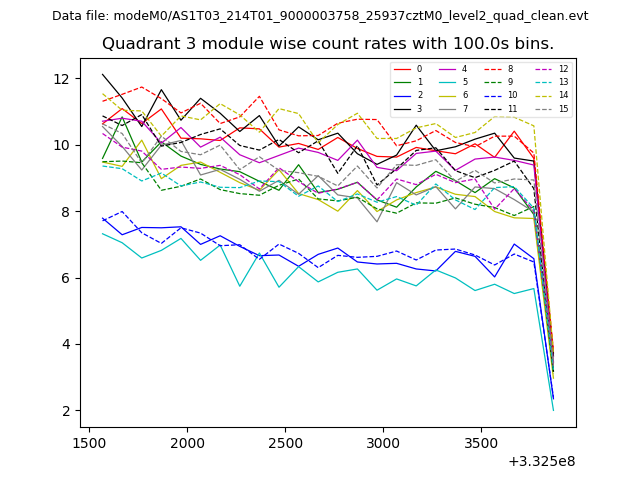
| Module-wise count rates for Quadrant C Data is divided into 100 sec bins |
 |
 |
| Module-wise count rates for Quadrant D Data is divided into 100 sec bins |
 |
 |
| Parameter | Plot |
|---|---|
| CZT HV Monitor | 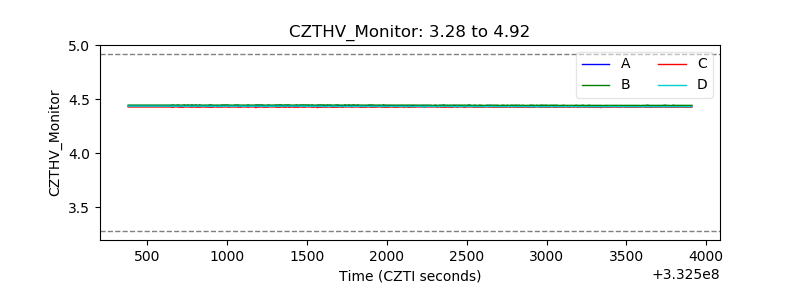 |
| D_VDD | 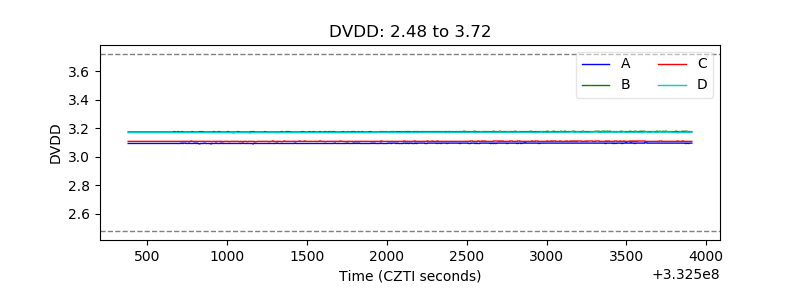 |
| Temperature 1 | 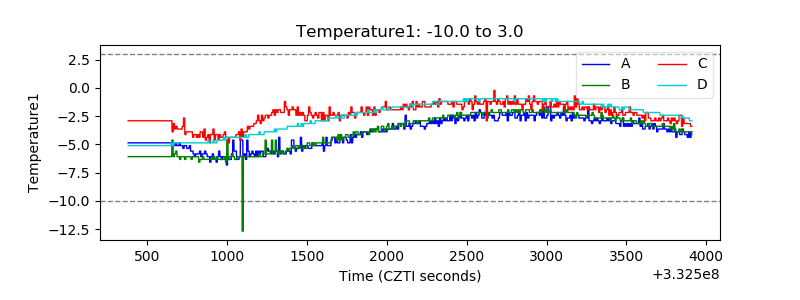 |
| Veto HV Monitor | 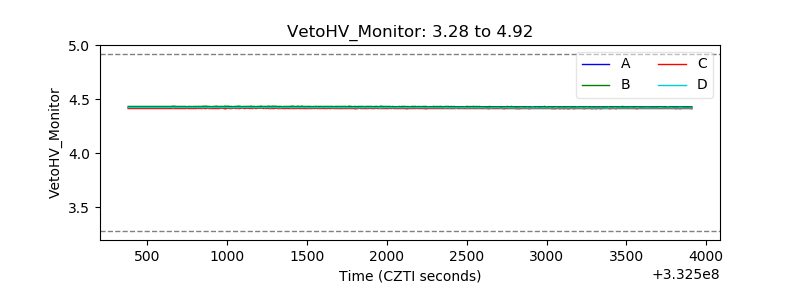 |
| Veto LLD | 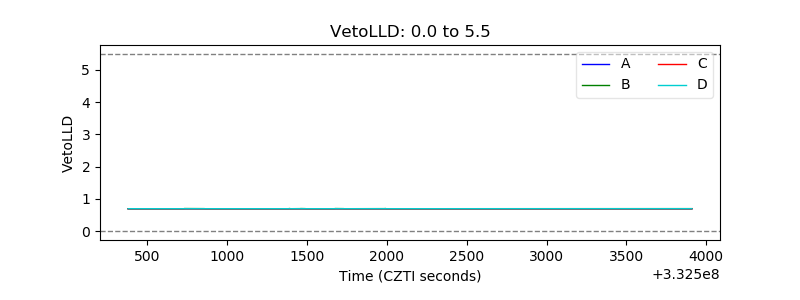 |
| Alpha Counter | 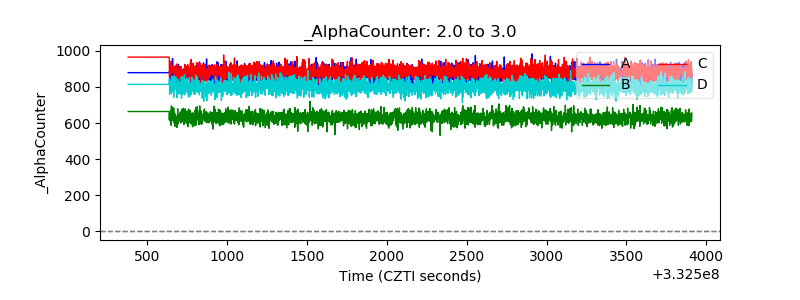 |
| _CPM_Rate | 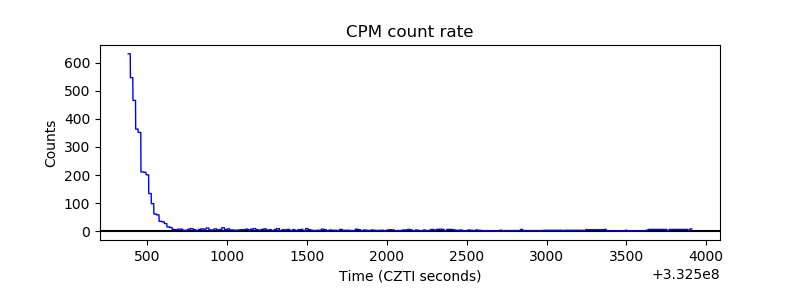 |
| CZT Counter |  |
| +2.5 Volts monitor |  |
| +5 Volts monitor |  |
| _ROLL_ROT | 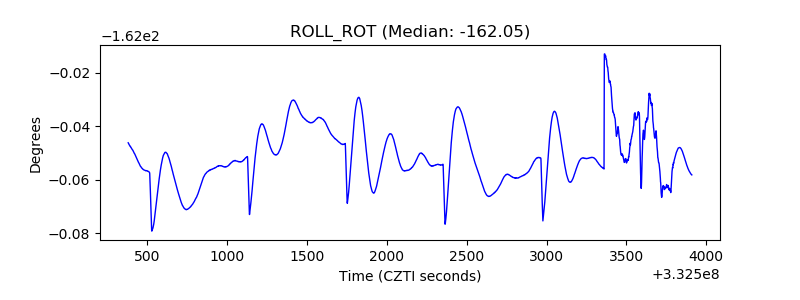 |
| _Roll_DEC | 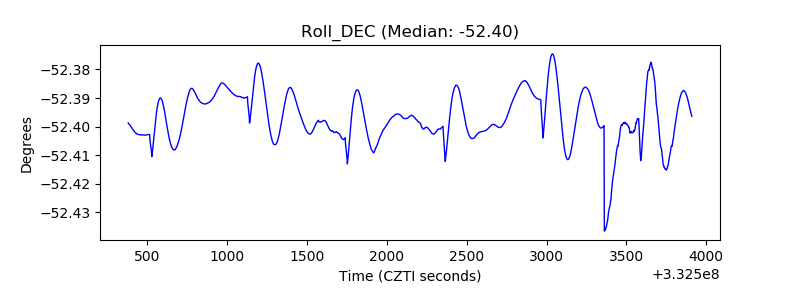 |
| _Roll_RA |  |
| Veto Counter | 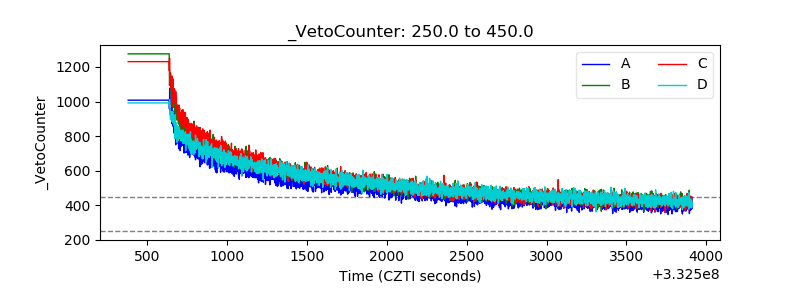 |