| Param | Original file | Final file |
|---|---|---|
| Filename | modeM0/AS1A07_068T01_9000003760cztM0_level2.fits | modeM0/AS1A07_068T01_9000003760cztM0_level2_quad_clean.evt |
| Size (bytes) | 4,083,756,480 | 3,445,346,880 |
| Size | 3.8 GB | 3.2 GB |
| Events in quadrant A | 25,170,410 | 20,156,259 |
| Events in quadrant B | 24,553,704 | 20,239,095 |
| Events in quadrant C | 24,761,770 | 19,153,450 |
| Events in quadrant D | 21,337,544 | 16,951,771 |
| Mode M0 | |||
|---|---|---|---|
| Quadrant | BADHDUFLAG | Total packets | Discarded packets |
| A | 0 | 977850 | 0 |
| B | 0 | 869154 | 0 |
| C | 0 | 869600 | 0 |
| D | 0 | 1199168 | 0 |
| Mode SS | |||
|---|---|---|---|
| Quadrant | BADHDUFLAG | Total packets | Discarded packets |
| A | 0 | 8464 | 0 |
| B | 0 | 8470 | 0 |
| C | 0 | 8470 | 0 |
| D | 0 | 8464 | 0 |
| Mode M9 | |||
|---|---|---|---|
| Quadrant | BADHDUFLAG | Total packets | Discarded packets |
| A | 0 | 689 | 0 |
| B | 0 | 687 | 0 |
| C | 0 | 688 | 0 |
| D | 0 | 688 | 0 |
| Quadrant | Total seconds | Saturated seconds | Saturation percentage |
|---|---|---|---|
| A | 405902 | 20497 | 5.049741% |
| B | 405885 | 5736 | 1.413208% |
| C | 405897 | 7008 | 1.726546% |
| D | 405799 | 29788 | 7.340580% |
Noise dominated data is calculated using 1-second bins in cleaned event files. If a bin has >2000 counts, and if more than 50% of those come from <1% of pixels, then it is considered to be noise-dominated and hence unusable.
| Quadrant | # 1 sec bins | Bins with >0 counts | Bins with >2000 counts | High rate bins dominated by noise | Noise dominated (total time) | Noise dominated (detector-on time) | Marked lightcurve |
|---|---|---|---|---|---|---|---|
| A | 508422 | 405625 | 0 | 0 | 0.00% | 0.00% | 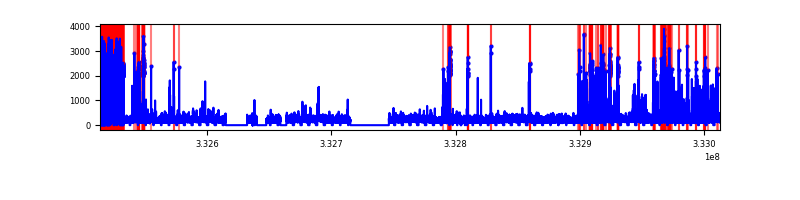 |
| B | 508422 | 406184 | 0 | 0 | 0.00% | 0.00% |  |
| C | 508422 | 406185 | 0 | 0 | 0.00% | 0.00% | 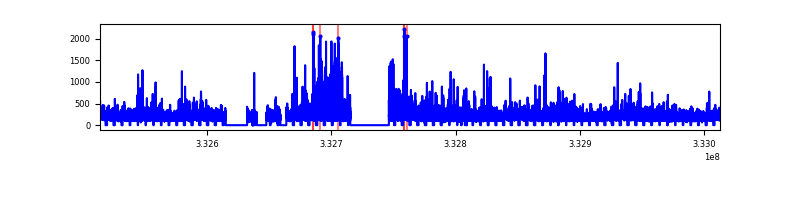 |
| D | 508422 | 405506 | 0 | 0 | 0.00% | 0.00% | 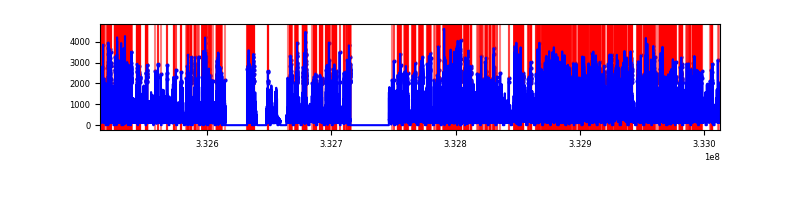 |
Top three noisy pixels from each quadrant. If the there are fewer than three noisy pixels in the level2.evt file, extra rows are filled as -1
| Pixel properties | Quadrant properties | ||||||
|---|---|---|---|---|---|---|---|
| Quadrant | DetID | PixID | Counts | Sigma | Mean | Median | Sigma |
| A | 0 | 29 | 21174 | 9.48 | 6569 | 6190 | 1580.2 |
| A | 7 | 110 | 20090 | 8.8 | 6569 | 6190 | 1580.2 |
| A | 0 | 30 | 18540 | 7.81 | 6569 | 6190 | 1580.2 |
| B | 2 | 9 | 19650 | 10.79 | 6490 | 6209 | 1246.0 |
| B | 2 | 8 | 16191 | 8.01 | 6490 | 6209 | 1246.0 |
| B | 5 | 128 | 15896 | 7.77 | 6490 | 6209 | 1246.0 |
| C | 12 | 241 | 17163 | 6.74 | 6550 | 6144 | 1635.0 |
| C | 9 | 209 | 16560 | 6.37 | 6550 | 6144 | 1635.0 |
| C | 3 | 126 | 16515 | 6.34 | 6550 | 6144 | 1635.0 |
| D | 6 | 231 | 14941 | 5.88 | 6100 | 5585 | 1589.9 |
| D | 6 | 67 | 14920 | 5.87 | 6100 | 5585 | 1589.9 |
| D | 10 | 189 | 14870 | 5.84 | 6100 | 5585 | 1589.9 |
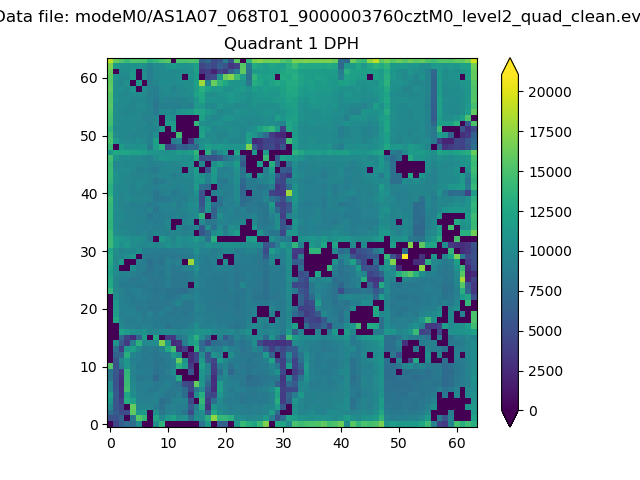
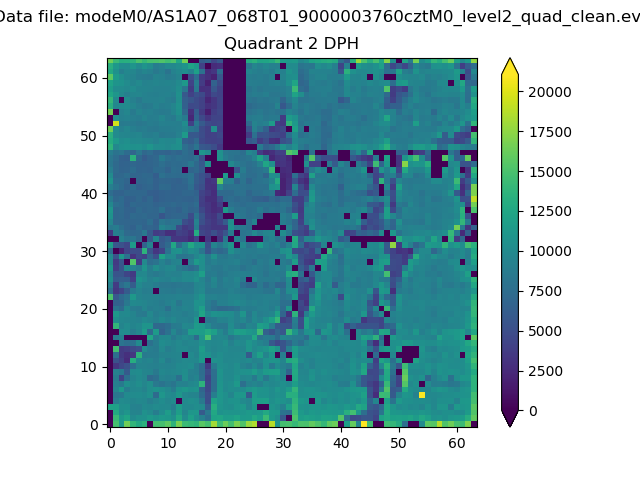
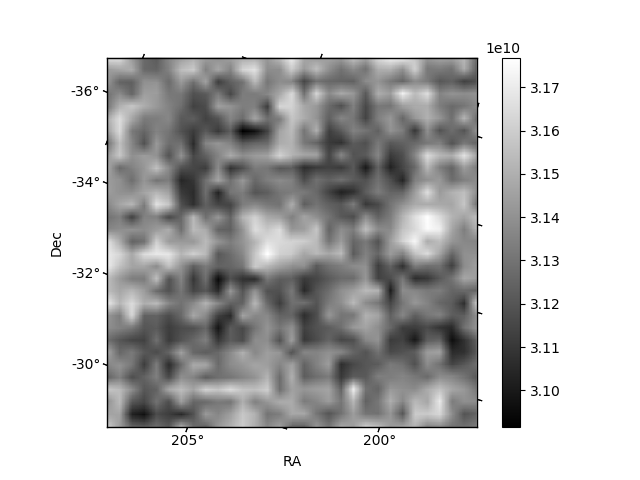
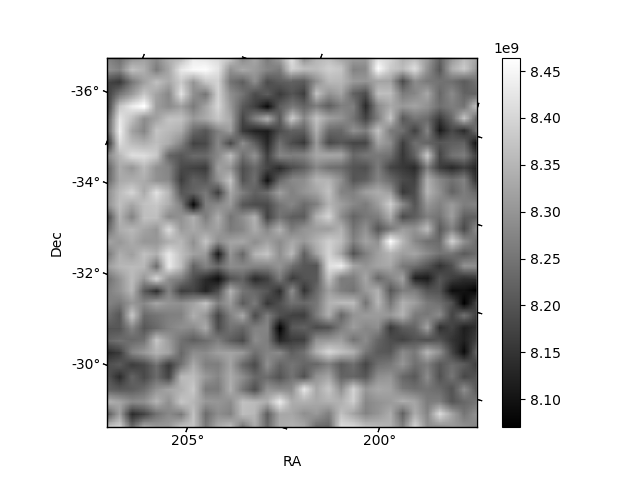
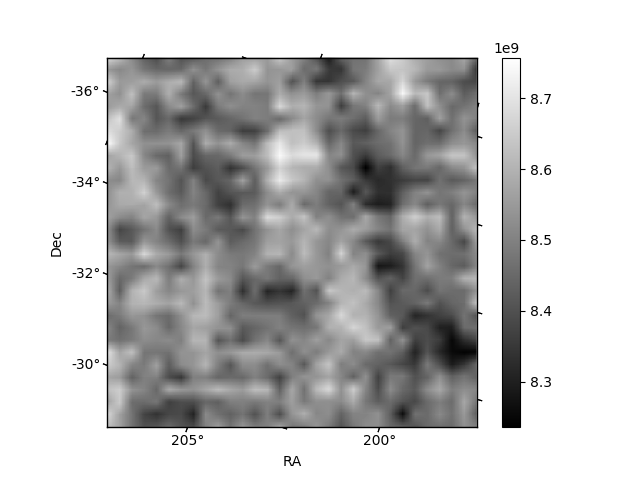
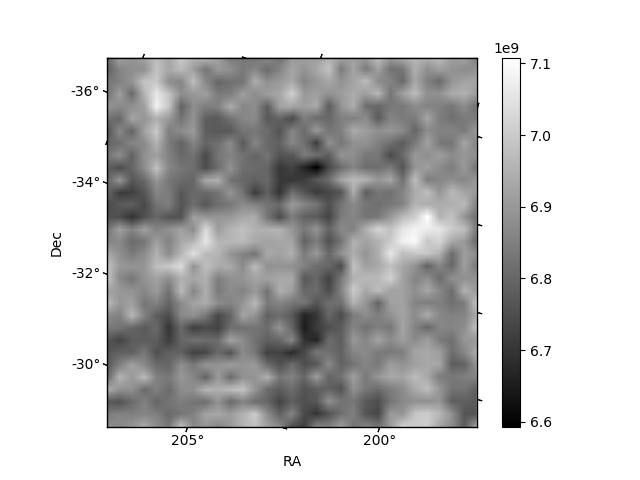
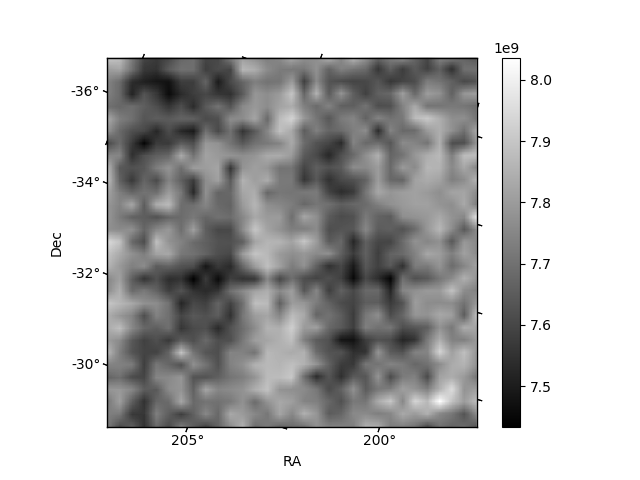
Histogram calculated using DETX and DETY for each event in the final _common_clean file
| Quadrant A | 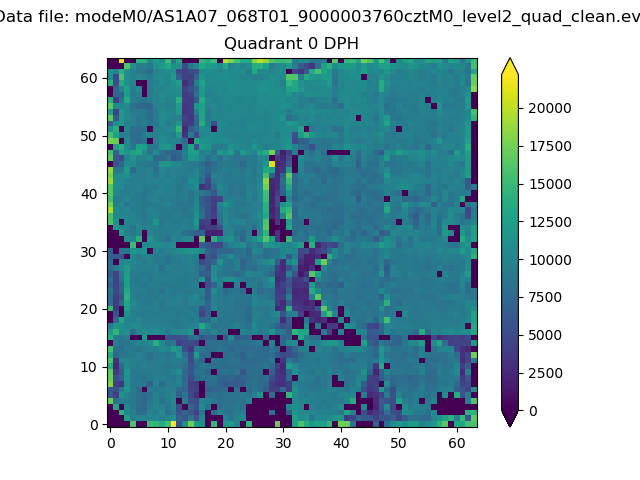 |
 |
Quadrant B |
|---|---|---|---|
| Quadrant D | 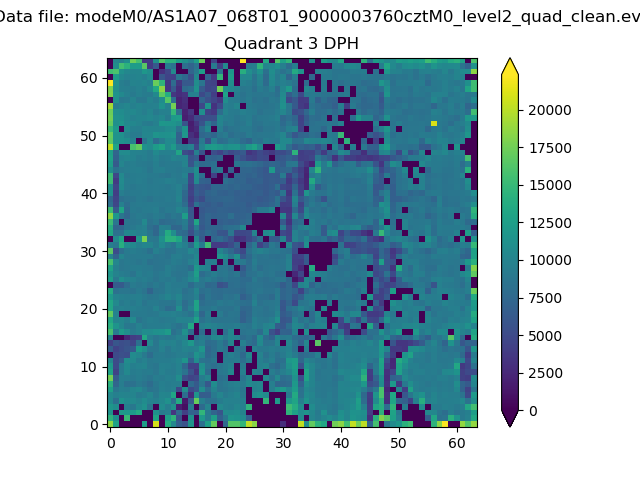 |
 |
Quadrant C |
| Plot type | Count rate plots | Images |
|---|---|---|
| Comparison with Poisson distribution Blue bars denote a histogram of data divided into 1 sec bins. Red curve is a Poisson curve with rate = median count rate of data. |
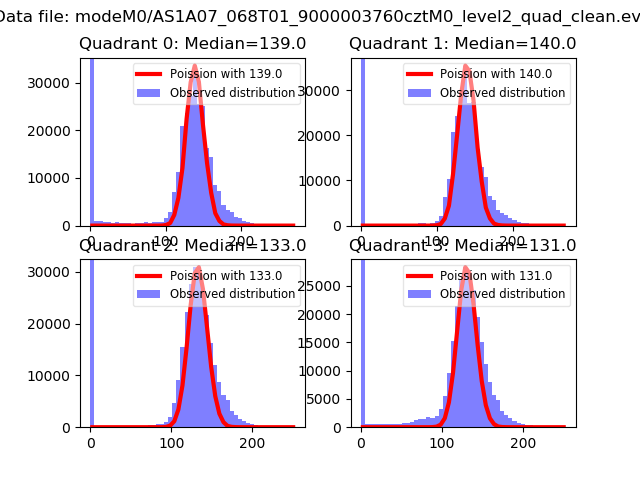 |
 |
| Quadrant-wise count rates Data is divided into 100 sec bins |
 |
|
| Module-wise count rates for Quadrant A Data is divided into 100 sec bins |
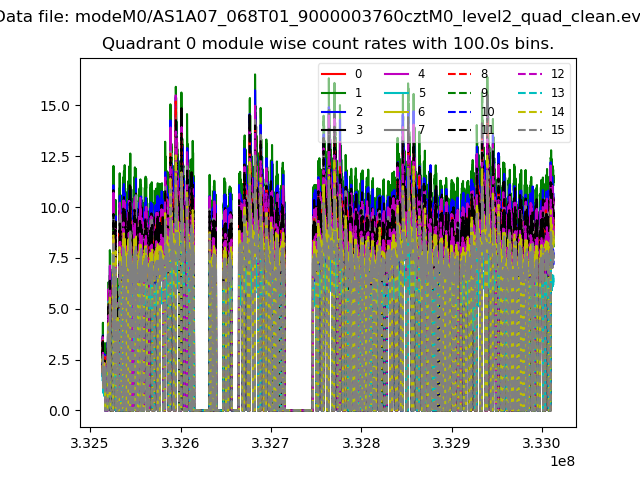 |
 |
| Module-wise count rates for Quadrant B Data is divided into 100 sec bins |
 |
 |
| Module-wise count rates for Quadrant C Data is divided into 100 sec bins |
 |
 |
| Module-wise count rates for Quadrant D Data is divided into 100 sec bins |
 |
 |
| Parameter | Plot |
|---|---|
| CZT HV Monitor | 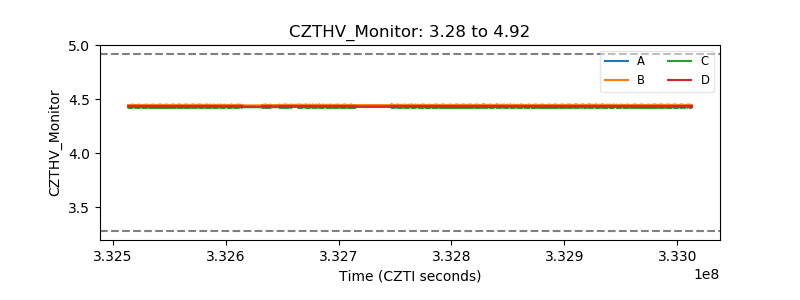 |
| D_VDD | 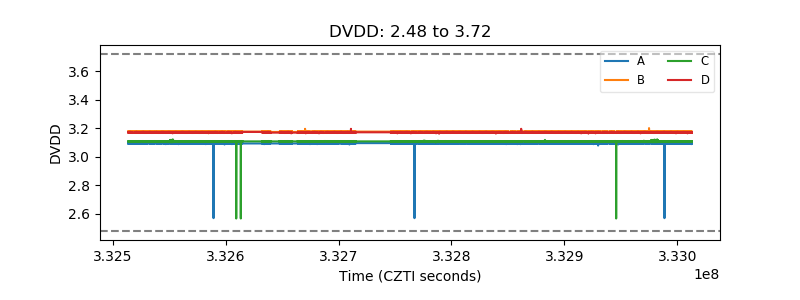 |
| Temperature 1 |  |
| Veto HV Monitor |  |
| Veto LLD | 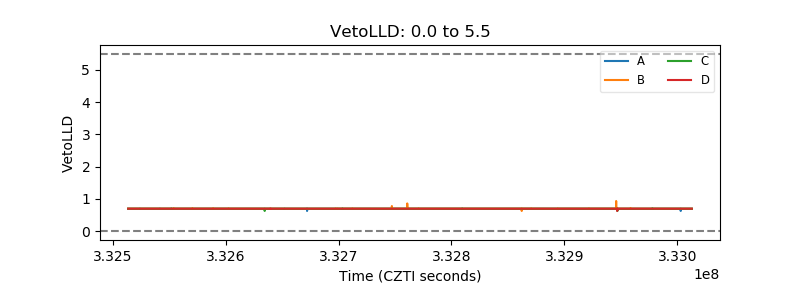 |
| Alpha Counter | 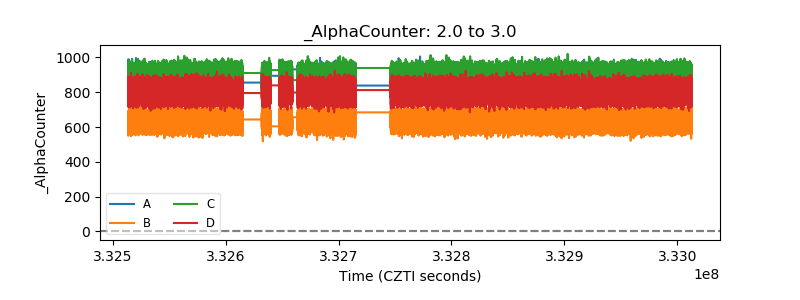 |
| _CPM_Rate | 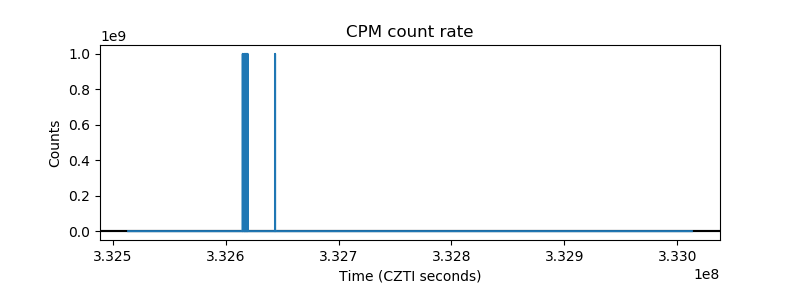 |
| CZT Counter | 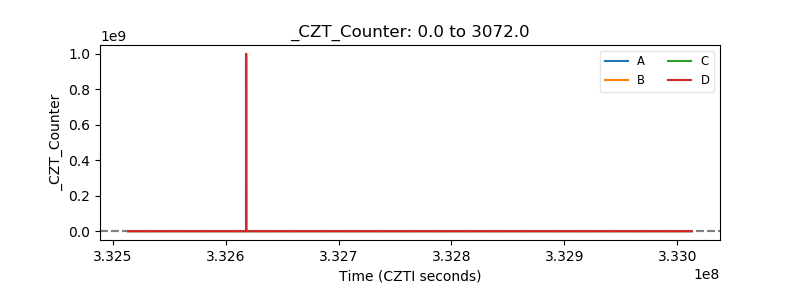 |
| +2.5 Volts monitor |  |
| +5 Volts monitor |  |
| _ROLL_ROT | 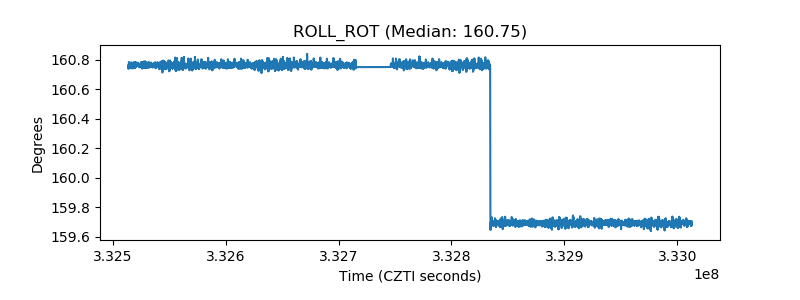 |
| _Roll_DEC | 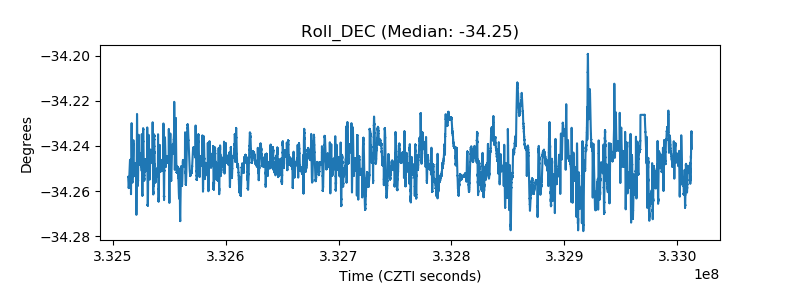 |
| _Roll_RA |  |
| Veto Counter |  |