| Param | Original file | Final file |
|---|---|---|
| Filename | modeM0/AS1A07_068T01_9000003760_25938cztM0_level2.evt | modeM0/AS1A07_068T01_9000003760_25938cztM0_level2_quad_clean.evt |
| Size (bytes) | 149,866,560 | 22,766,400 |
| Size | 142.9 MB | 21.7 MB |
| Events in quadrant A | 2,431,288 | 32,620 |
| Events in quadrant B | 652,643 | 199,288 |
| Events in quadrant C | 677,388 | 185,975 |
| Events in quadrant D | 701,015 | 187,911 |
| Mode M0 | |||
|---|---|---|---|
| Quadrant | BADHDUFLAG | Total packets | Discarded packets |
| A | 0 | 7861 | 0 |
| B | 0 | 2718 | 0 |
| C | 0 | 2842 | 0 |
| D | 0 | 2896 | 0 |
| Mode M9 | |||
|---|---|---|---|
| Quadrant | BADHDUFLAG | Total packets | Discarded packets |
| A | 0 | 7 | 7 |
| B | 0 | 5 | 5 |
| C | 0 | 7 | 5 |
| D | 0 | 6 | 6 |
| Quadrant | Total seconds | Saturated seconds | Saturation percentage |
|---|---|---|---|
| A | 935 | 935 | 100.000000% |
| B | 1081 | 2 | 0.185014% |
| C | 1085 | 12 | 1.105991% |
| D | 1091 | 6 | 0.549954% |
Noise dominated data is calculated using 1-second bins in cleaned event files. If a bin has >2000 counts, and if more than 50% of those come from <1% of pixels, then it is considered to be noise-dominated and hence unusable.
| Quadrant | # 1 sec bins | Bins with >0 counts | Bins with >2000 counts | High rate bins dominated by noise | Noise dominated (total time) | Noise dominated (detector-on time) | Marked lightcurve |
|---|---|---|---|---|---|---|---|
| A | 1170 | 1007 | 857 | 857 | 73.25% | 85.10% | 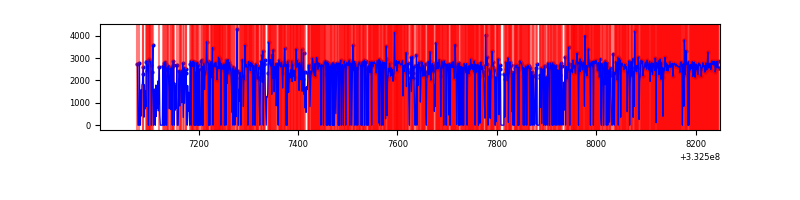 |
| B | 1247 | 1177 | 0 | 0 | 0.00% | 0.00% | 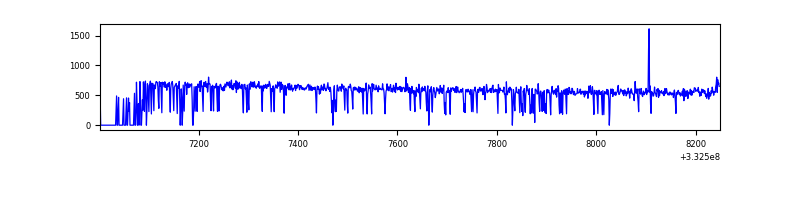 |
| C | 1200 | 1182 | 0 | 0 | 0.00% | 0.00% | 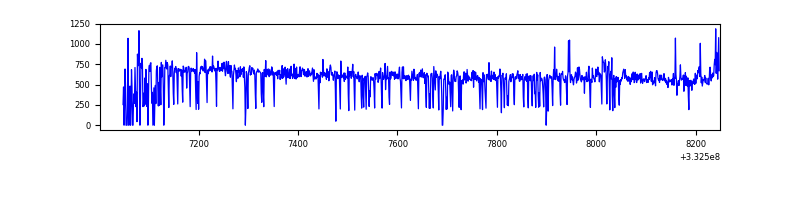 |
| D | 1221 | 1174 | 4 | 4 | 0.33% | 0.34% | 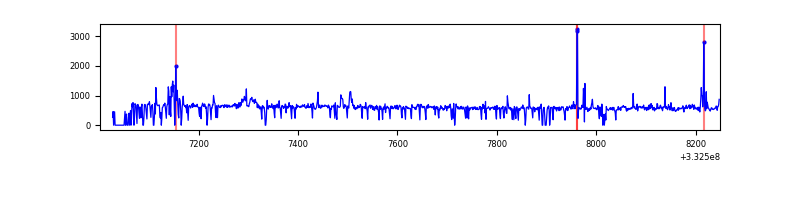 |
Top three noisy pixels from each quadrant. If the there are fewer than three noisy pixels in the level2.evt file, extra rows are filled as -1
| Pixel properties | Quadrant properties | ||||||
|---|---|---|---|---|---|---|---|
| Quadrant | DetID | PixID | Counts | Sigma | Mean | Median | Sigma |
| A | 0 | 13 | 2267603 | 227480.59 | 41 | 40 | 10.0 |
| A | 12 | 16 | 914 | 87.68 | 41 | 40 | 10.0 |
| A | 12 | 194 | 412 | 37.32 | 41 | 40 | 10.0 |
| B | 12 | 111 | 3573 | 103.77 | 166 | 163 | 32.9 |
| B | 11 | 111 | 3282 | 94.91 | 166 | 163 | 32.9 |
| B | 14 | 111 | 3101 | 89.41 | 166 | 163 | 32.9 |
| C | 14 | 238 | 27211 | 694.66 | 161 | 162 | 38.9 |
| C | 2 | 16 | 17065 | 434.1 | 161 | 162 | 38.9 |
| C | 3 | 233 | 3752 | 92.2 | 161 | 162 | 38.9 |
| D | 1 | 52 | 57679 | 1381.46 | 169 | 165 | 41.6 |
| D | 2 | 153 | 5906 | 137.9 | 169 | 165 | 41.6 |
| D | 2 | 234 | 3876 | 89.14 | 169 | 165 | 41.6 |
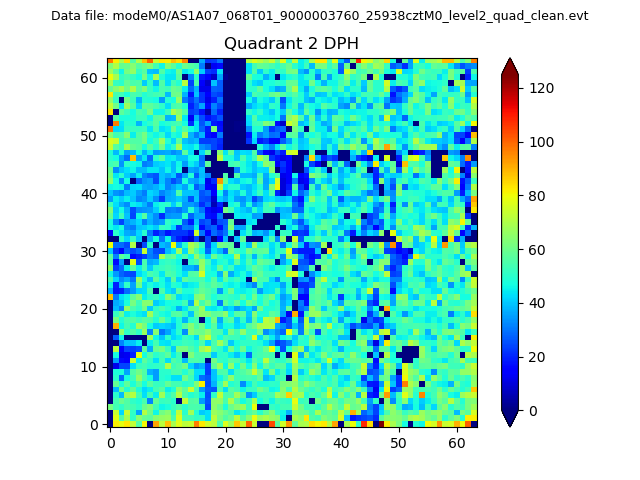
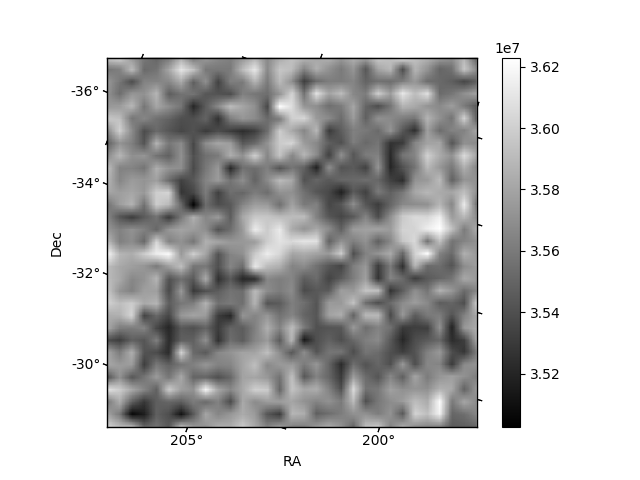
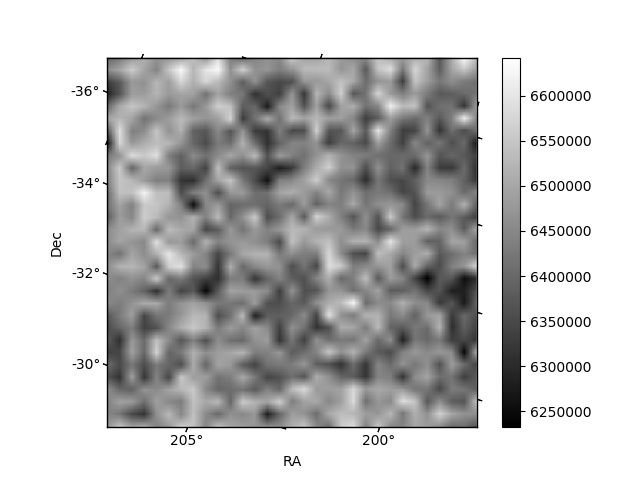
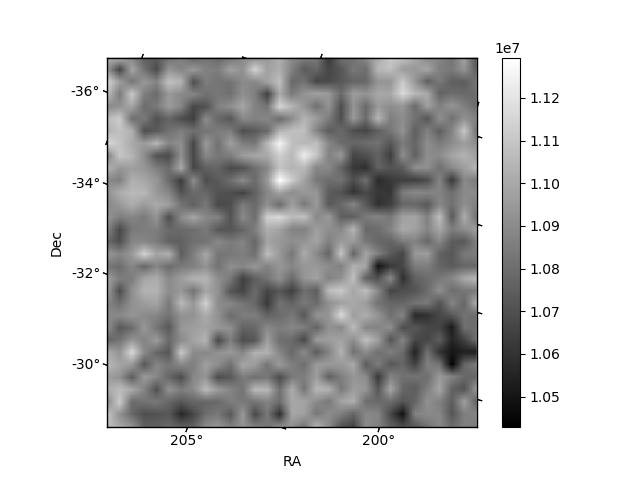
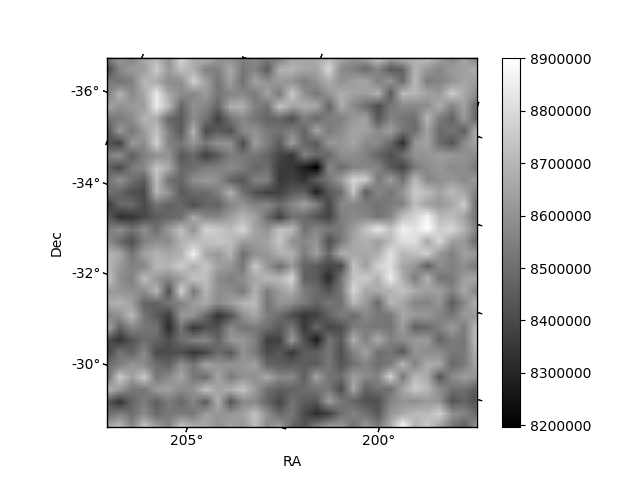
Histogram calculated using DETX and DETY for each event in the final _common_clean file
| Quadrant A | 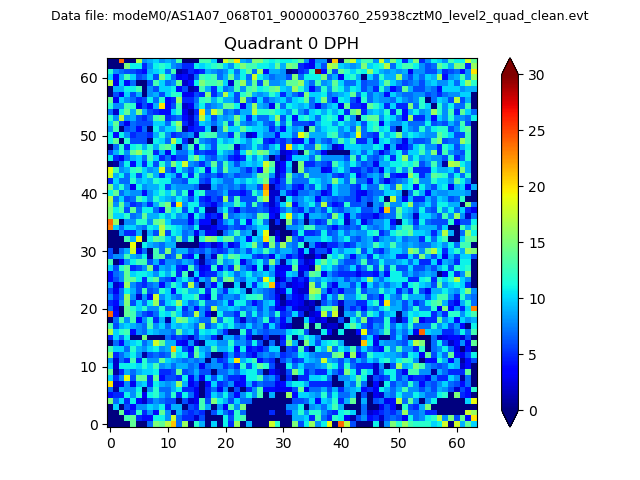 |
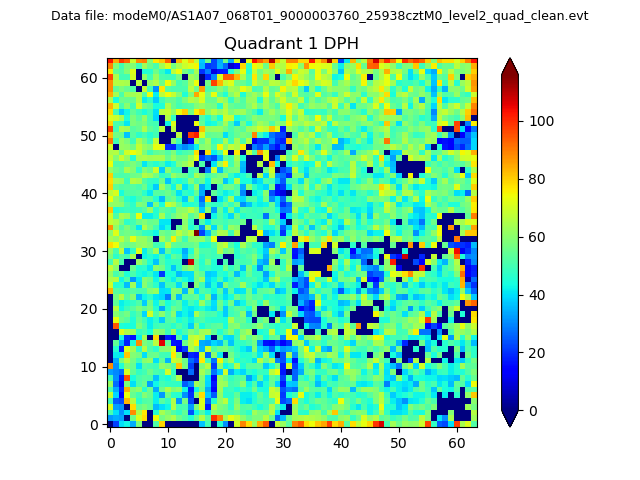 |
Quadrant B |
|---|---|---|---|
| Quadrant D | 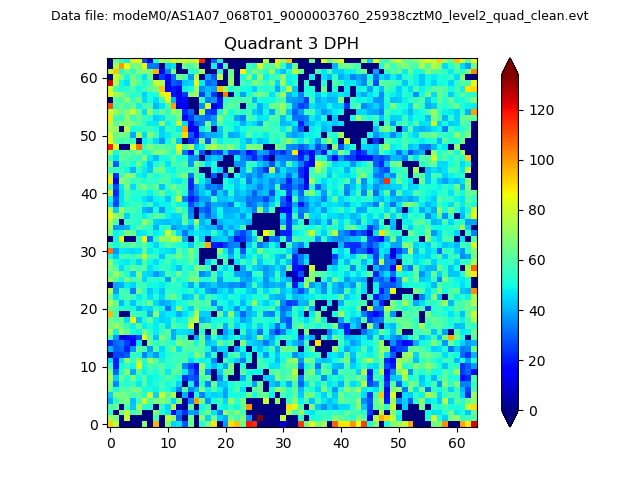 |
 |
Quadrant C |
| Plot type | Count rate plots | Images |
|---|---|---|
| Comparison with Poisson distribution Blue bars denote a histogram of data divided into 1 sec bins. Red curve is a Poisson curve with rate = median count rate of data. |
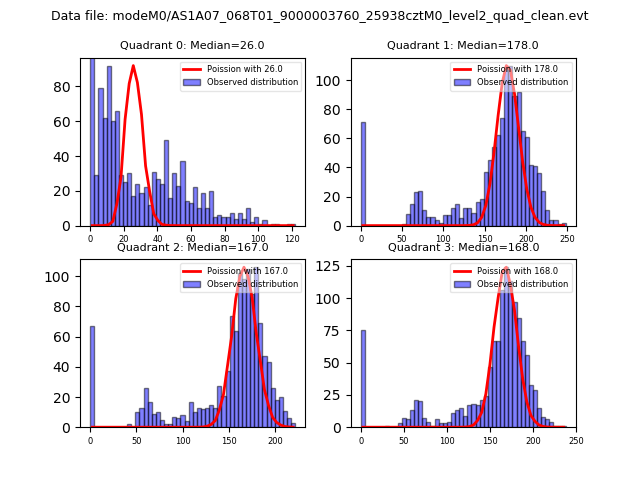 |
 |
| Quadrant-wise count rates Data is divided into 100 sec bins |
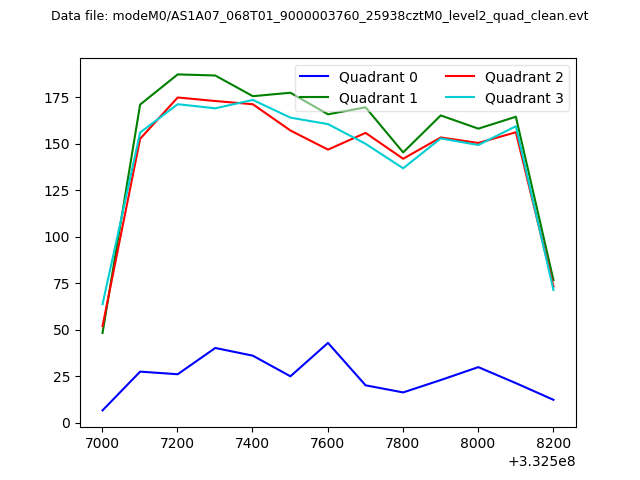 |
|
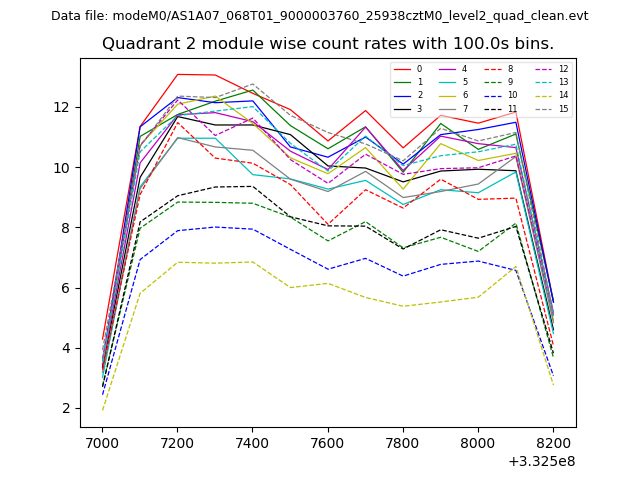
| Module-wise count rates for Quadrant A Data is divided into 100 sec bins |
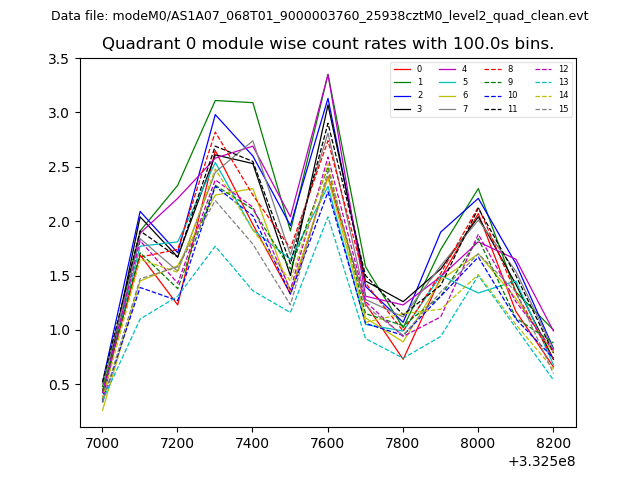 |
 |
| Module-wise count rates for Quadrant B Data is divided into 100 sec bins |
 |
 |
| Module-wise count rates for Quadrant C Data is divided into 100 sec bins |
 |
 |
| Module-wise count rates for Quadrant D Data is divided into 100 sec bins |
 |
 |
| Parameter | Plot |
|---|---|
| CZT HV Monitor | 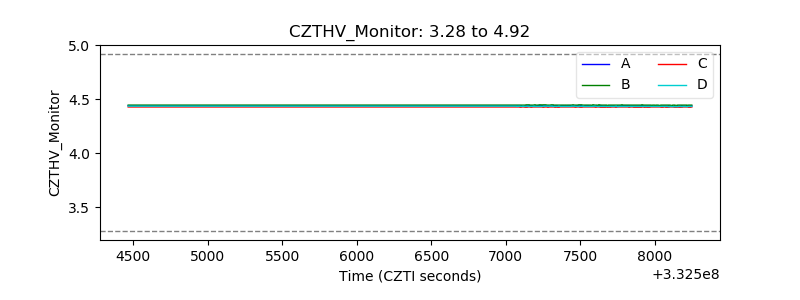 |
| D_VDD | 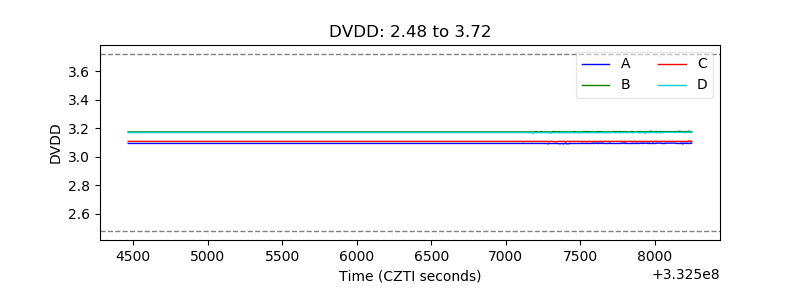 |
| Temperature 1 | 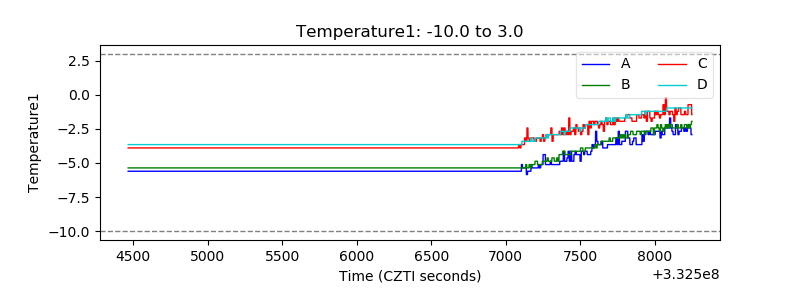 |
| Veto HV Monitor | 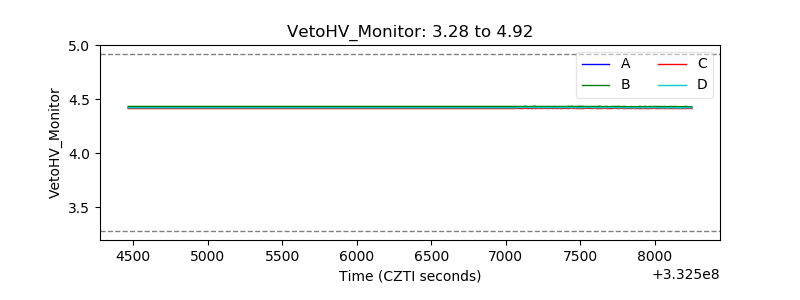 |
| Veto LLD | 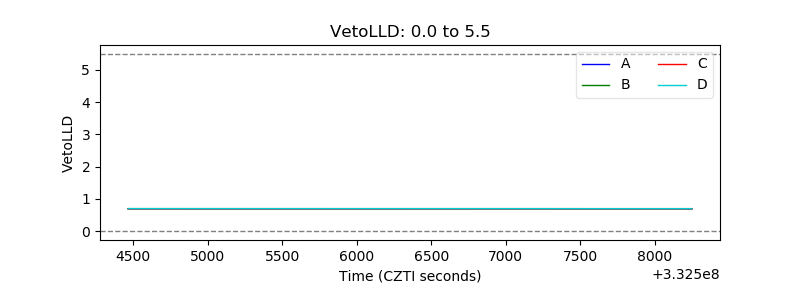 |
| Alpha Counter | 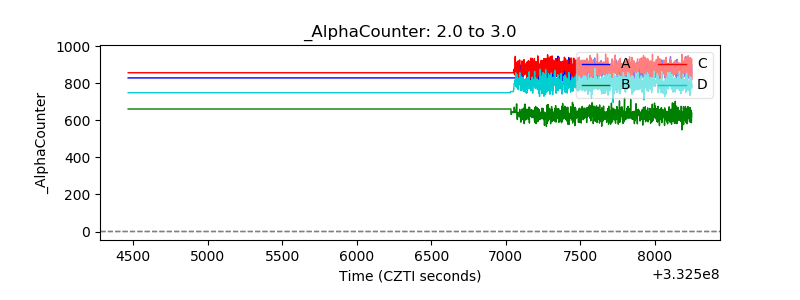 |
| _CPM_Rate | 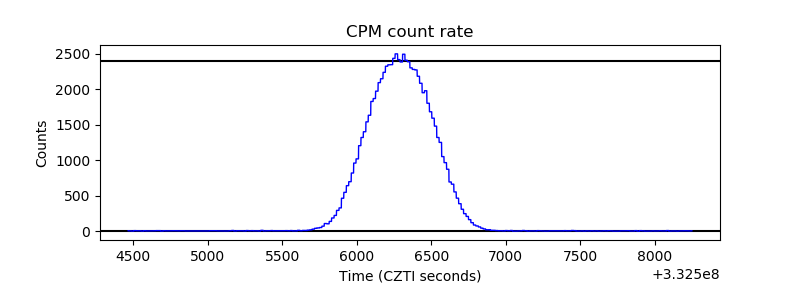 |
| CZT Counter | 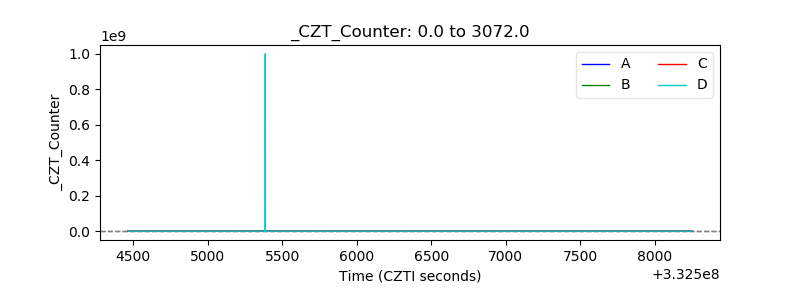 |
| +2.5 Volts monitor |  |
| +5 Volts monitor |  |
| _ROLL_ROT |  |
| _Roll_DEC | 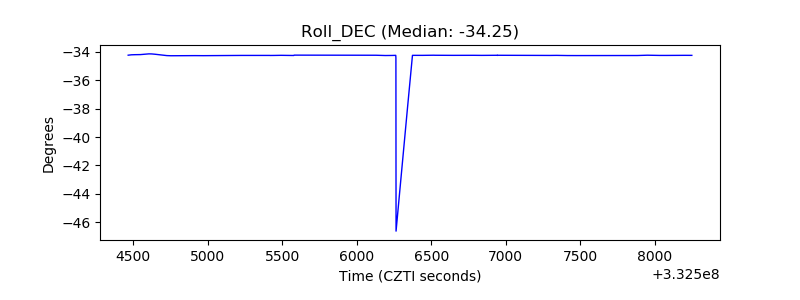 |
| _Roll_RA | 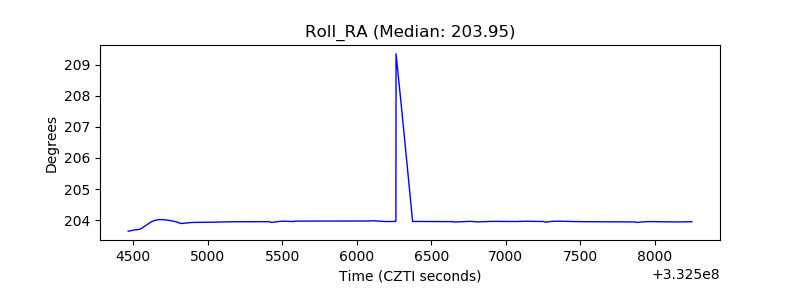 |
| Veto Counter | 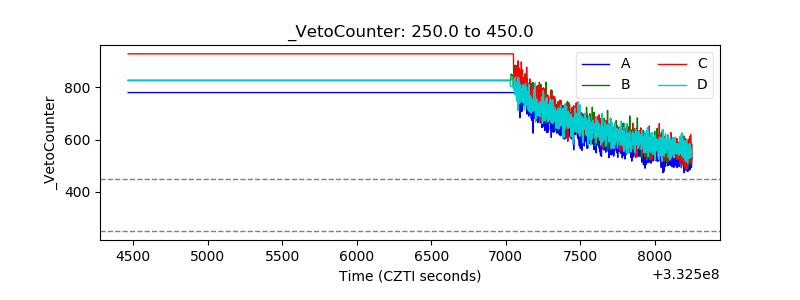 |