| Param | Original file | Final file |
|---|---|---|
| Filename | modeM0/AS1A07_068T01_9000003760_25939cztM0_level2.evt | modeM0/AS1A07_068T01_9000003760_25939cztM0_level2_quad_clean.evt |
| Size (bytes) | 879,433,920 | 86,094,720 |
| Size | 838.7 MB | 82.1 MB |
| Events in quadrant A | 15,487,366 | 166,870 |
| Events in quadrant B | 3,200,297 | 707,913 |
| Events in quadrant C | 3,087,766 | 660,907 |
| Events in quadrant D | 4,455,840 | 653,371 |
| Mode M0 | |||
|---|---|---|---|
| Quadrant | BADHDUFLAG | Total packets | Discarded packets |
| A | 0 | 50056 | 0 |
| B | 0 | 13204 | 0 |
| C | 0 | 12831 | 0 |
| D | 0 | 17217 | 0 |
| Mode M9 | |||
|---|---|---|---|
| Quadrant | BADHDUFLAG | Total packets | Discarded packets |
| A | 0 | 12 | 0 |
| B | 0 | 12 | 0 |
| C | 0 | 12 | 0 |
| D | 0 | 12 | 0 |
| Quadrant | Total seconds | Saturated seconds | Saturation percentage |
|---|---|---|---|
| A | 5953 | 5828 | 97.900218% |
| B | 5954 | 110 | 1.847497% |
| C | 5953 | 138 | 2.318159% |
| D | 5953 | 383 | 6.433731% |
Noise dominated data is calculated using 1-second bins in cleaned event files. If a bin has >2000 counts, and if more than 50% of those come from <1% of pixels, then it is considered to be noise-dominated and hence unusable.
| Quadrant | # 1 sec bins | Bins with >0 counts | Bins with >2000 counts | High rate bins dominated by noise | Noise dominated (total time) | Noise dominated (detector-on time) | Marked lightcurve |
|---|---|---|---|---|---|---|---|
| A | 7222 | 5953 | 5342 | 5342 | 73.97% | 89.74% | 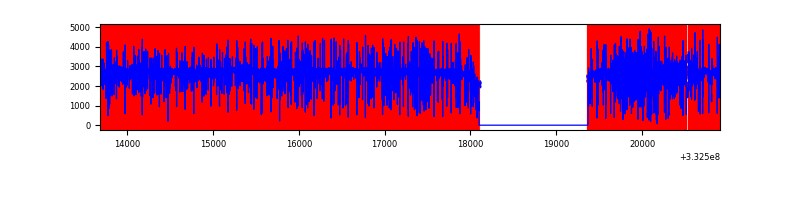 |
| B | 7224 | 5955 | 0 | 0 | 0.00% | 0.00% | 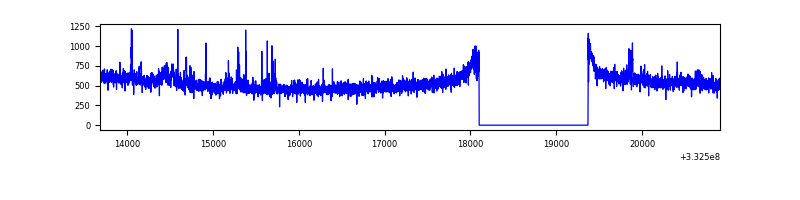 |
| C | 7223 | 5954 | 0 | 0 | 0.00% | 0.00% | 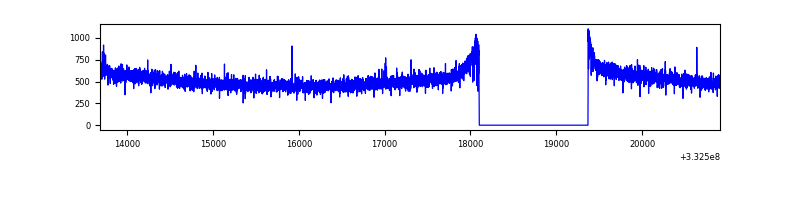 |
| D | 7223 | 5954 | 211 | 211 | 2.92% | 3.54% | 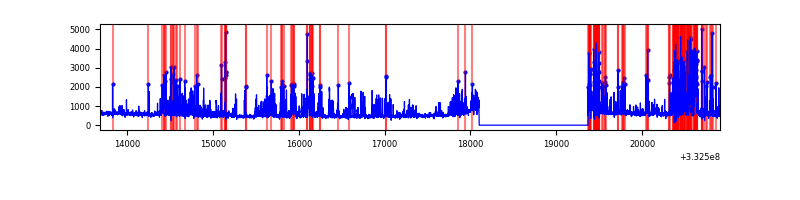 |
Top three noisy pixels from each quadrant. If the there are fewer than three noisy pixels in the level2.evt file, extra rows are filled as -1
| Pixel properties | Quadrant properties | ||||||
|---|---|---|---|---|---|---|---|
| Quadrant | DetID | PixID | Counts | Sigma | Mean | Median | Sigma |
| A | 0 | 13 | 14414113 | 280320.18 | 255 | 250 | 51.4 |
| A | 12 | 16 | 76690 | 1486.6 | 255 | 250 | 51.4 |
| A | 12 | 194 | 12967 | 247.32 | 255 | 250 | 51.4 |
| B | 0 | 190 | 55494 | 370.03 | 794 | 777 | 147.9 |
| B | 0 | 229 | 32140 | 212.1 | 794 | 777 | 147.9 |
| B | 12 | 111 | 17051 | 110.05 | 794 | 777 | 147.9 |
| C | 14 | 238 | 123805 | 706.42 | 756 | 762 | 174.2 |
| C | 3 | 233 | 19596 | 108.13 | 756 | 762 | 174.2 |
| C | 13 | 61 | 5269 | 25.87 | 756 | 762 | 174.2 |
| D | 1 | 52 | 1517881 | 8310.89 | 765 | 747 | 182.5 |
| D | 12 | 233 | 28661 | 152.91 | 765 | 747 | 182.5 |
| D | 2 | 234 | 23215 | 123.08 | 765 | 747 | 182.5 |
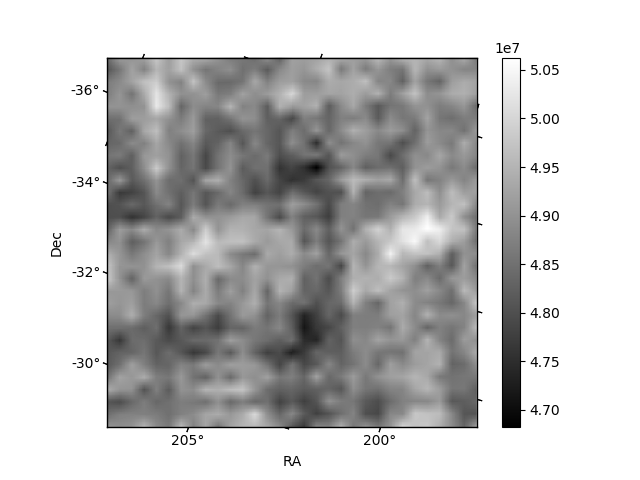
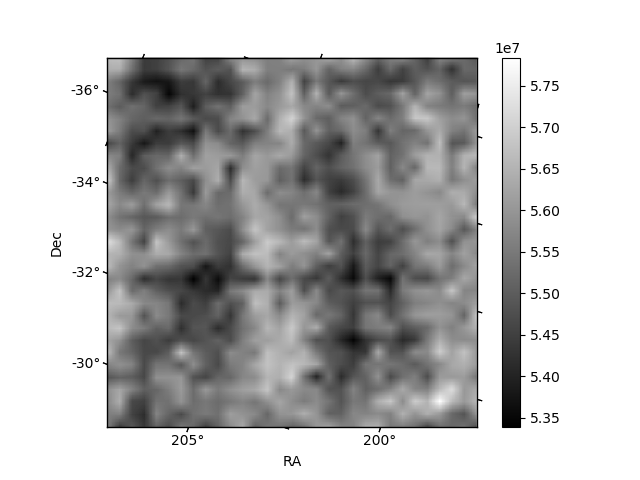
Histogram calculated using DETX and DETY for each event in the final _common_clean file
| Quadrant A | 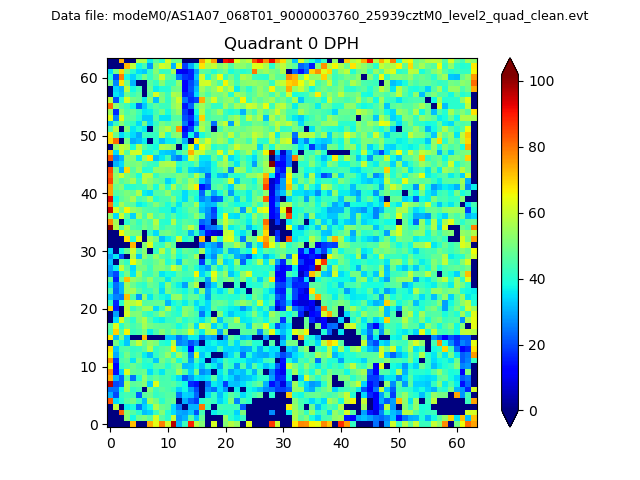 |
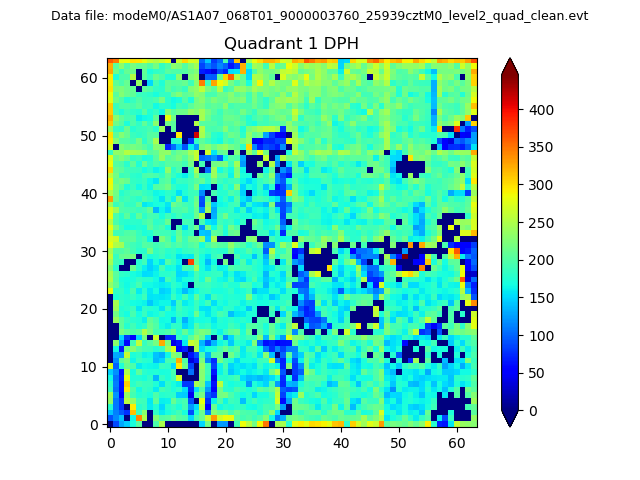 |
Quadrant B |
|---|---|---|---|
| Quadrant D | 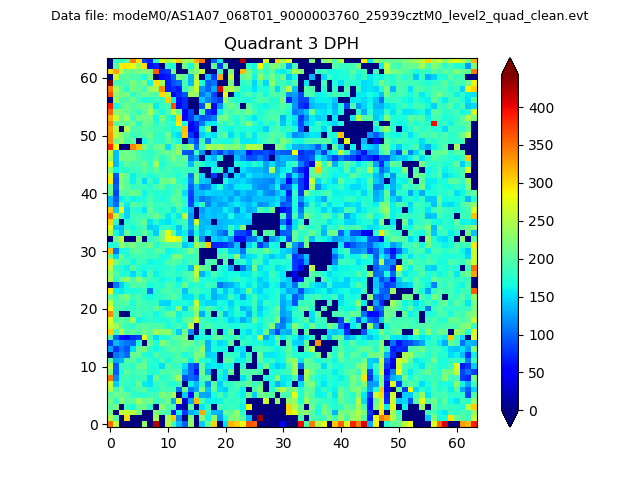 |
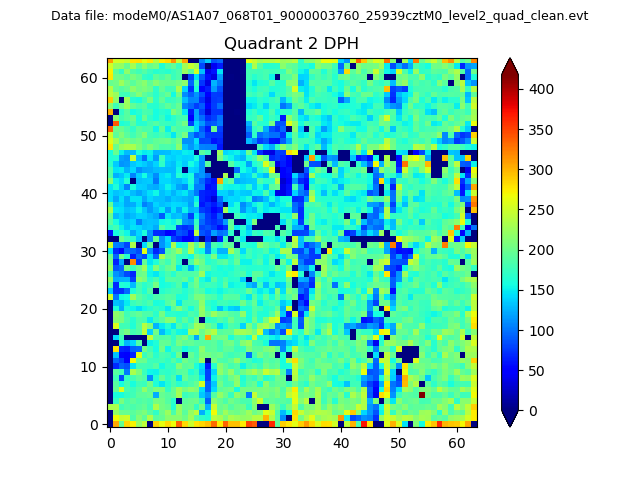 |
Quadrant C |
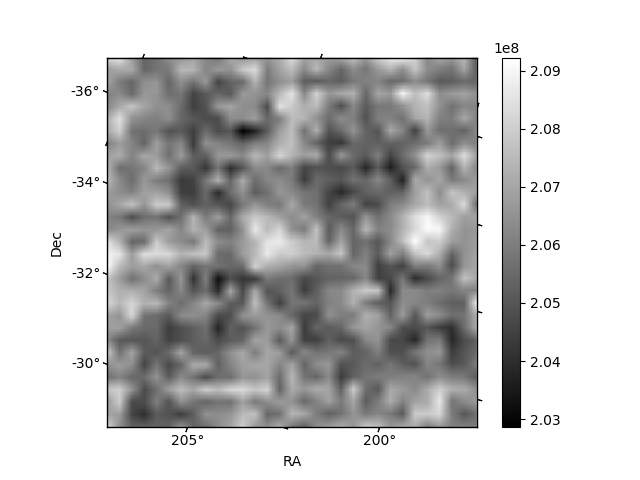
| Plot type | Count rate plots | Images |
|---|---|---|
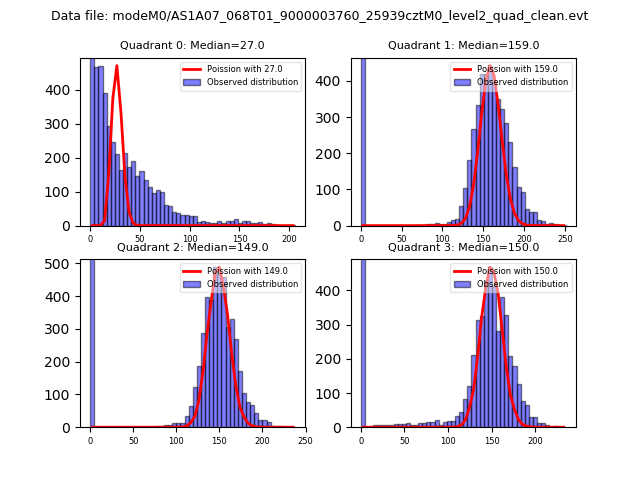
| Comparison with Poisson distribution Blue bars denote a histogram of data divided into 1 sec bins. Red curve is a Poisson curve with rate = median count rate of data. |
 |
 |
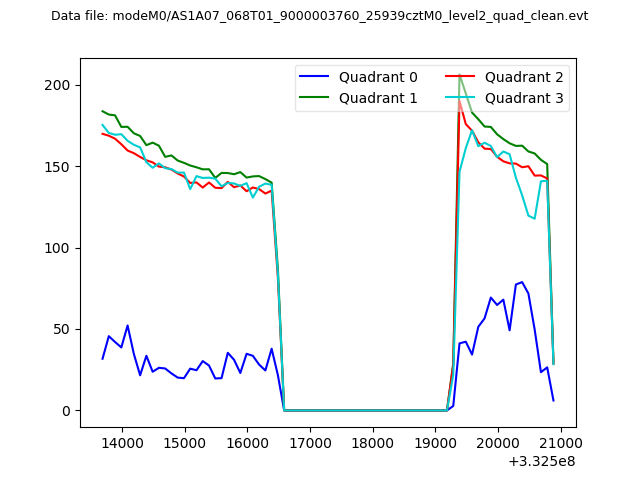
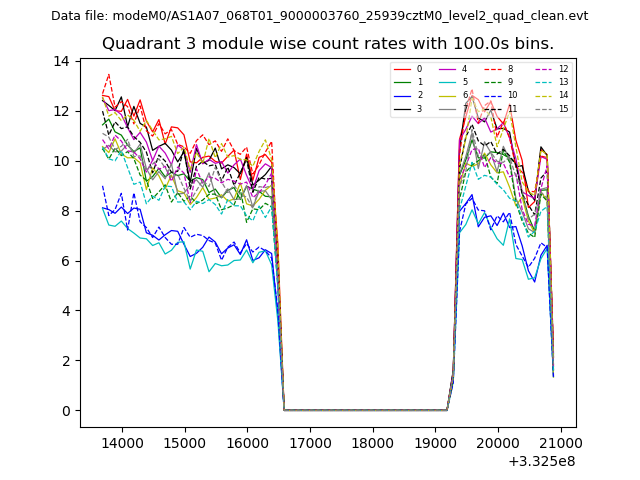
| Quadrant-wise count rates Data is divided into 100 sec bins |
 |
|
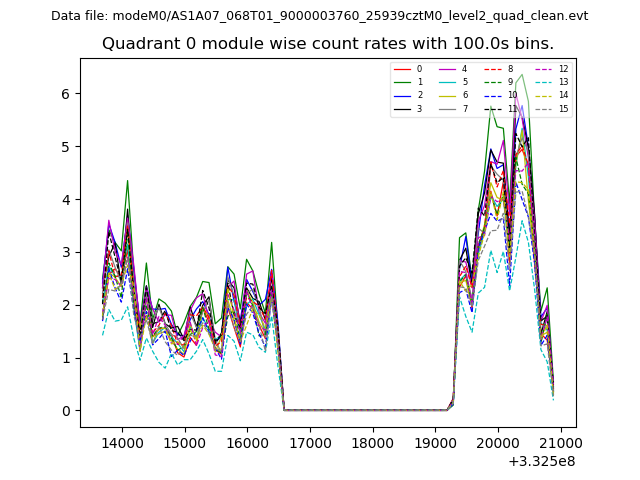
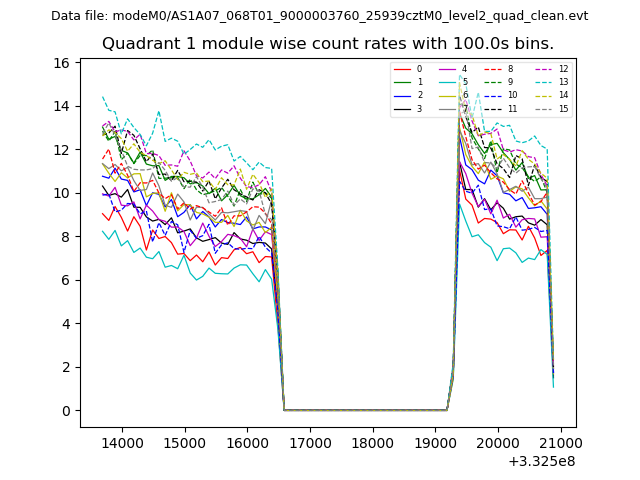
| Module-wise count rates for Quadrant A Data is divided into 100 sec bins |
 |
 |
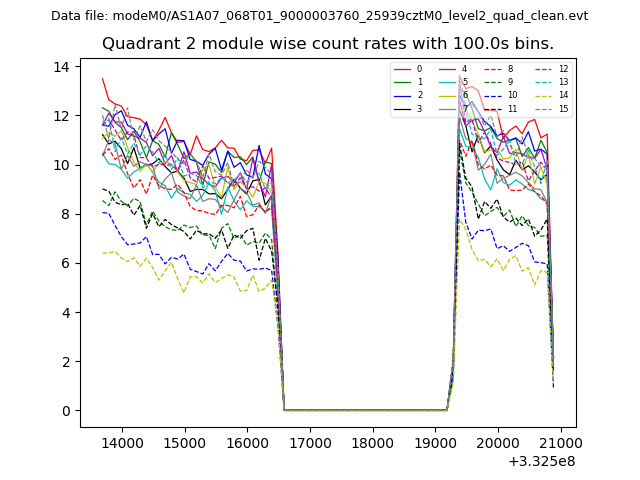
| Module-wise count rates for Quadrant B Data is divided into 100 sec bins |
 |
 |
| Module-wise count rates for Quadrant C Data is divided into 100 sec bins |
 |
 |
| Module-wise count rates for Quadrant D Data is divided into 100 sec bins |
 |
 |
| Parameter | Plot |
|---|---|
| CZT HV Monitor | 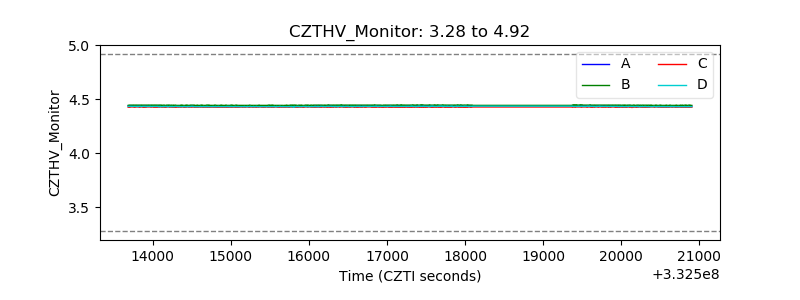 |
| D_VDD | 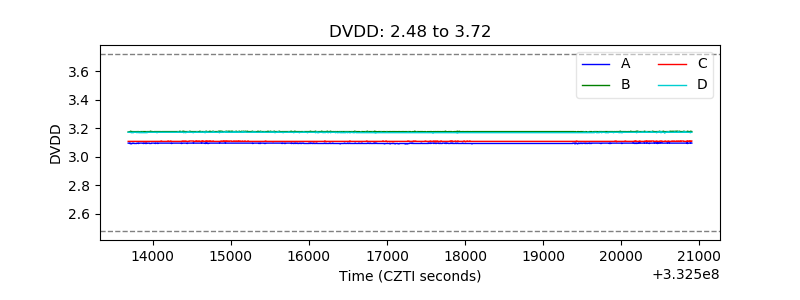 |
| Temperature 1 | 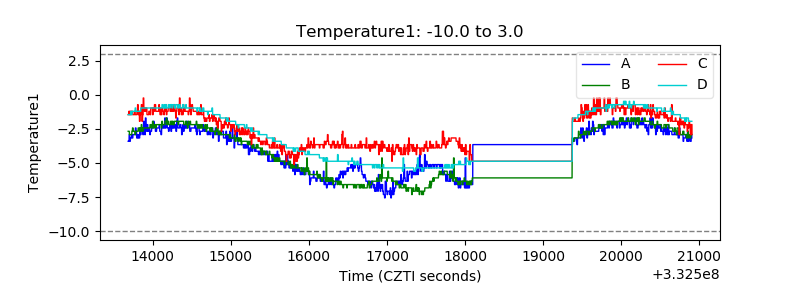 |
| Veto HV Monitor | 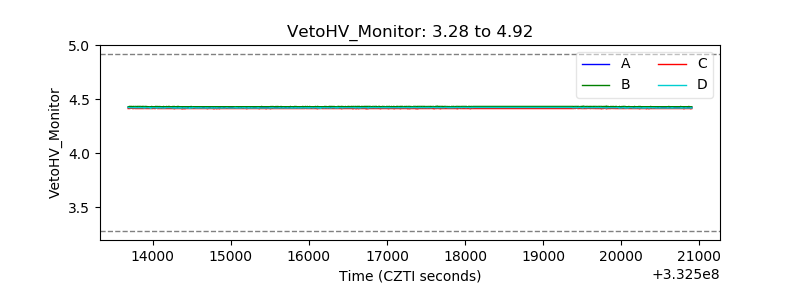 |
| Veto LLD | 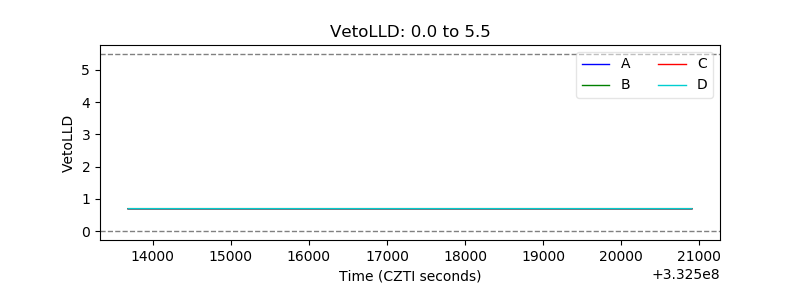 |
| Alpha Counter | 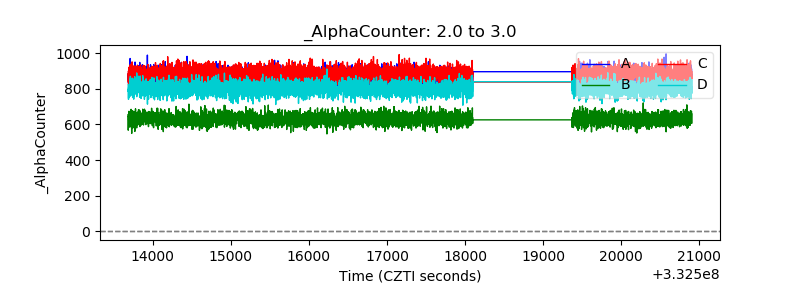 |
| _CPM_Rate | 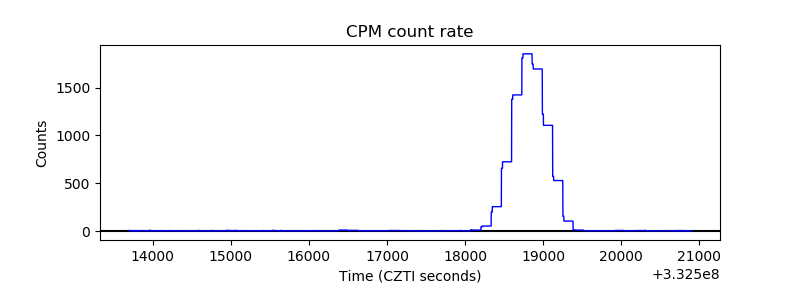 |
| CZT Counter | 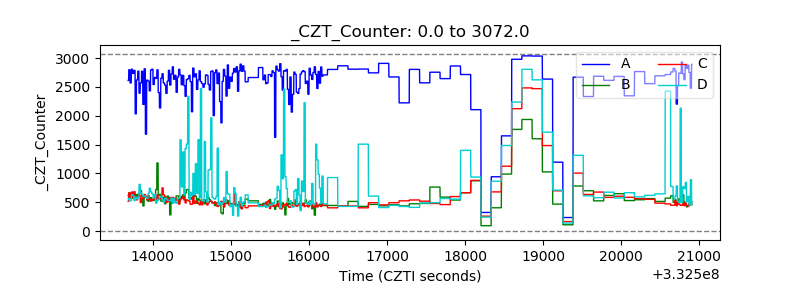 |
| +2.5 Volts monitor |  |
| +5 Volts monitor |  |
| _ROLL_ROT | 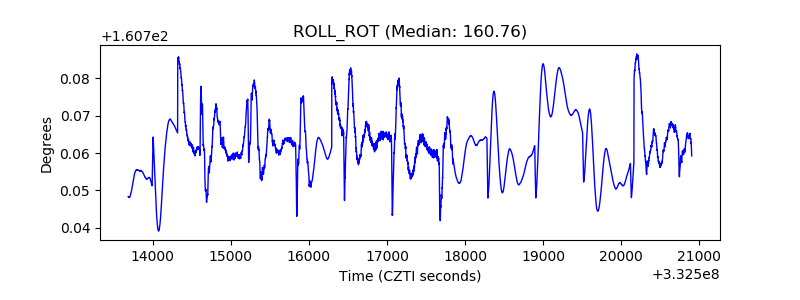 |
| _Roll_DEC | 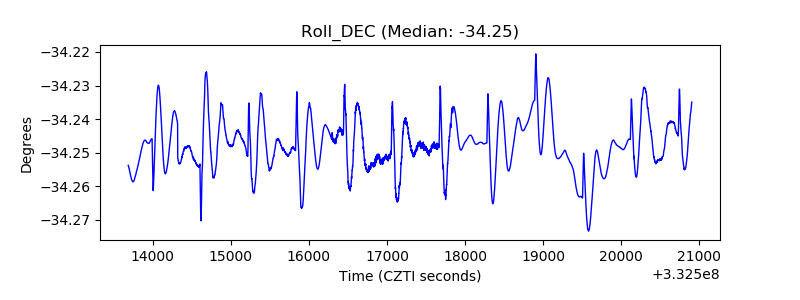 |
| _Roll_RA | 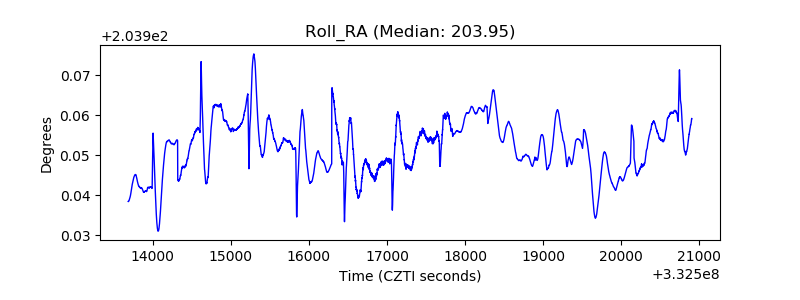 |
| Veto Counter | 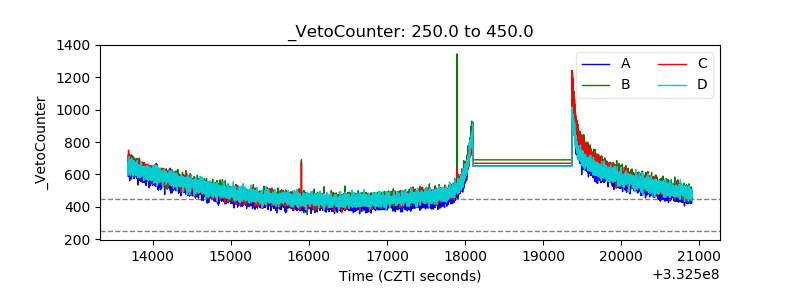 |