| Param | Original file | Final file |
|---|---|---|
| Filename | modeM0/AS1A07_068T01_9000003760_25940cztM0_level2.evt | modeM0/AS1A07_068T01_9000003760_25940cztM0_level2_quad_clean.evt |
| Size (bytes) | 780,099,840 | 73,566,720 |
| Size | 744.0 MB | 70.2 MB |
| Events in quadrant A | 13,118,965 | 263,708 |
| Events in quadrant B | 2,889,595 | 551,145 |
| Events in quadrant C | 2,839,212 | 515,727 |
| Events in quadrant D | 4,390,333 | 494,974 |
| Mode M0 | |||
|---|---|---|---|
| Quadrant | BADHDUFLAG | Total packets | Discarded packets |
| A | 0 | 42818 | 0 |
| B | 0 | 12069 | 0 |
| C | 0 | 12007 | 0 |
| D | 0 | 16870 | 0 |
| Mode M9 | |||
|---|---|---|---|
| Quadrant | BADHDUFLAG | Total packets | Discarded packets |
| A | 0 | 12 | 0 |
| B | 0 | 12 | 0 |
| C | 0 | 12 | 0 |
| D | 0 | 12 | 0 |
| Quadrant | Total seconds | Saturated seconds | Saturation percentage |
|---|---|---|---|
| A | 5721 | 4675 | 81.716483% |
| B | 5722 | 94 | 1.642782% |
| C | 5722 | 101 | 1.765117% |
| D | 5721 | 471 | 8.232826% |
Noise dominated data is calculated using 1-second bins in cleaned event files. If a bin has >2000 counts, and if more than 50% of those come from <1% of pixels, then it is considered to be noise-dominated and hence unusable.
| Quadrant | # 1 sec bins | Bins with >0 counts | Bins with >2000 counts | High rate bins dominated by noise | Noise dominated (total time) | Noise dominated (detector-on time) | Marked lightcurve |
|---|---|---|---|---|---|---|---|
| A | 6941 | 5722 | 3910 | 3910 | 56.33% | 68.33% | 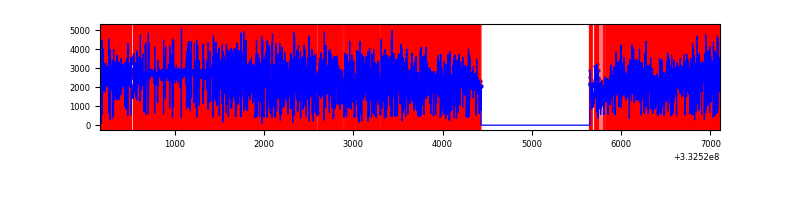 |
| B | 6942 | 5723 | 0 | 0 | 0.00% | 0.00% | 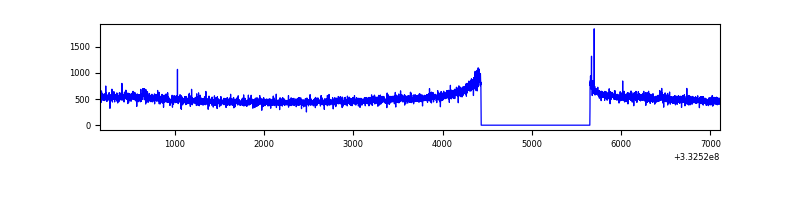 |
| C | 6942 | 5723 | 0 | 0 | 0.00% | 0.00% | 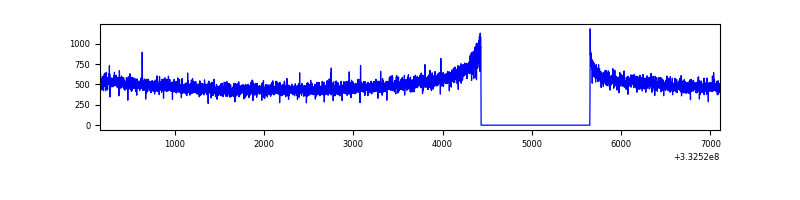 |
| D | 6941 | 5722 | 354 | 354 | 5.10% | 6.19% | 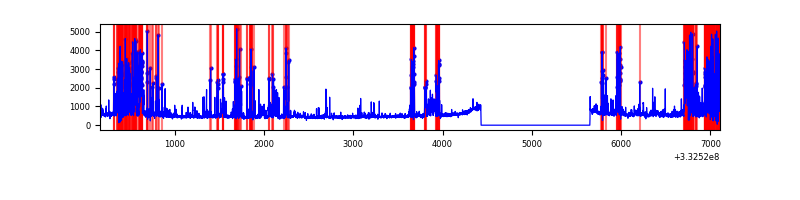 |
Top three noisy pixels from each quadrant. If the there are fewer than three noisy pixels in the level2.evt file, extra rows are filled as -1
| Pixel properties | Quadrant properties | ||||||
|---|---|---|---|---|---|---|---|
| Quadrant | DetID | PixID | Counts | Sigma | Mean | Median | Sigma |
| A | 0 | 13 | 11402626 | 130428.67 | 433 | 427 | 87.4 |
| A | 12 | 16 | 30121 | 339.67 | 433 | 427 | 87.4 |
| A | 13 | 170 | 9739 | 106.52 | 433 | 427 | 87.4 |
| B | 12 | 111 | 16132 | 110.12 | 732 | 717 | 140.0 |
| B | 0 | 229 | 15177 | 103.3 | 732 | 717 | 140.0 |
| B | 11 | 111 | 14723 | 100.05 | 732 | 717 | 140.0 |
| C | 14 | 238 | 113443 | 695.98 | 694 | 699 | 162.0 |
| C | 3 | 233 | 18891 | 112.3 | 694 | 699 | 162.0 |
| C | 13 | 61 | 4896 | 25.91 | 694 | 699 | 162.0 |
| D | 1 | 52 | 1759178 | 10552.97 | 694 | 676 | 166.6 |
| D | 2 | 234 | 23350 | 136.07 | 694 | 676 | 166.6 |
| D | 14 | 226 | 6381 | 34.24 | 694 | 676 | 166.6 |
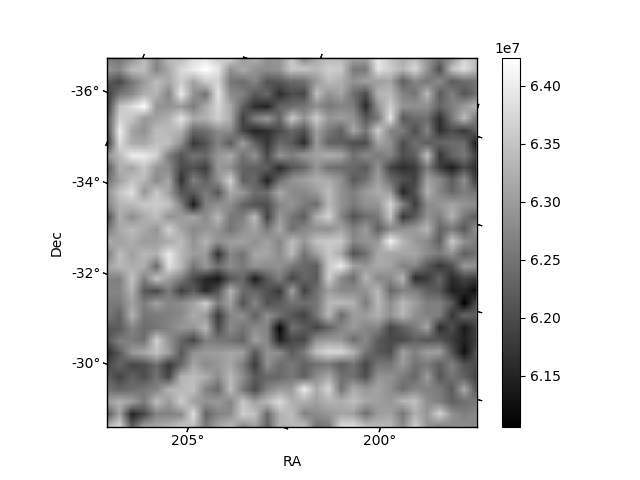
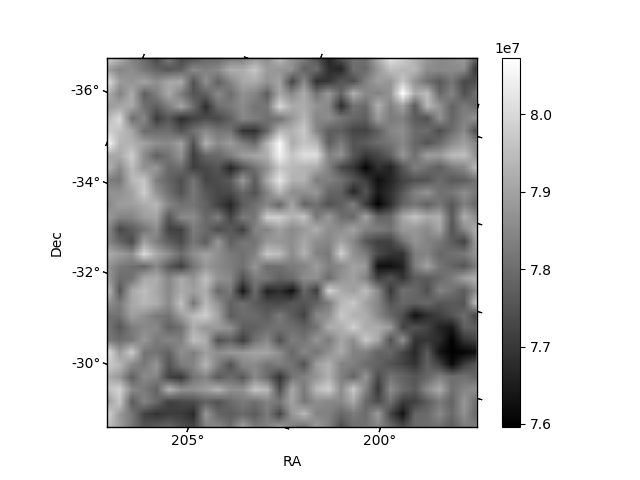
Histogram calculated using DETX and DETY for each event in the final _common_clean file
| Quadrant A |  |
 |
Quadrant B |
|---|---|---|---|
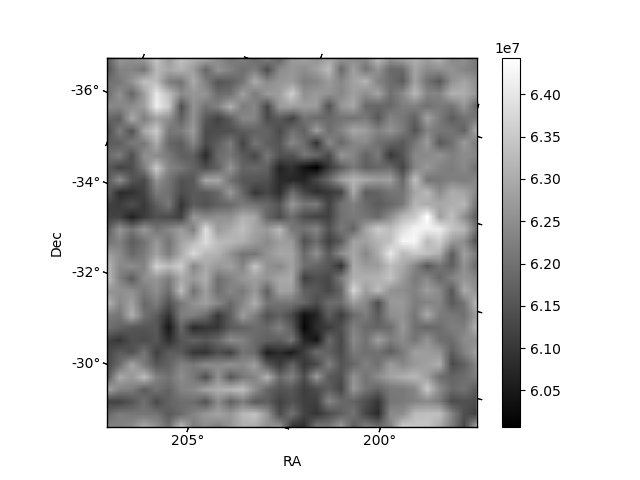
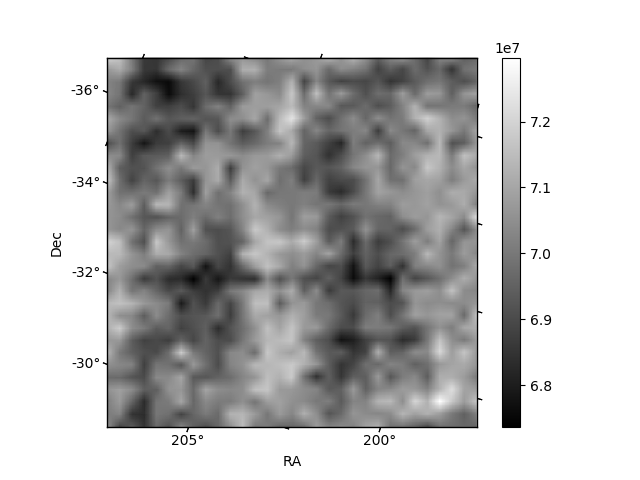
| Quadrant D |  |
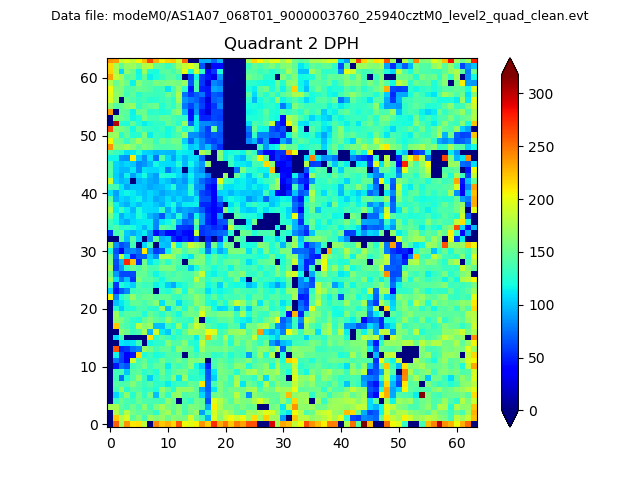 |
Quadrant C |
| Plot type | Count rate plots | Images |
|---|---|---|
| Comparison with Poisson distribution Blue bars denote a histogram of data divided into 1 sec bins. Red curve is a Poisson curve with rate = median count rate of data. |
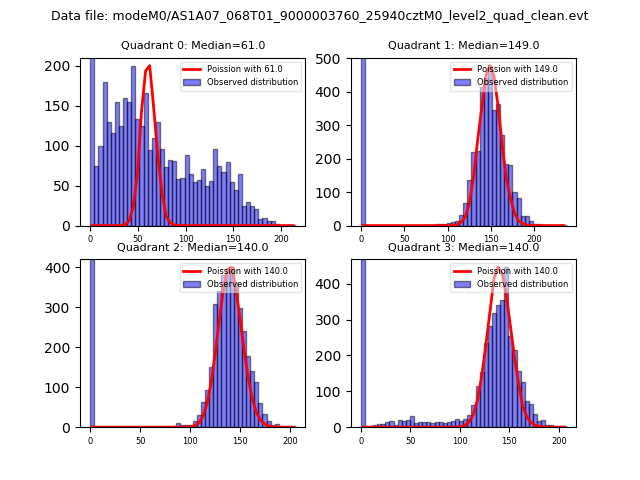 |
 |
| Quadrant-wise count rates Data is divided into 100 sec bins |
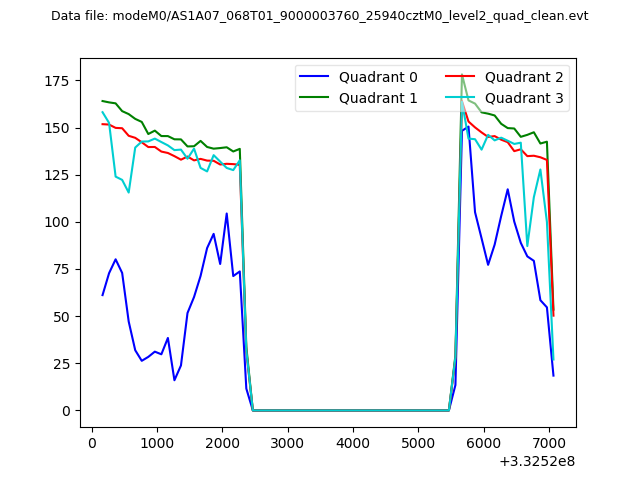 |
|
| Module-wise count rates for Quadrant A Data is divided into 100 sec bins |
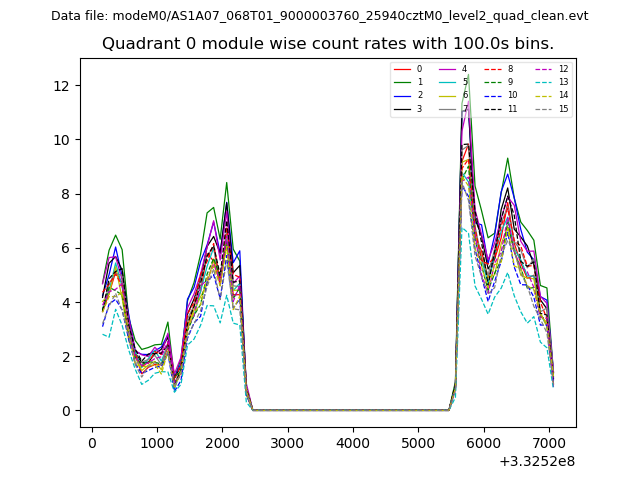 |
 |
| Module-wise count rates for Quadrant B Data is divided into 100 sec bins |
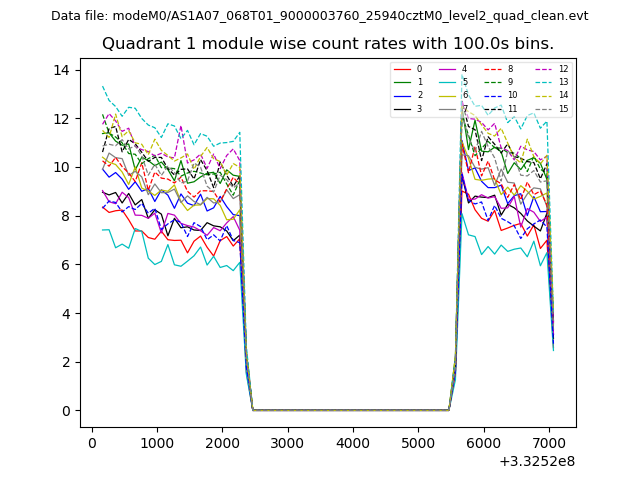 |
 |
| Module-wise count rates for Quadrant C Data is divided into 100 sec bins |
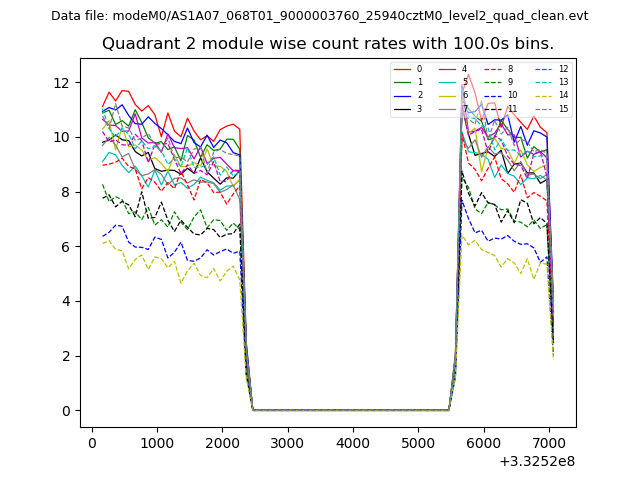 |
 |
| Module-wise count rates for Quadrant D Data is divided into 100 sec bins |
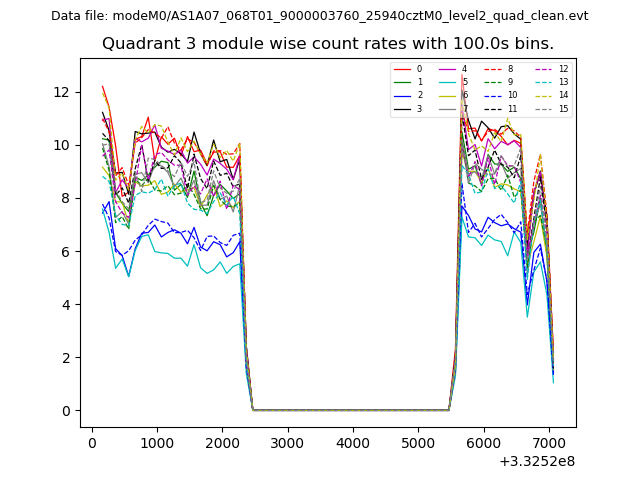 |
 |
| Parameter | Plot |
|---|---|
| CZT HV Monitor | 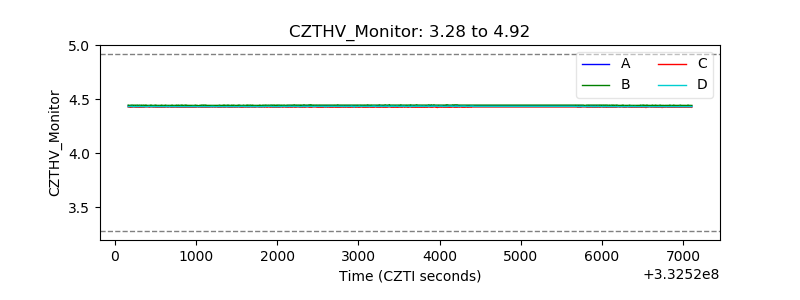 |
| D_VDD | 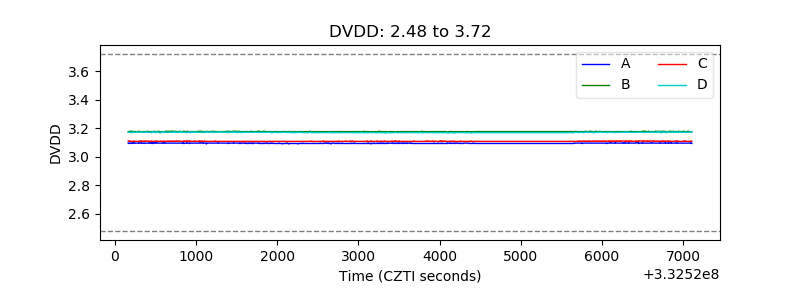 |
| Temperature 1 | 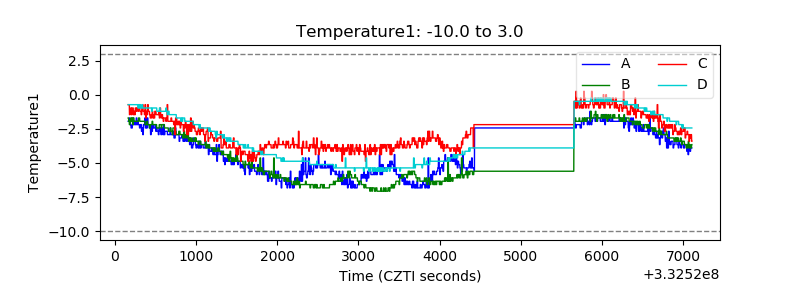 |
| Veto HV Monitor | 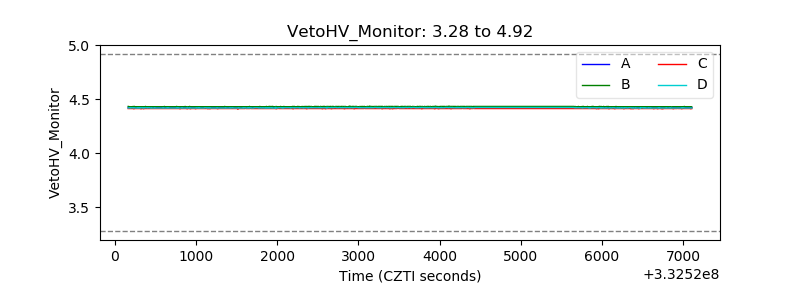 |
| Veto LLD |  |
| Alpha Counter | 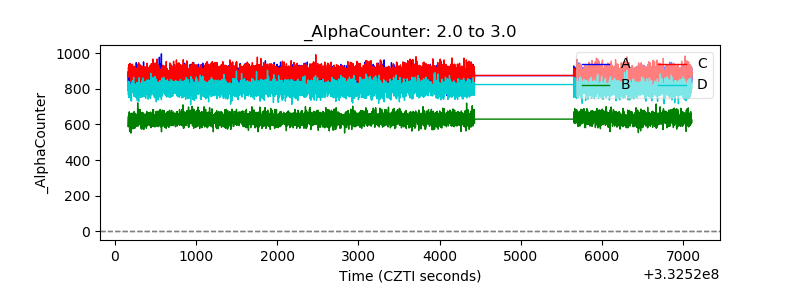 |
| _CPM_Rate | 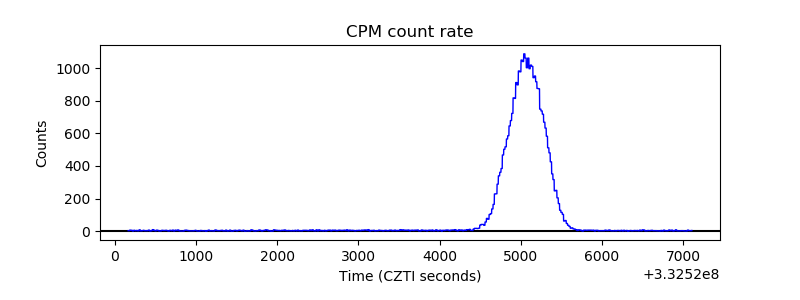 |
| CZT Counter | 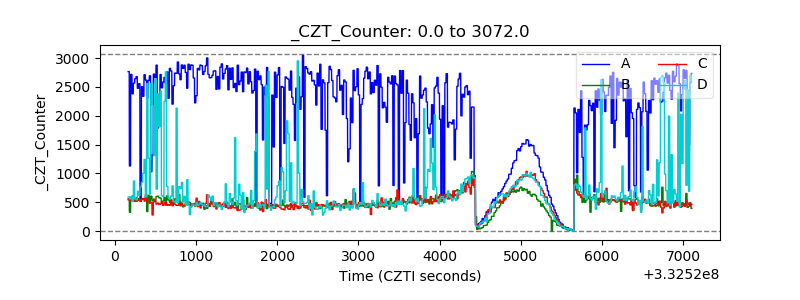 |
| +2.5 Volts monitor | 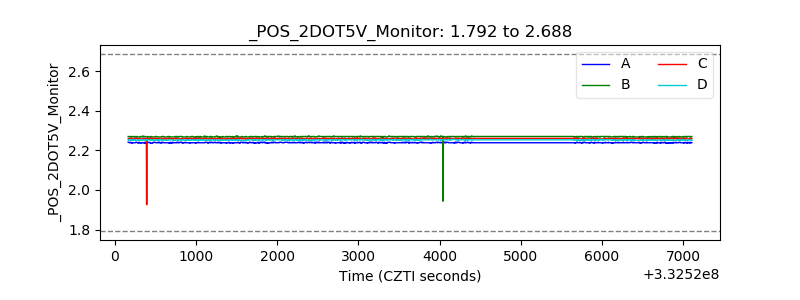 |
| +5 Volts monitor |  |
| _ROLL_ROT | 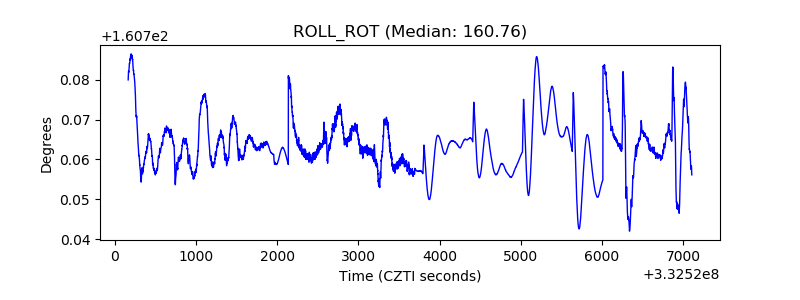 |
| _Roll_DEC | 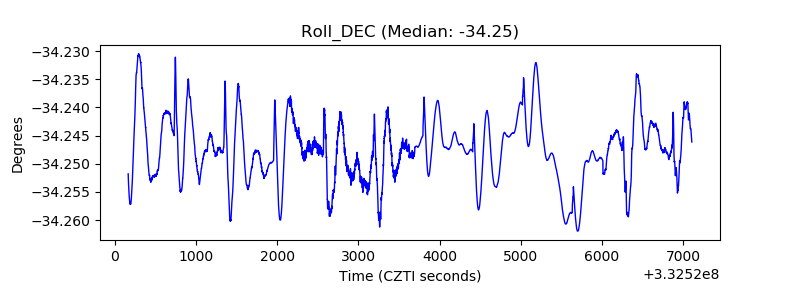 |
| _Roll_RA | 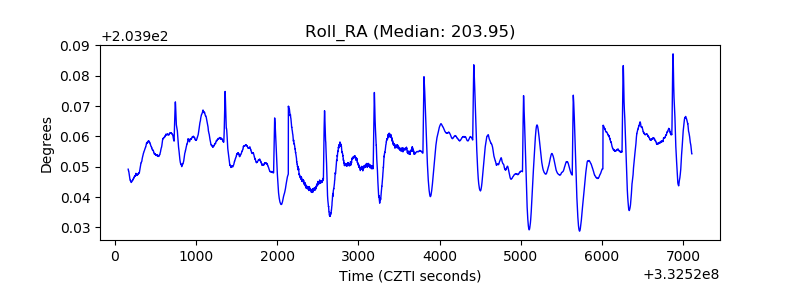 |
| Veto Counter | 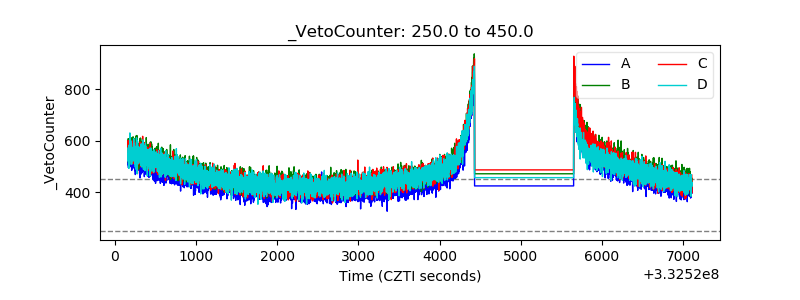 |