| Param | Original file | Final file |
|---|---|---|
| Filename | modeM0/AS1A07_068T01_9000003760_25941cztM0_level2.evt | modeM0/AS1A07_068T01_9000003760_25941cztM0_level2_quad_clean.evt |
| Size (bytes) | 771,932,160 | 77,460,480 |
| Size | 736.2 MB | 73.9 MB |
| Events in quadrant A | 11,703,779 | 293,822 |
| Events in quadrant B | 3,044,681 | 581,818 |
| Events in quadrant C | 2,977,466 | 547,909 |
| Events in quadrant D | 5,234,776 | 489,335 |
| Mode M0 | |||
|---|---|---|---|
| Quadrant | BADHDUFLAG | Total packets | Discarded packets |
| A | 0 | 38936 | 0 |
| B | 0 | 12970 | 0 |
| C | 0 | 12816 | 0 |
| D | 0 | 19741 | 0 |
| Mode M9 | |||
|---|---|---|---|
| Quadrant | BADHDUFLAG | Total packets | Discarded packets |
| A | 0 | 9 | 0 |
| B | 0 | 9 | 0 |
| C | 0 | 9 | 0 |
| D | 0 | 9 | 0 |
| Quadrant | Total seconds | Saturated seconds | Saturation percentage |
|---|---|---|---|
| A | 6171 | 3721 | 60.298169% |
| B | 6171 | 57 | 0.923675% |
| C | 6172 | 76 | 1.231367% |
| D | 6172 | 783 | 12.686325% |
Noise dominated data is calculated using 1-second bins in cleaned event files. If a bin has >2000 counts, and if more than 50% of those come from <1% of pixels, then it is considered to be noise-dominated and hence unusable.
| Quadrant | # 1 sec bins | Bins with >0 counts | Bins with >2000 counts | High rate bins dominated by noise | Noise dominated (total time) | Noise dominated (detector-on time) | Marked lightcurve |
|---|---|---|---|---|---|---|---|
| A | 7166 | 6171 | 3435 | 3435 | 47.93% | 55.66% | 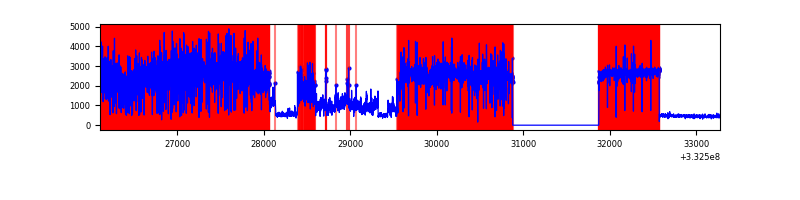 |
| B | 7166 | 6172 | 3 | 3 | 0.04% | 0.05% | 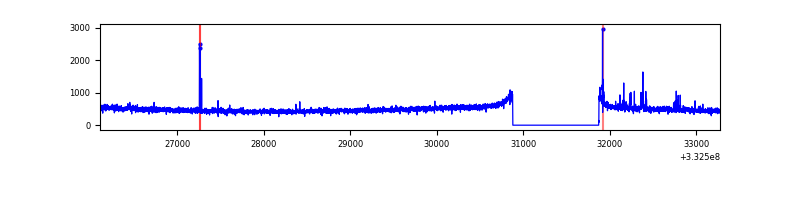 |
| C | 7167 | 6173 | 0 | 0 | 0.00% | 0.00% | 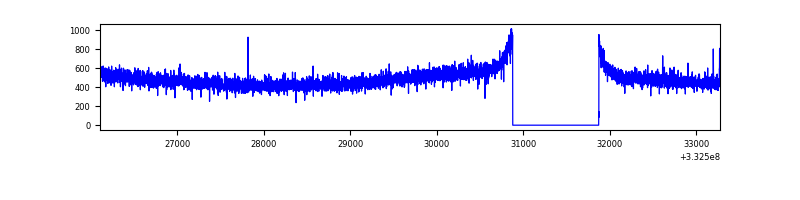 |
| D | 7167 | 6173 | 645 | 645 | 9.00% | 10.45% | 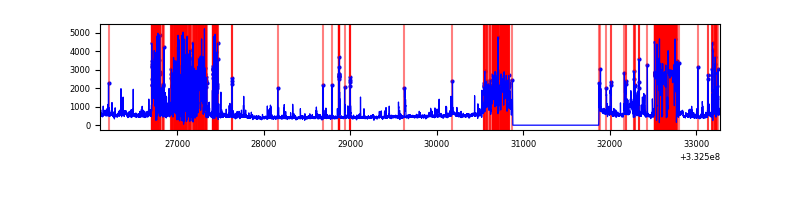 |
Top three noisy pixels from each quadrant. If the there are fewer than three noisy pixels in the level2.evt file, extra rows are filled as -1
| Pixel properties | Quadrant properties | ||||||
|---|---|---|---|---|---|---|---|
| Quadrant | DetID | PixID | Counts | Sigma | Mean | Median | Sigma |
| A | 0 | 13 | 9724389 | 99106.04 | 481 | 472 | 98.1 |
| A | 12 | 16 | 108307 | 1099.05 | 481 | 472 | 98.1 |
| A | 12 | 194 | 20222 | 201.29 | 481 | 472 | 98.1 |
| B | 15 | 33 | 32295 | 216.18 | 762 | 747 | 145.9 |
| B | 5 | 172 | 27820 | 185.51 | 762 | 747 | 145.9 |
| B | 12 | 111 | 17358 | 113.82 | 762 | 747 | 145.9 |
| C | 14 | 238 | 119621 | 701.73 | 726 | 730 | 169.4 |
| C | 3 | 233 | 25559 | 146.55 | 726 | 730 | 169.4 |
| C | 13 | 61 | 5127 | 25.95 | 726 | 730 | 169.4 |
| D | 1 | 52 | 2590892 | 15608.59 | 691 | 675 | 165.9 |
| D | 2 | 234 | 24180 | 141.64 | 691 | 675 | 165.9 |
| D | 7 | 38 | 12024 | 68.39 | 691 | 675 | 165.9 |
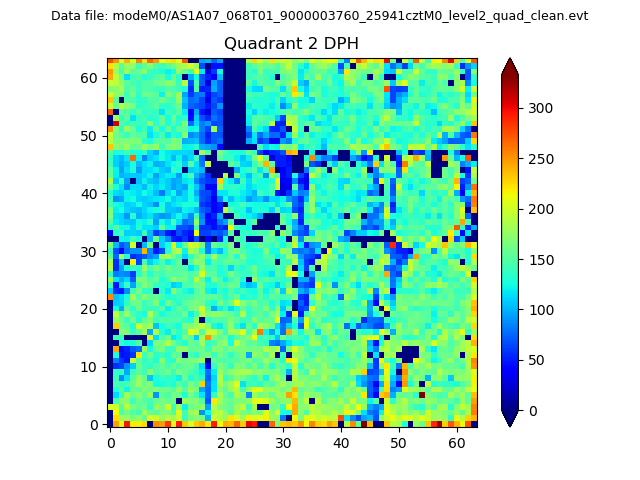
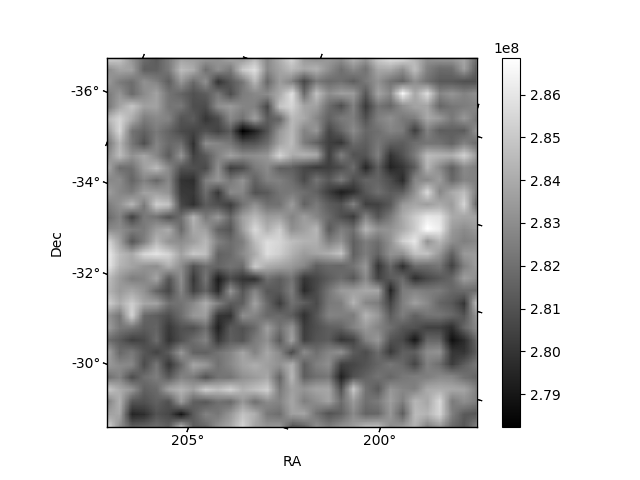
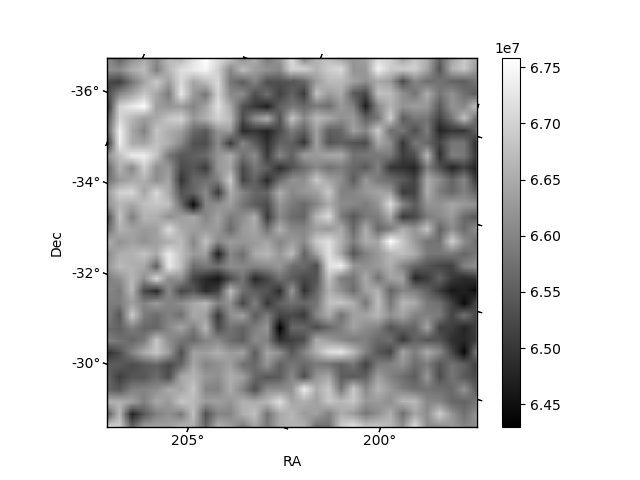
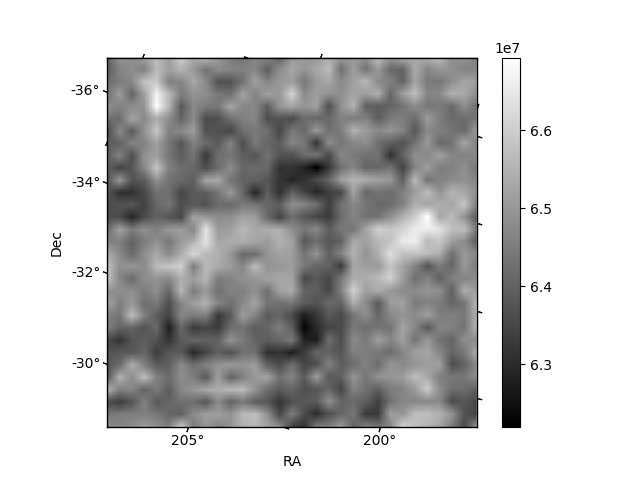
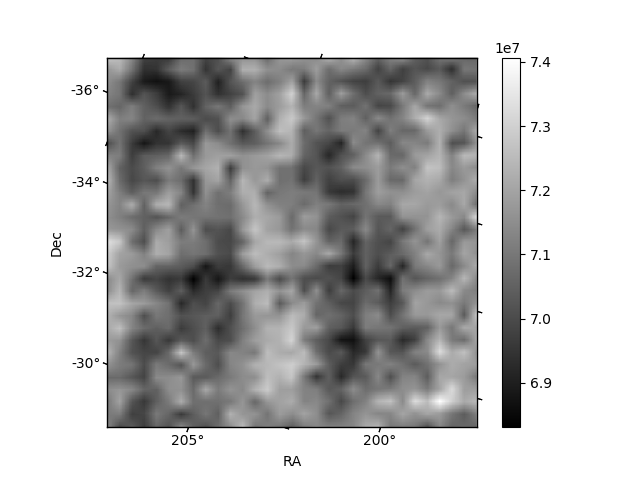
Histogram calculated using DETX and DETY for each event in the final _common_clean file
| Quadrant A | 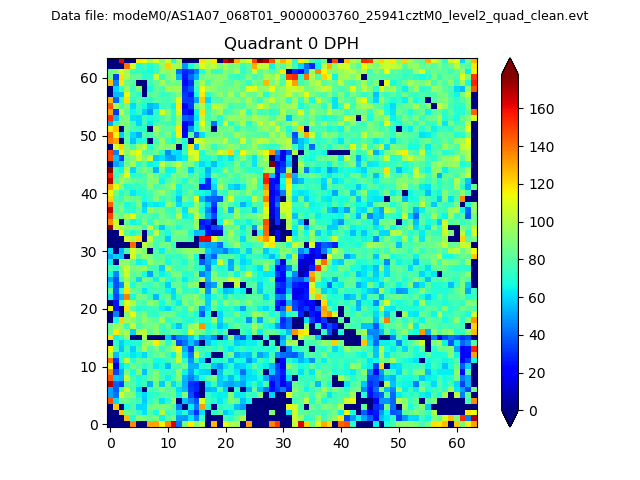 |
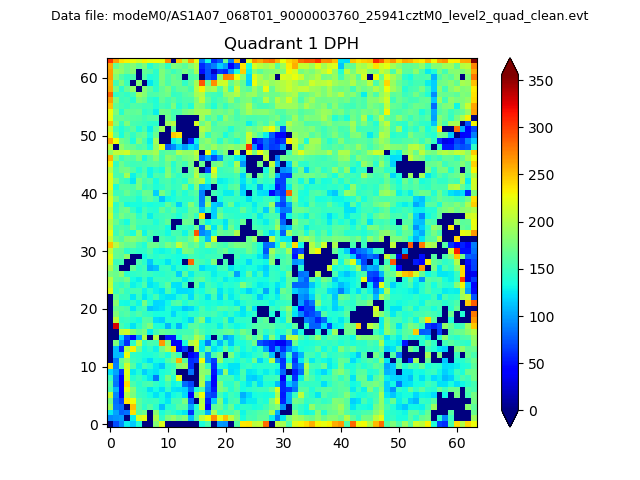 |
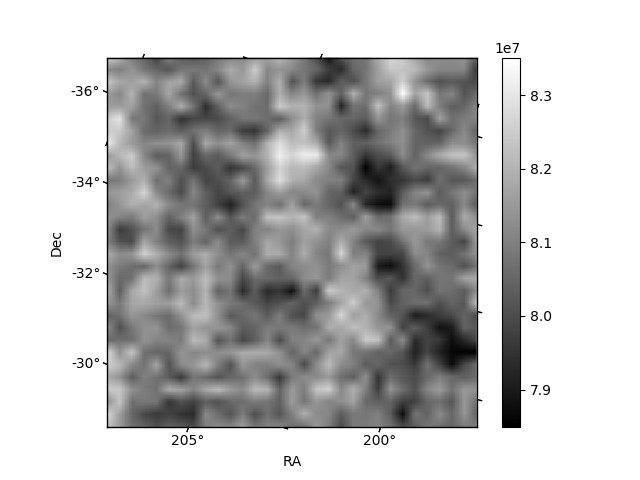
Quadrant B |
|---|---|---|---|
| Quadrant D | 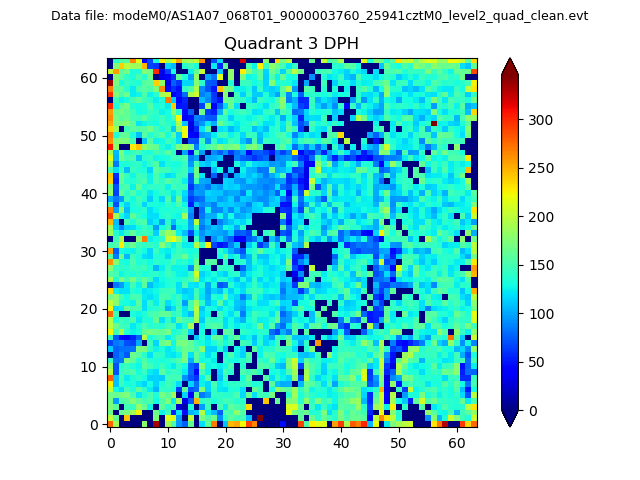 |
 |
Quadrant C |
| Plot type | Count rate plots | Images |
|---|---|---|
| Comparison with Poisson distribution Blue bars denote a histogram of data divided into 1 sec bins. Red curve is a Poisson curve with rate = median count rate of data. |
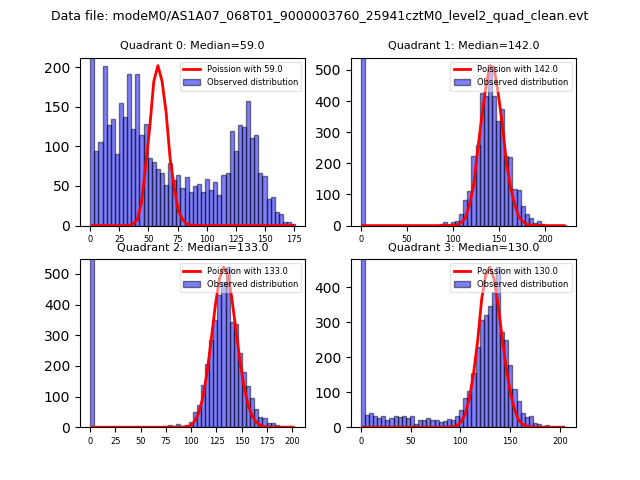 |
 |
| Quadrant-wise count rates Data is divided into 100 sec bins |
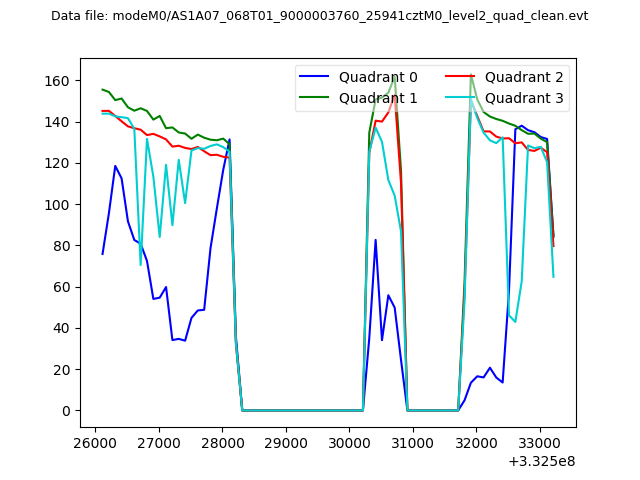 |
|
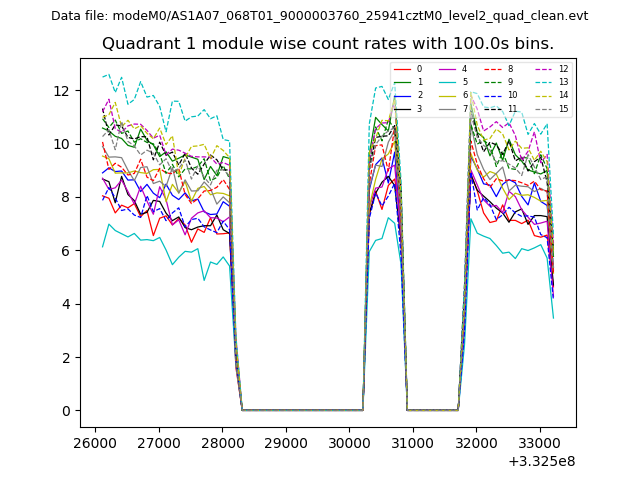
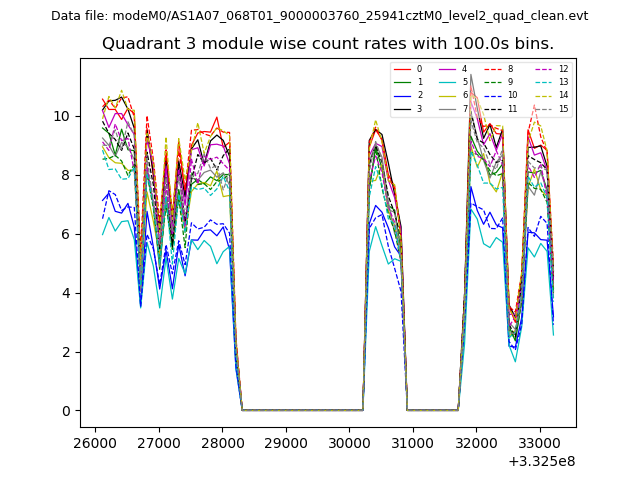
| Module-wise count rates for Quadrant A Data is divided into 100 sec bins |
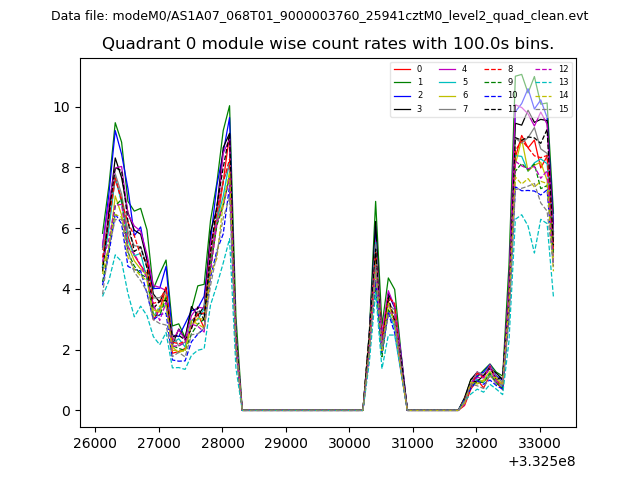 |
 |
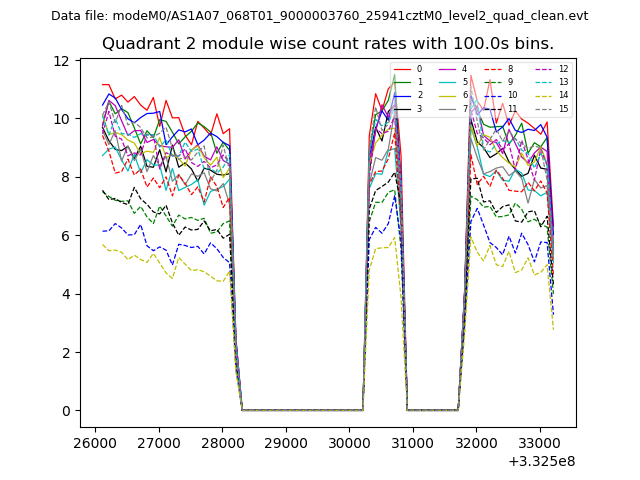
| Module-wise count rates for Quadrant B Data is divided into 100 sec bins |
 |
 |
| Module-wise count rates for Quadrant C Data is divided into 100 sec bins |
 |
 |
| Module-wise count rates for Quadrant D Data is divided into 100 sec bins |
 |
 |
| Parameter | Plot |
|---|---|
| CZT HV Monitor | 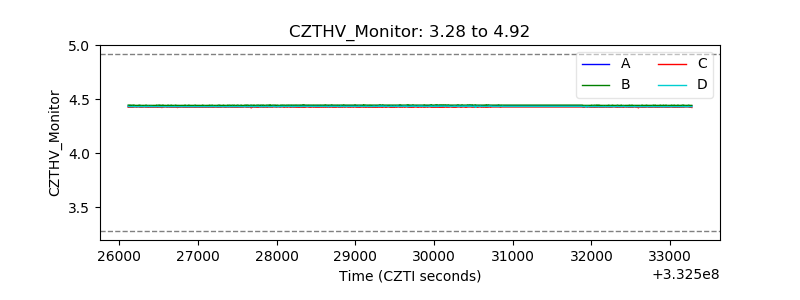 |
| D_VDD | 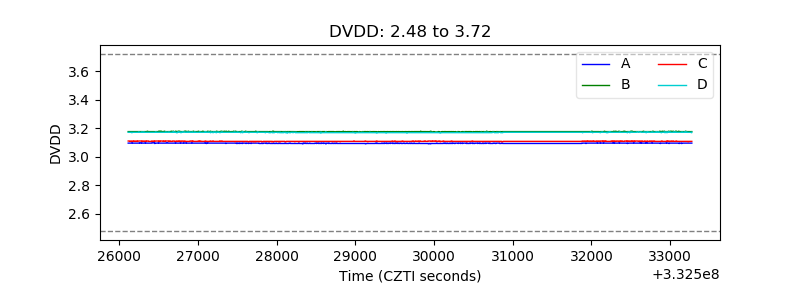 |
| Temperature 1 | 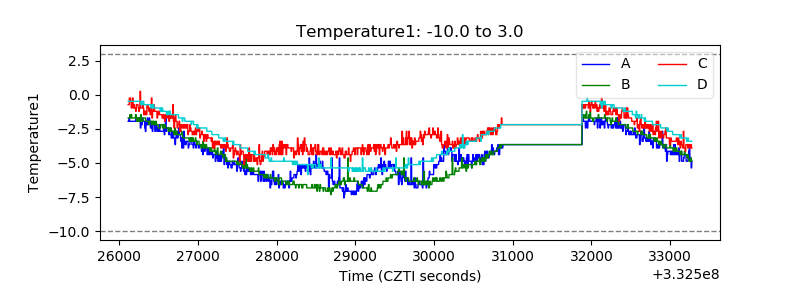 |
| Veto HV Monitor | 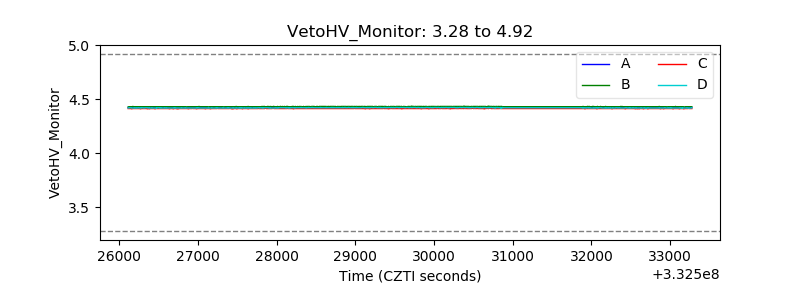 |
| Veto LLD | 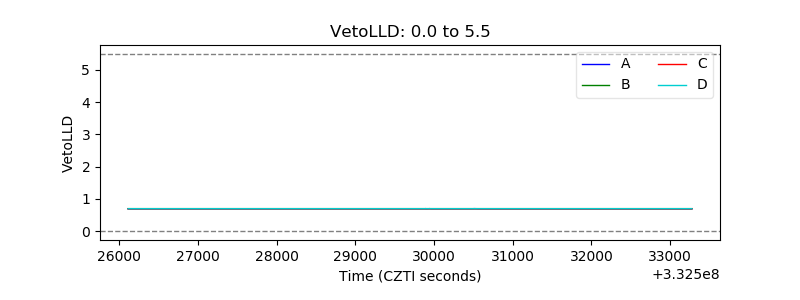 |
| Alpha Counter | 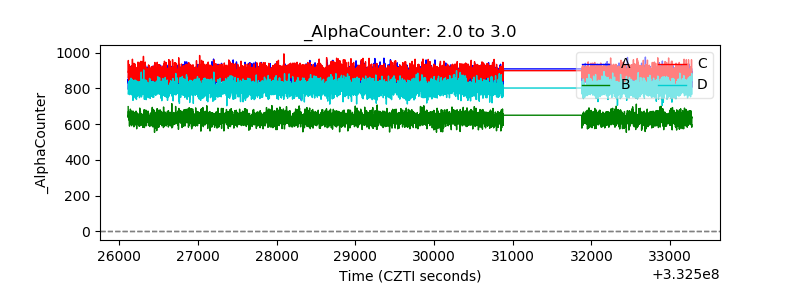 |
| _CPM_Rate | 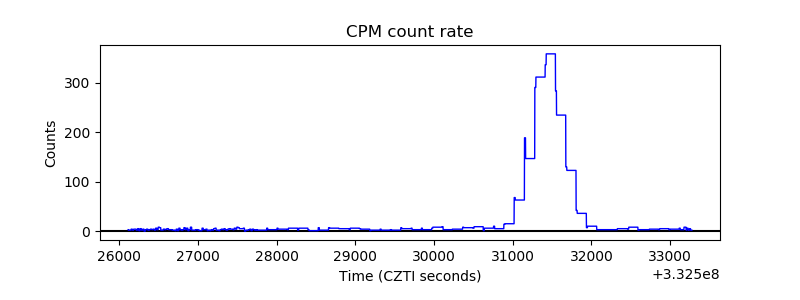 |
| CZT Counter | 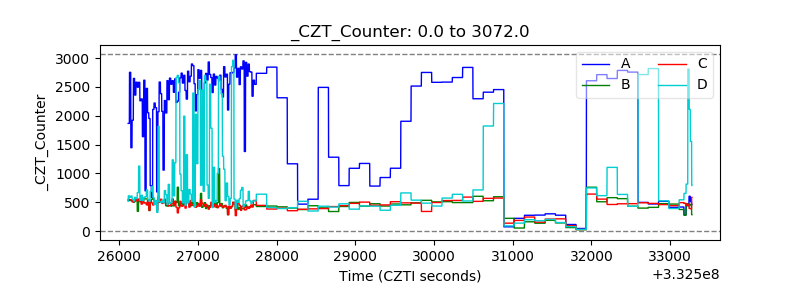 |
| +2.5 Volts monitor |  |
| +5 Volts monitor | 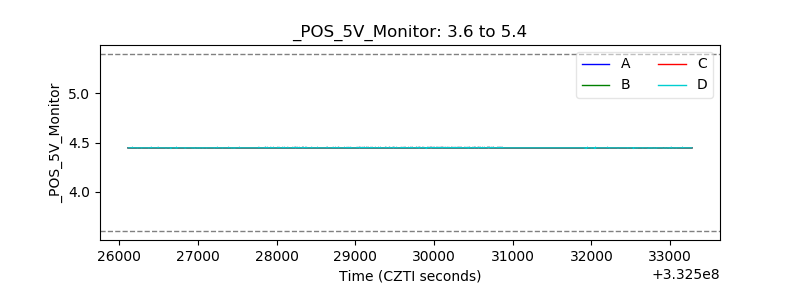 |
| _ROLL_ROT | 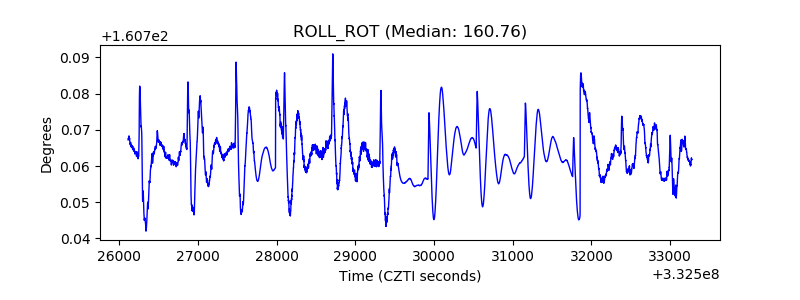 |
| _Roll_DEC | 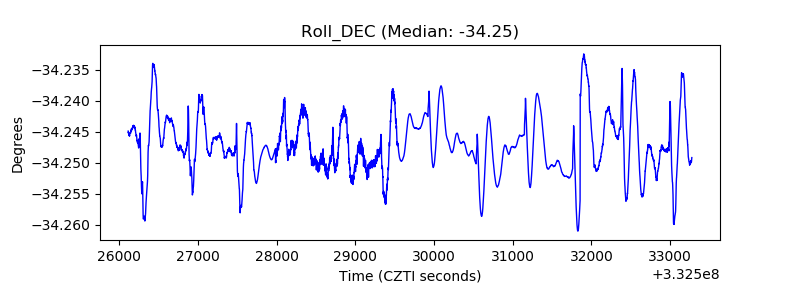 |
| _Roll_RA | 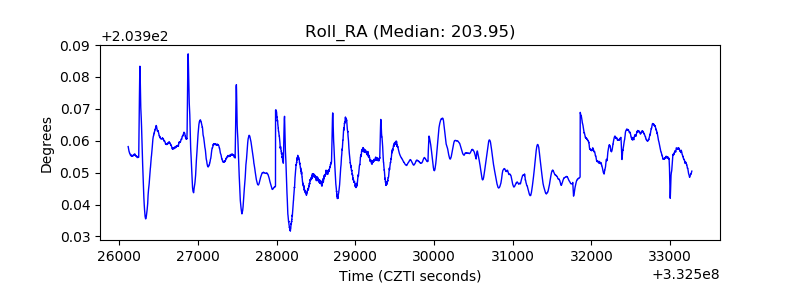 |
| Veto Counter | 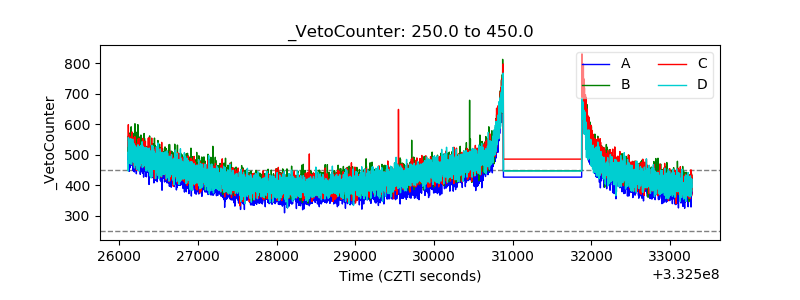 |