| Param | Original file | Final file |
|---|---|---|
| Filename | modeM0/AS1A07_068T01_9000003760_25942cztM0_level2.evt | modeM0/AS1A07_068T01_9000003760_25942cztM0_level2_quad_clean.evt |
| Size (bytes) | 593,830,080 | 93,856,320 |
| Size | 566.3 MB | 89.5 MB |
| Events in quadrant A | 4,308,764 | 584,421 |
| Events in quadrant B | 3,297,192 | 644,597 |
| Events in quadrant C | 3,216,198 | 612,845 |
| Events in quadrant D | 6,698,710 | 523,725 |
| Mode M0 | |||
|---|---|---|---|
| Quadrant | BADHDUFLAG | Total packets | Discarded packets |
| A | 0 | 17301 | 0 |
| B | 0 | 14205 | 0 |
| C | 0 | 14034 | 0 |
| D | 0 | 24539 | 0 |
| Mode M9 | |||
|---|---|---|---|
| Quadrant | BADHDUFLAG | Total packets | Discarded packets |
| A | 0 | 6 | 0 |
| B | 0 | 6 | 0 |
| C | 0 | 6 | 0 |
| D | 0 | 6 | 0 |
| Quadrant | Total seconds | Saturated seconds | Saturation percentage |
|---|---|---|---|
| A | 6831 | 513 | 7.509881% |
| B | 6832 | 33 | 0.483021% |
| C | 6832 | 52 | 0.761124% |
| D | 6832 | 1078 | 15.778689% |
Noise dominated data is calculated using 1-second bins in cleaned event files. If a bin has >2000 counts, and if more than 50% of those come from <1% of pixels, then it is considered to be noise-dominated and hence unusable.
| Quadrant | # 1 sec bins | Bins with >0 counts | Bins with >2000 counts | High rate bins dominated by noise | Noise dominated (total time) | Noise dominated (detector-on time) | Marked lightcurve |
|---|---|---|---|---|---|---|---|
| A | 7486 | 6832 | 488 | 488 | 6.52% | 7.14% | 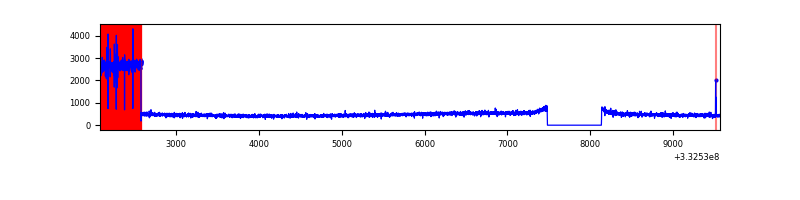 |
| B | 7487 | 6833 | 3 | 3 | 0.04% | 0.04% | 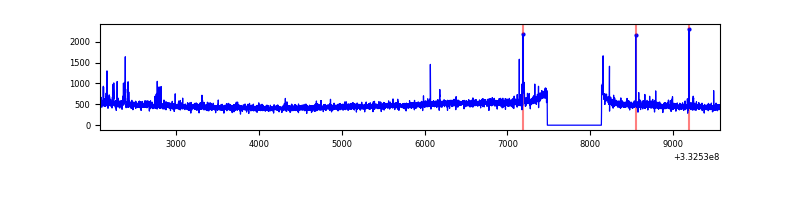 |
| C | 7487 | 6833 | 0 | 0 | 0.00% | 0.00% |  |
| D | 7487 | 6833 | 921 | 921 | 12.30% | 13.48% | 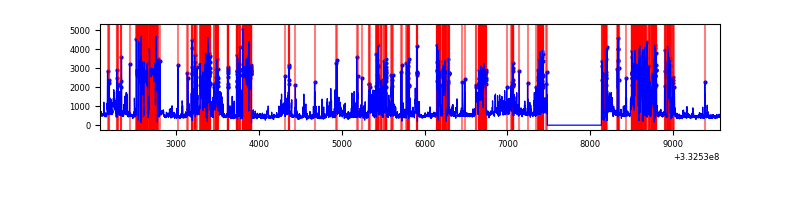 |
Top three noisy pixels from each quadrant. If the there are fewer than three noisy pixels in the level2.evt file, extra rows are filled as -1
| Pixel properties | Quadrant properties | ||||||
|---|---|---|---|---|---|---|---|
| Quadrant | DetID | PixID | Counts | Sigma | Mean | Median | Sigma |
| A | 0 | 13 | 1283000 | 8105.85 | 784 | 767 | 158.2 |
| A | 13 | 254 | 9566 | 55.62 | 784 | 767 | 158.2 |
| A | 3 | 137 | 7324 | 41.45 | 784 | 767 | 158.2 |
| B | 15 | 33 | 39128 | 243.04 | 822 | 802 | 157.7 |
| B | 0 | 190 | 20667 | 125.97 | 822 | 802 | 157.7 |
| B | 12 | 111 | 19227 | 116.84 | 822 | 802 | 157.7 |
| C | 14 | 238 | 126175 | 678.39 | 786 | 790 | 184.8 |
| C | 3 | 233 | 21182 | 110.33 | 786 | 790 | 184.8 |
| C | 13 | 61 | 5629 | 26.18 | 786 | 790 | 184.8 |
| D | 1 | 52 | 3871538 | 22175.11 | 724 | 705 | 174.6 |
| D | 12 | 233 | 59607 | 337.44 | 724 | 705 | 174.6 |
| D | 2 | 234 | 25961 | 144.69 | 724 | 705 | 174.6 |
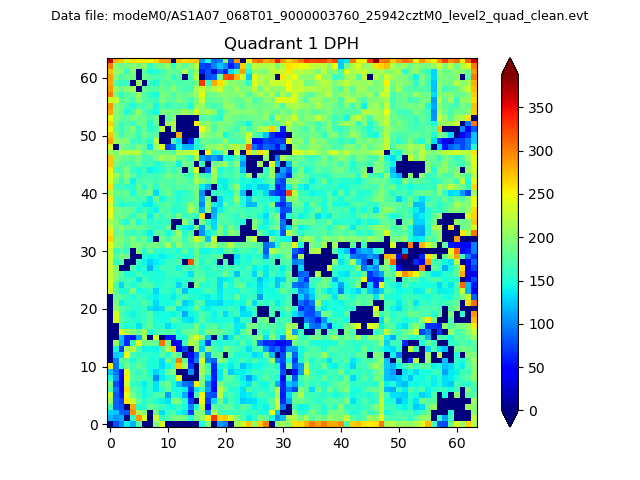
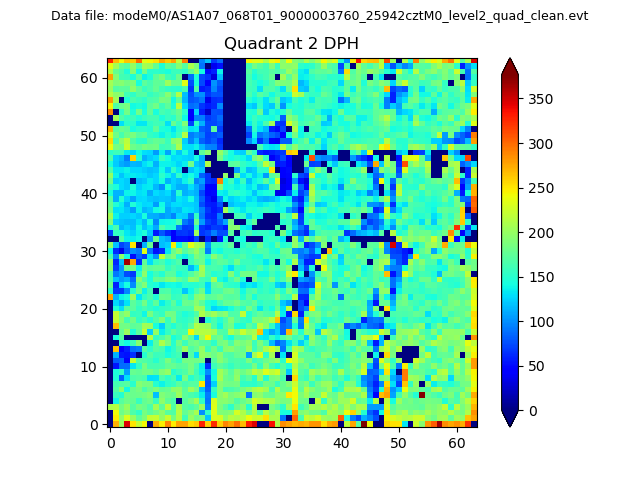
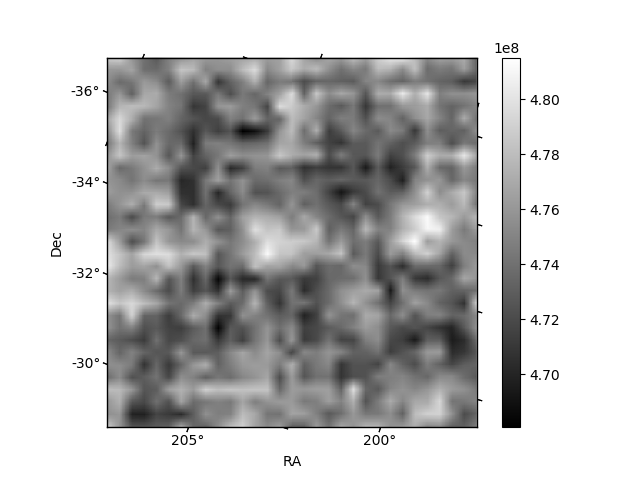
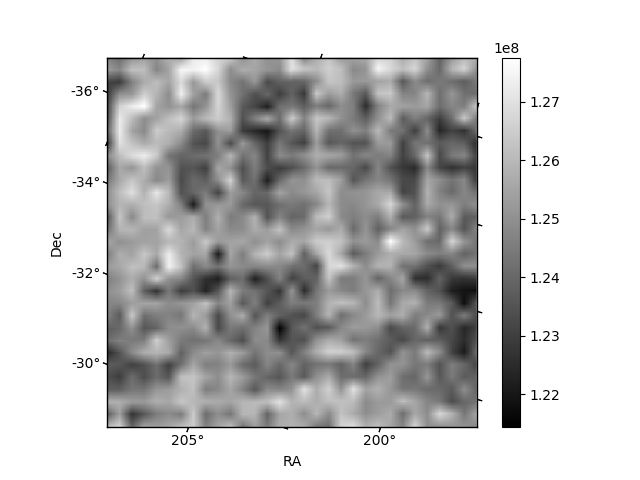
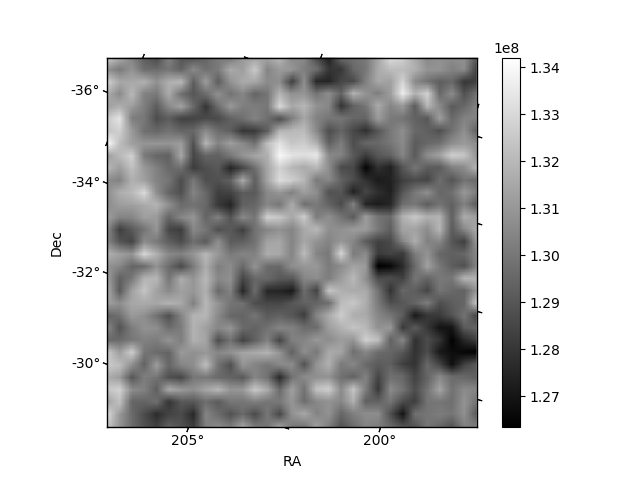
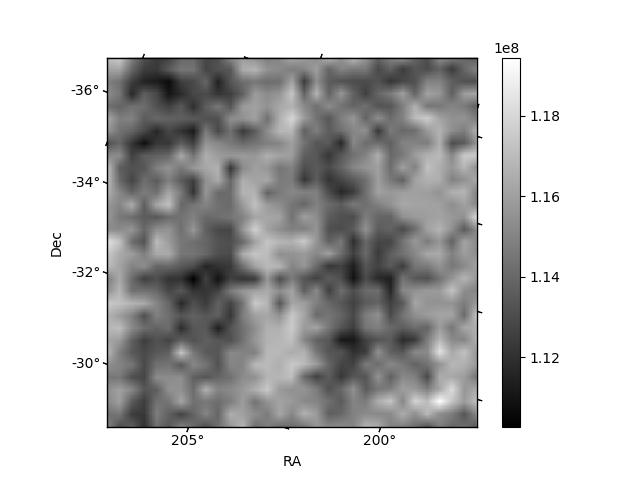
Histogram calculated using DETX and DETY for each event in the final _common_clean file
| Quadrant A | 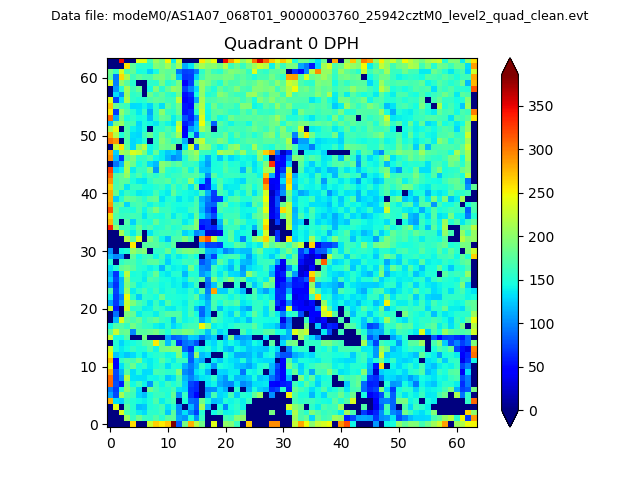 |
 |
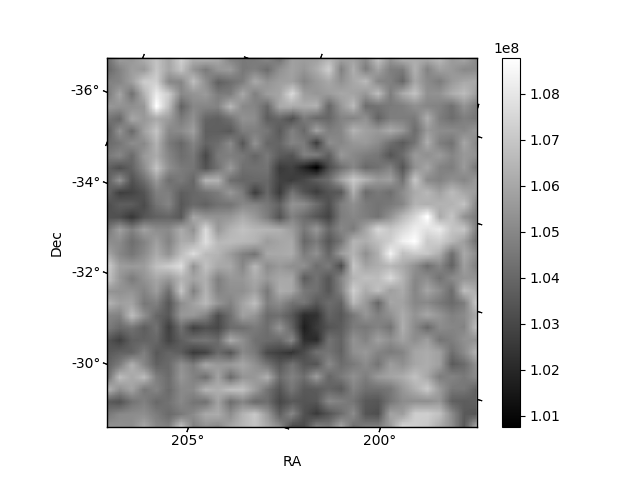
Quadrant B |
|---|---|---|---|
| Quadrant D | 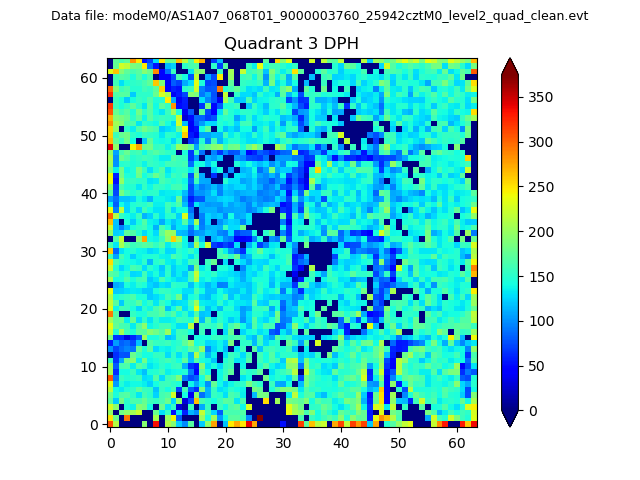 |
 |
Quadrant C |
| Plot type | Count rate plots | Images |
|---|---|---|
| Comparison with Poisson distribution Blue bars denote a histogram of data divided into 1 sec bins. Red curve is a Poisson curve with rate = median count rate of data. |
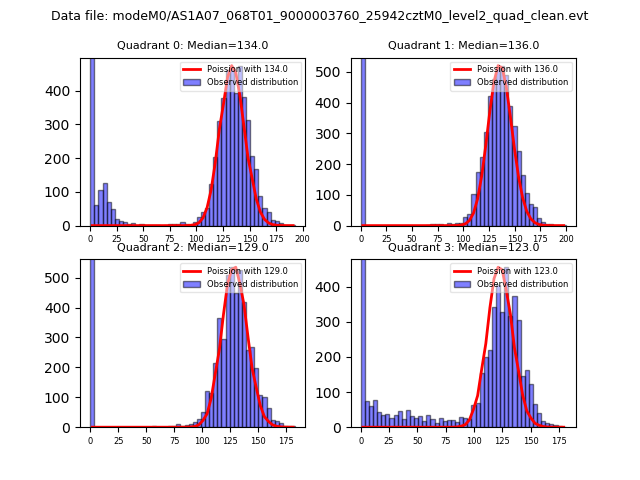 |
 |
| Quadrant-wise count rates Data is divided into 100 sec bins |
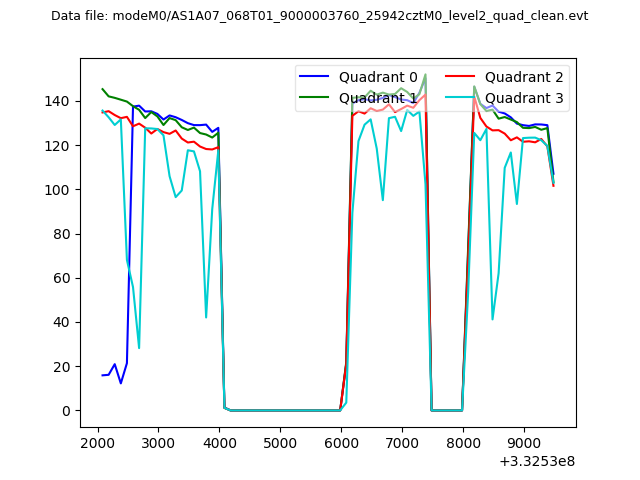 |
|
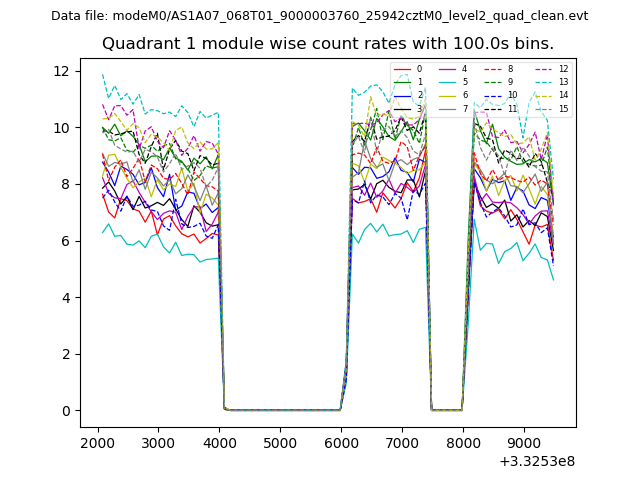
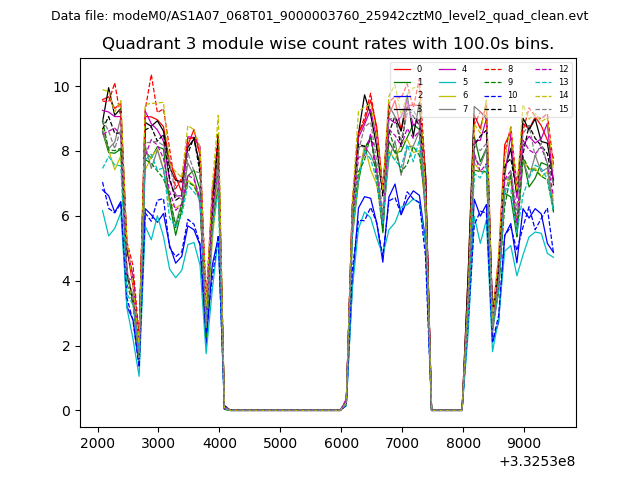
| Module-wise count rates for Quadrant A Data is divided into 100 sec bins |
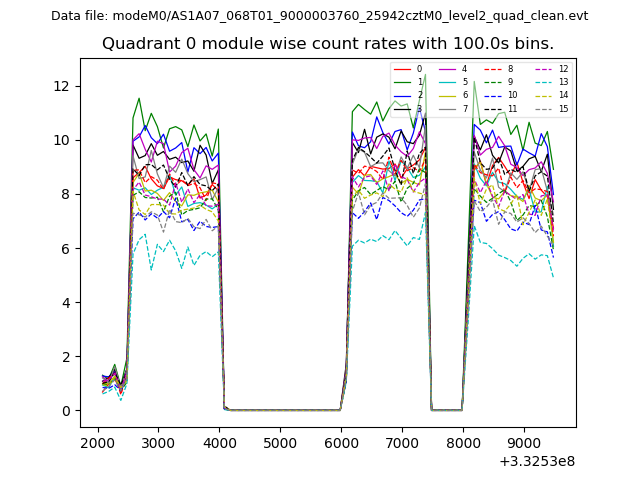 |
 |
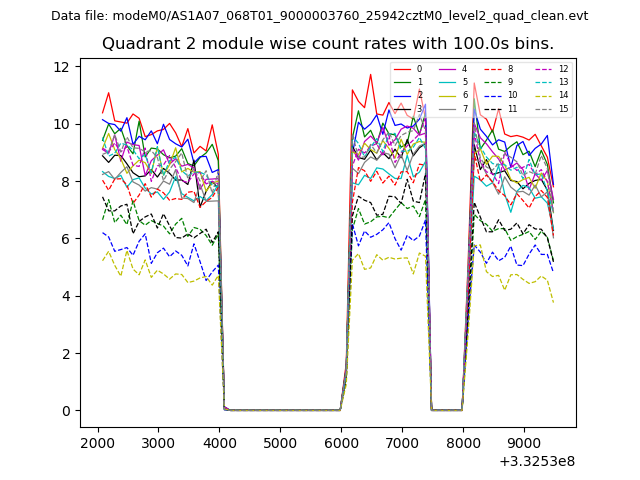
| Module-wise count rates for Quadrant B Data is divided into 100 sec bins |
 |
 |
| Module-wise count rates for Quadrant C Data is divided into 100 sec bins |
 |
 |
| Module-wise count rates for Quadrant D Data is divided into 100 sec bins |
 |
 |
| Parameter | Plot |
|---|---|
| CZT HV Monitor | 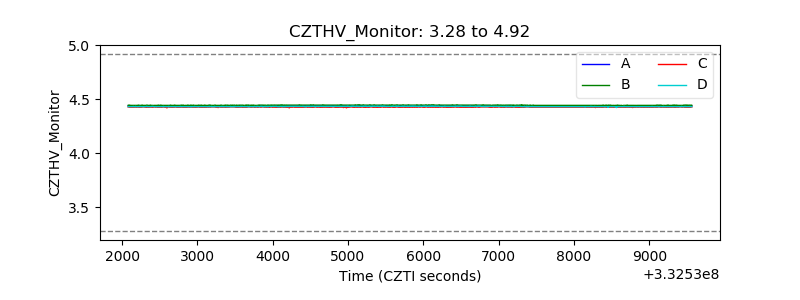 |
| D_VDD | 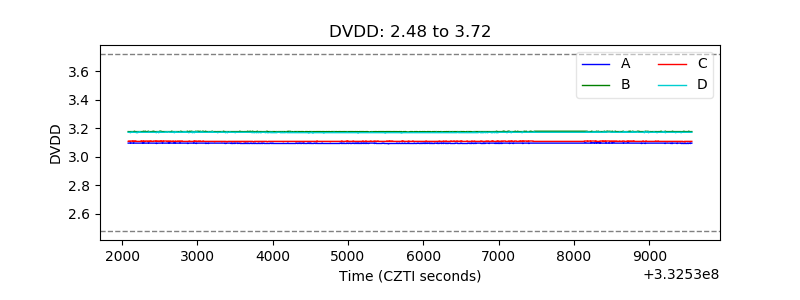 |
| Temperature 1 | 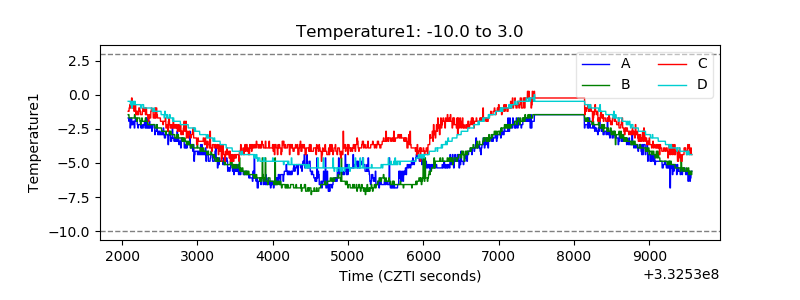 |
| Veto HV Monitor | 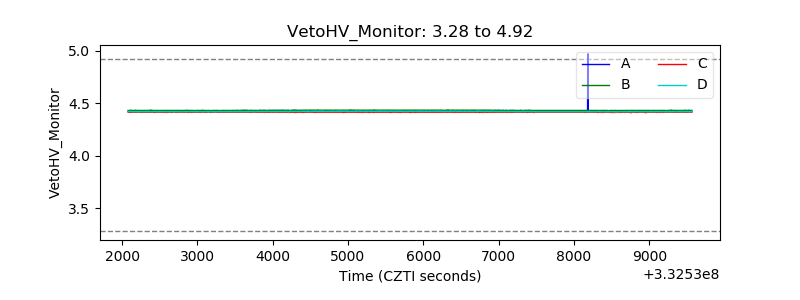 |
| Veto LLD | 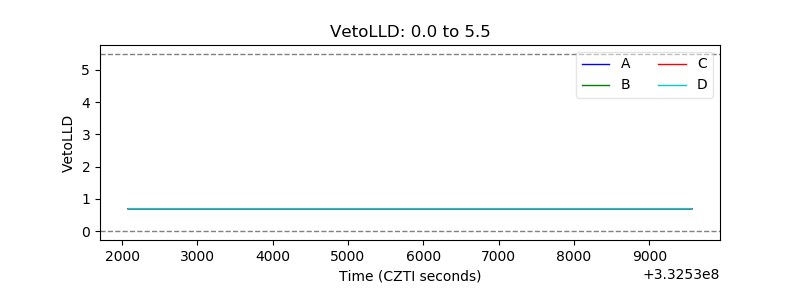 |
| Alpha Counter | 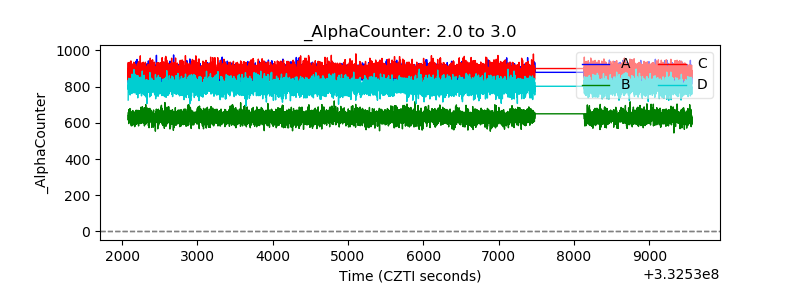 |
| _CPM_Rate | 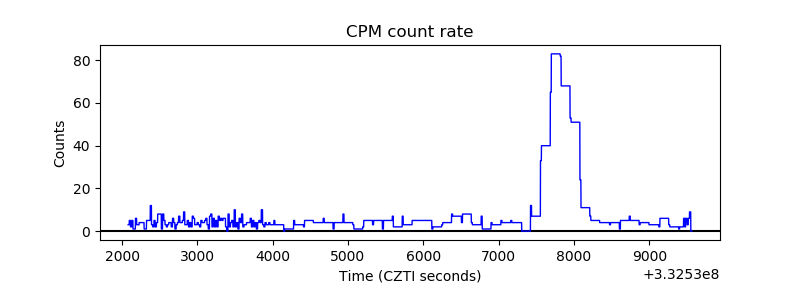 |
| CZT Counter | 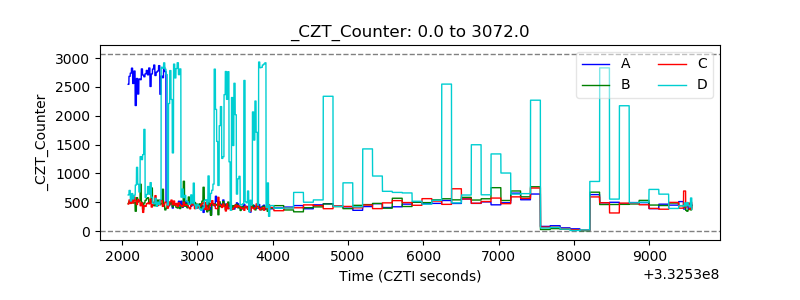 |
| +2.5 Volts monitor |  |
| +5 Volts monitor | 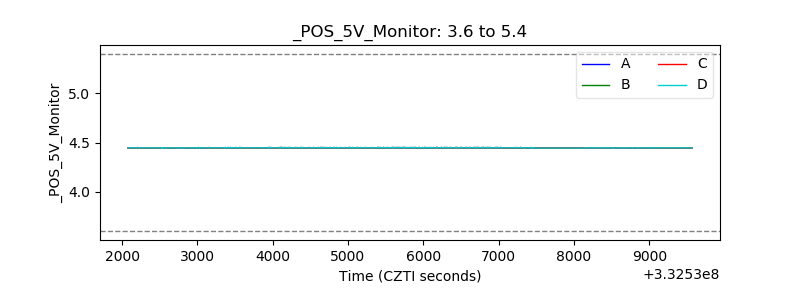 |
| _ROLL_ROT | 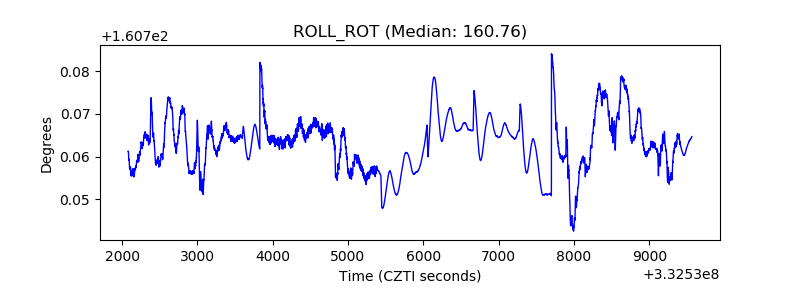 |
| _Roll_DEC | 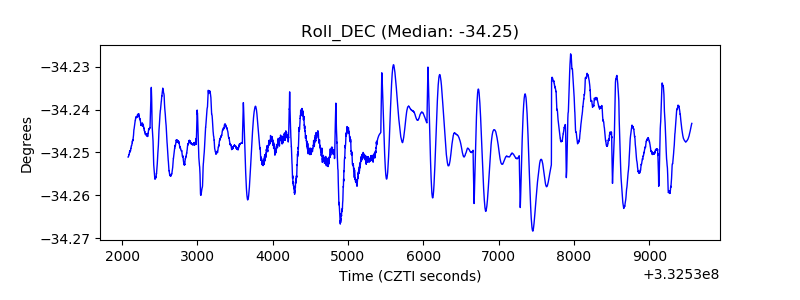 |
| _Roll_RA | 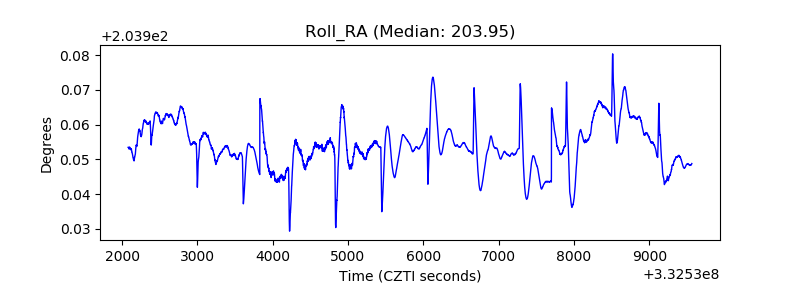 |
| Veto Counter | 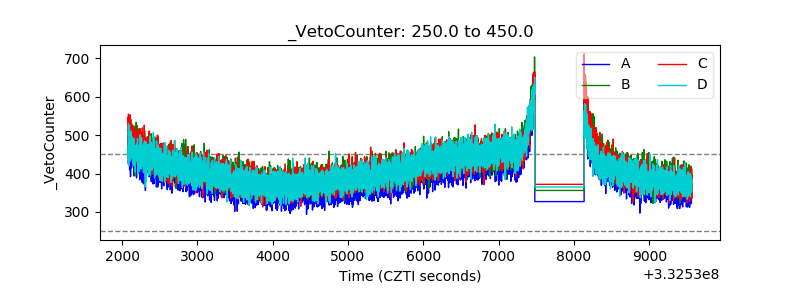 |