| Param | Original file | Final file |
|---|---|---|
| Filename | modeM0/AS1A07_068T01_9000003760_25943cztM0_level2.evt | modeM0/AS1A07_068T01_9000003760_25943cztM0_level2_quad_clean.evt |
| Size (bytes) | 559,264,320 | 110,027,520 |
| Size | 533.4 MB | 104.9 MB |
| Events in quadrant A | 4,148,620 | 722,237 |
| Events in quadrant B | 3,690,064 | 730,106 |
| Events in quadrant C | 3,590,657 | 691,663 |
| Events in quadrant D | 4,997,270 | 664,267 |
| Mode M0 | |||
|---|---|---|---|
| Quadrant | BADHDUFLAG | Total packets | Discarded packets |
| A | 0 | 17258 | 0 |
| B | 0 | 15899 | 0 |
| C | 0 | 15610 | 0 |
| D | 0 | 20143 | 0 |
| Mode M9 | |||
|---|---|---|---|
| Quadrant | BADHDUFLAG | Total packets | Discarded packets |
| A | 0 | 9 | 0 |
| B | 0 | 9 | 0 |
| C | 0 | 9 | 0 |
| D | 0 | 9 | 0 |
| Quadrant | Total seconds | Saturated seconds | Saturation percentage |
|---|---|---|---|
| A | 7522 | 187 | 2.486041% |
| B | 7523 | 101 | 1.342550% |
| C | 7523 | 89 | 1.183039% |
| D | 7523 | 405 | 5.383491% |
Noise dominated data is calculated using 1-second bins in cleaned event files. If a bin has >2000 counts, and if more than 50% of those come from <1% of pixels, then it is considered to be noise-dominated and hence unusable.
| Quadrant | # 1 sec bins | Bins with >0 counts | Bins with >2000 counts | High rate bins dominated by noise | Noise dominated (total time) | Noise dominated (detector-on time) | Marked lightcurve |
|---|---|---|---|---|---|---|---|
| A | 8507 | 7524 | 101 | 101 | 1.19% | 1.34% | 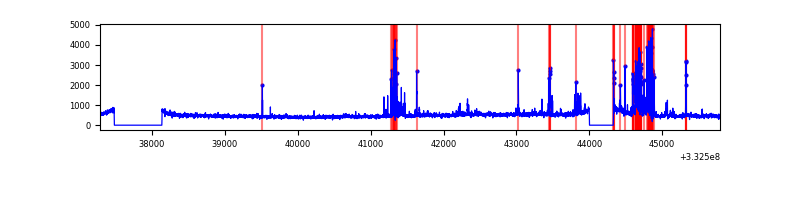 |
| B | 8508 | 7525 | 3 | 3 | 0.04% | 0.04% | 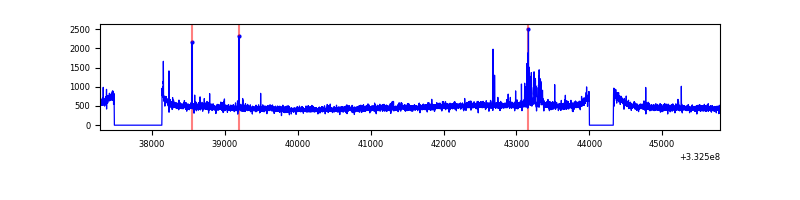 |
| C | 8508 | 7525 | 0 | 0 | 0.00% | 0.00% | 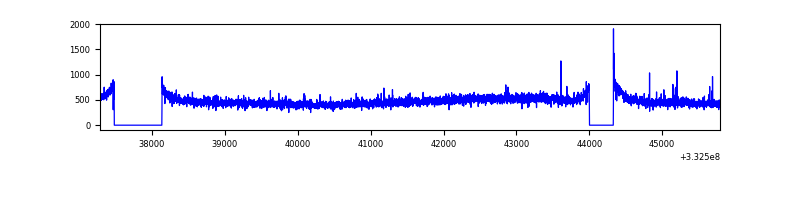 |
| D | 8508 | 7525 | 306 | 306 | 3.60% | 4.07% | 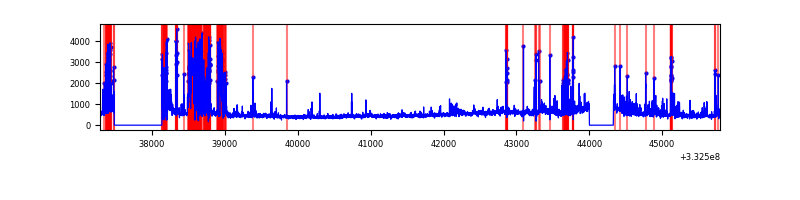 |
Top three noisy pixels from each quadrant. If the there are fewer than three noisy pixels in the level2.evt file, extra rows are filled as -1
| Pixel properties | Quadrant properties | ||||||
|---|---|---|---|---|---|---|---|
| Quadrant | DetID | PixID | Counts | Sigma | Mean | Median | Sigma |
| A | 0 | 13 | 572279 | 3076.89 | 920 | 901 | 185.7 |
| A | 12 | 16 | 25402 | 131.94 | 920 | 901 | 185.7 |
| A | 13 | 254 | 11397 | 56.52 | 920 | 901 | 185.7 |
| B | 0 | 190 | 52461 | 289.82 | 914 | 891 | 177.9 |
| B | 0 | 245 | 29274 | 159.51 | 914 | 891 | 177.9 |
| B | 12 | 111 | 21777 | 117.38 | 914 | 891 | 177.9 |
| C | 14 | 238 | 140659 | 681.49 | 872 | 876 | 205.1 |
| C | 3 | 233 | 51042 | 244.58 | 872 | 876 | 205.1 |
| C | 13 | 61 | 6157 | 25.75 | 872 | 876 | 205.1 |
| D | 1 | 52 | 1675565 | 8126.0 | 861 | 839 | 206.1 |
| D | 12 | 233 | 35783 | 169.55 | 861 | 839 | 206.1 |
| D | 2 | 234 | 30662 | 144.71 | 861 | 839 | 206.1 |
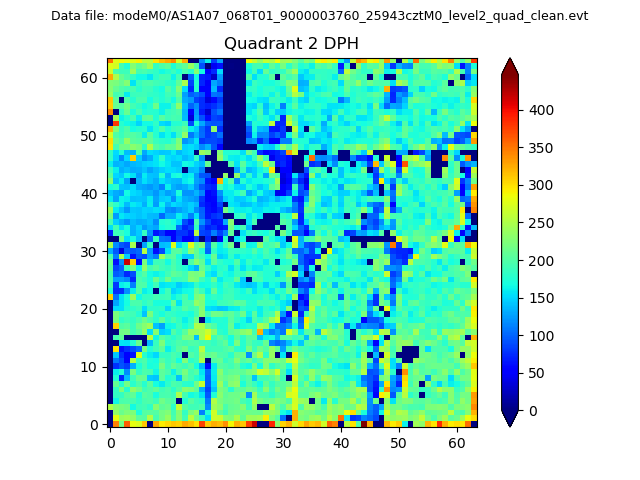
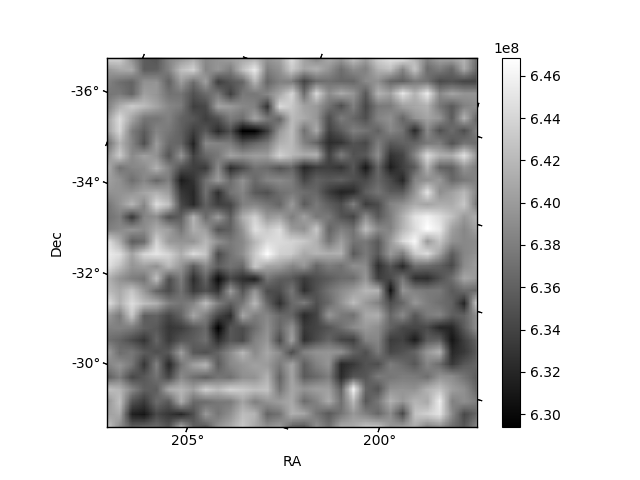
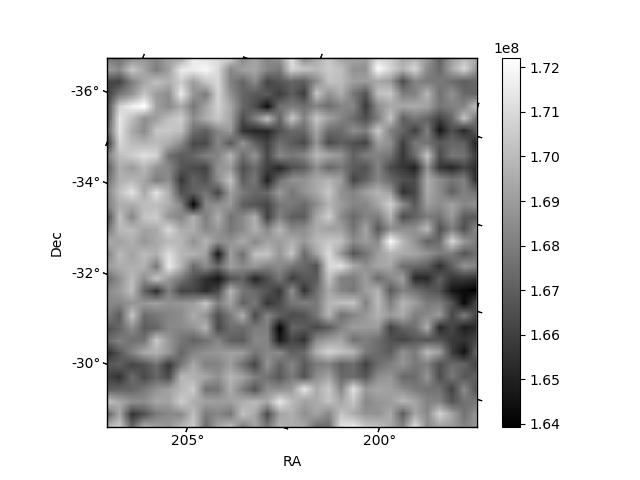
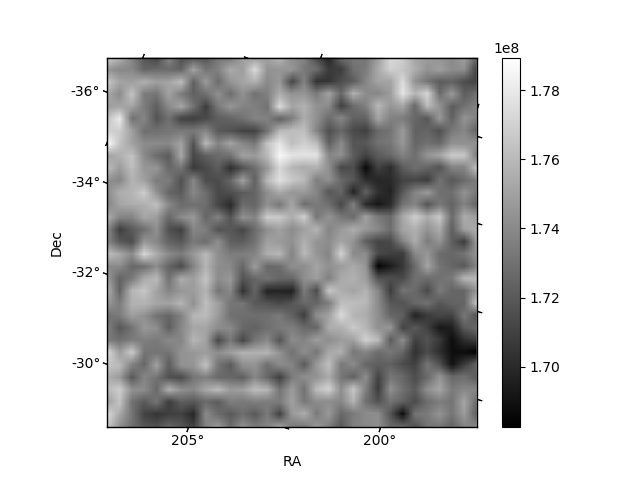
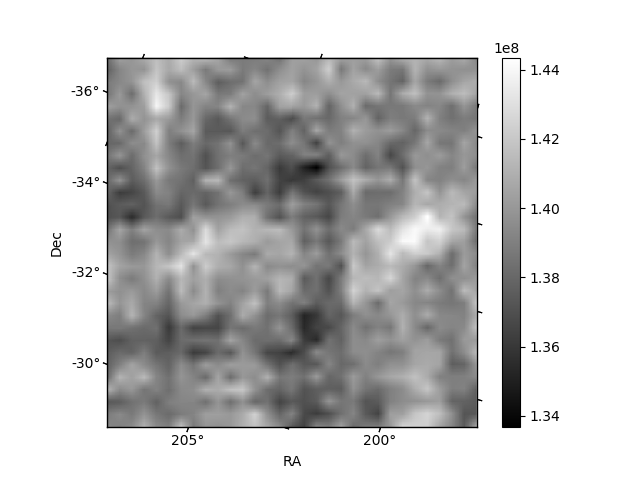
Histogram calculated using DETX and DETY for each event in the final _common_clean file
| Quadrant A | 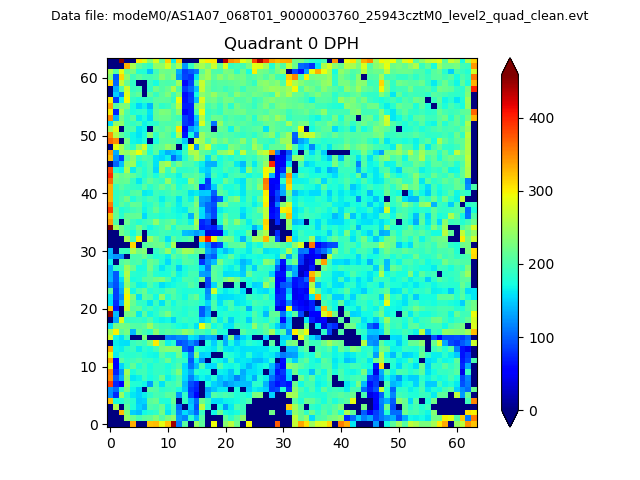 |
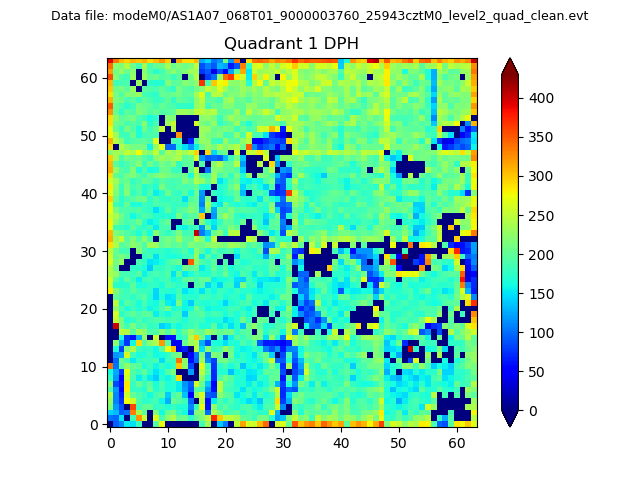 |
Quadrant B |
|---|---|---|---|
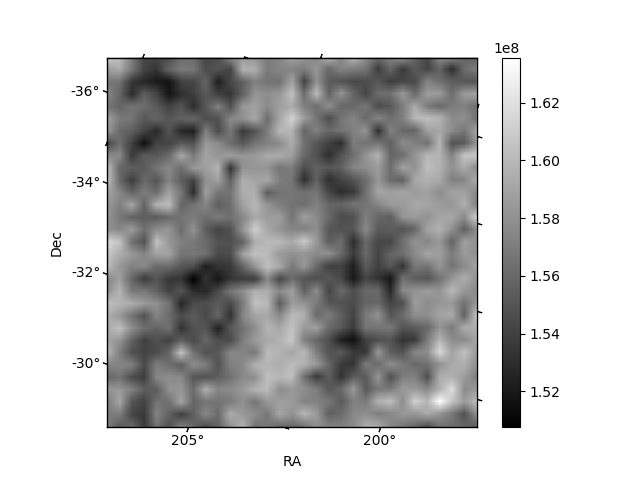
| Quadrant D | 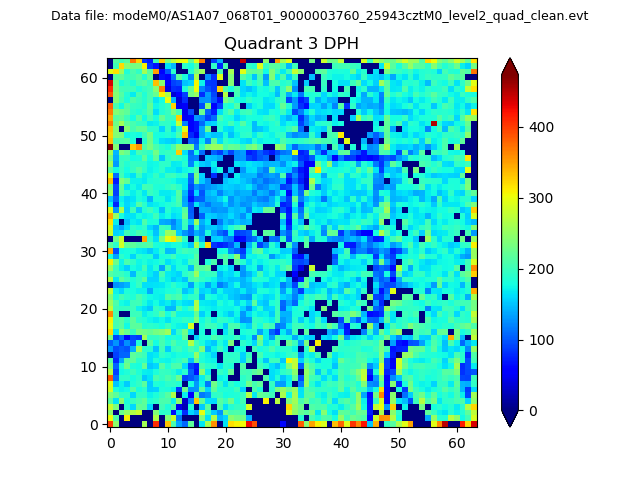 |
 |
Quadrant C |
| Plot type | Count rate plots | Images |
|---|---|---|
| Comparison with Poisson distribution Blue bars denote a histogram of data divided into 1 sec bins. Red curve is a Poisson curve with rate = median count rate of data. |
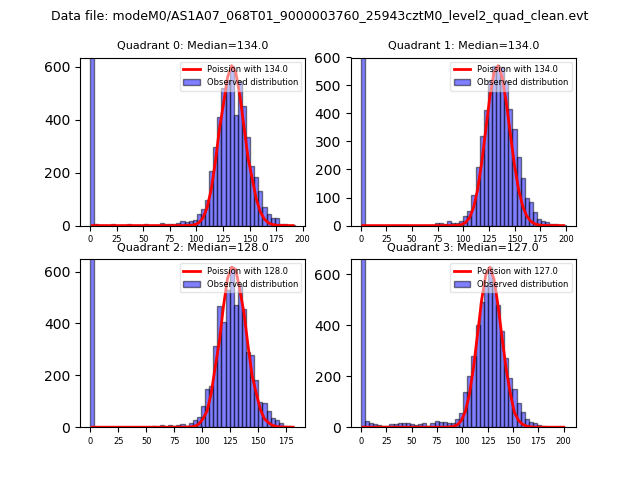 |
 |
| Quadrant-wise count rates Data is divided into 100 sec bins |
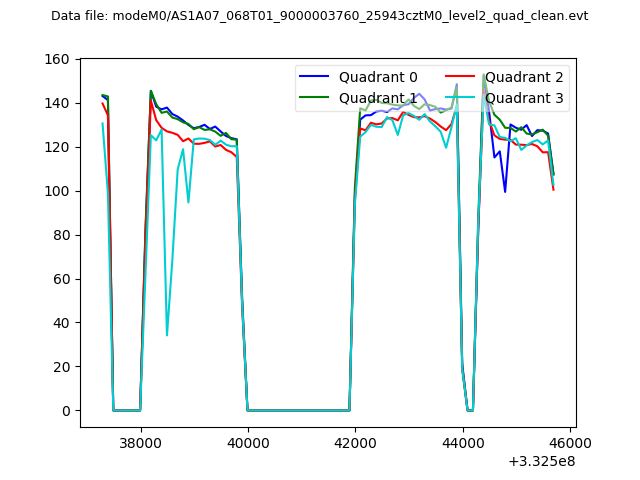 |
|
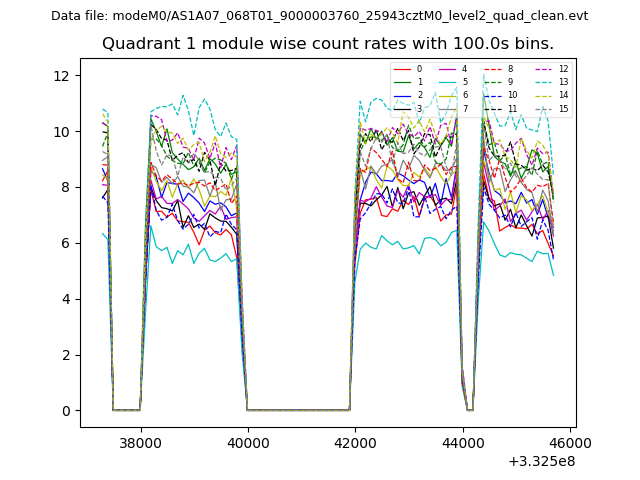
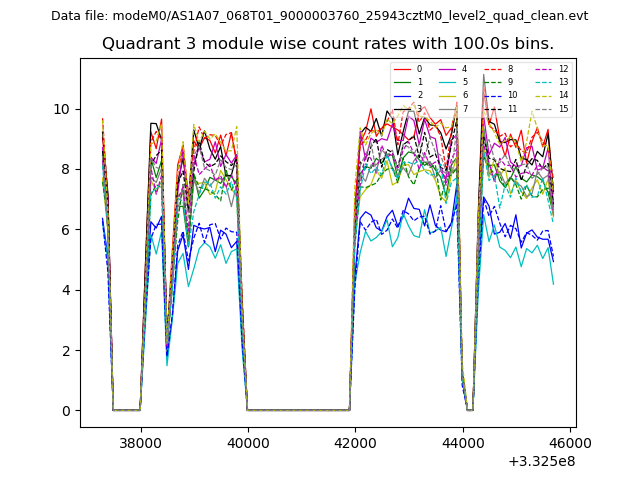
| Module-wise count rates for Quadrant A Data is divided into 100 sec bins |
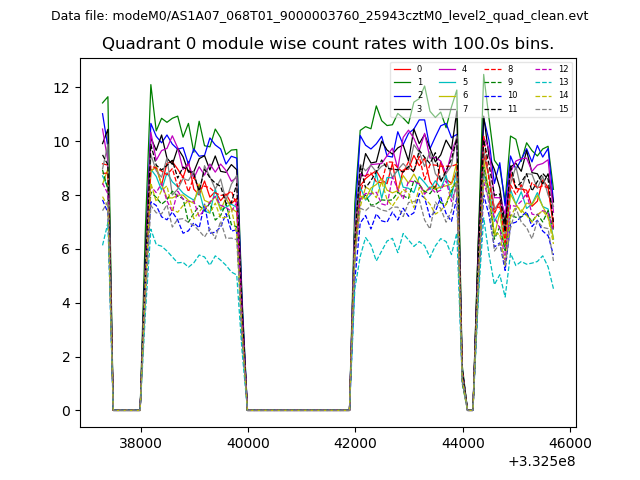 |
 |
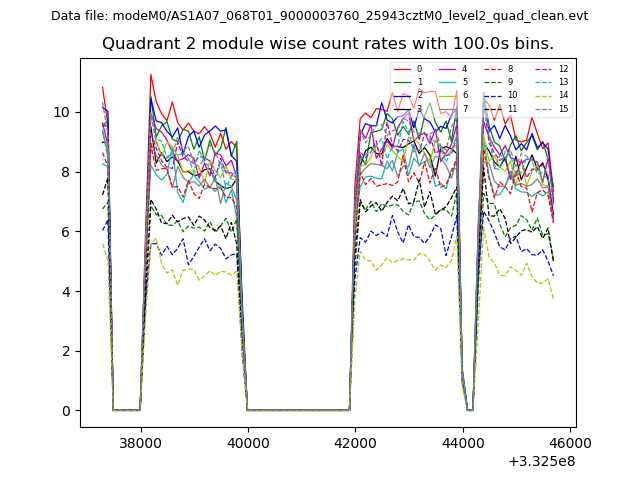
| Module-wise count rates for Quadrant B Data is divided into 100 sec bins |
 |
 |
| Module-wise count rates for Quadrant C Data is divided into 100 sec bins |
 |
 |
| Module-wise count rates for Quadrant D Data is divided into 100 sec bins |
 |
 |
| Parameter | Plot |
|---|---|
| CZT HV Monitor | 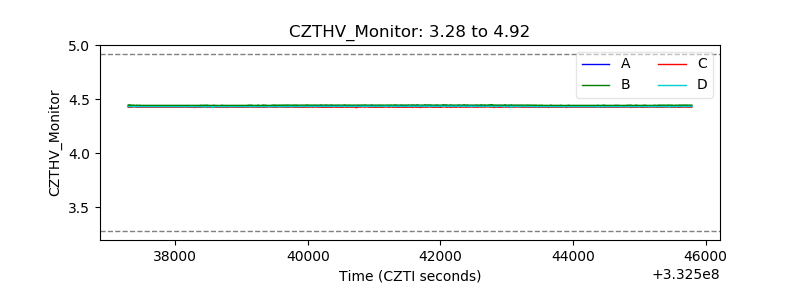 |
| D_VDD | 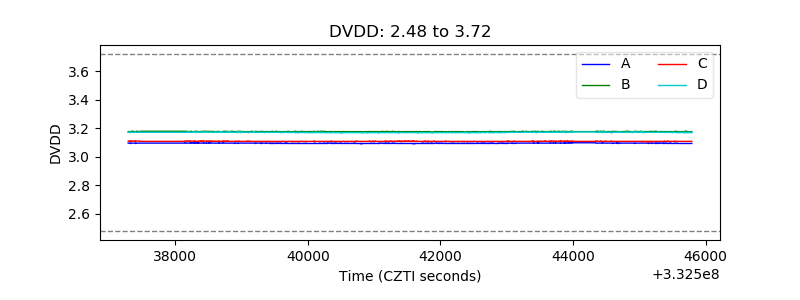 |
| Temperature 1 | 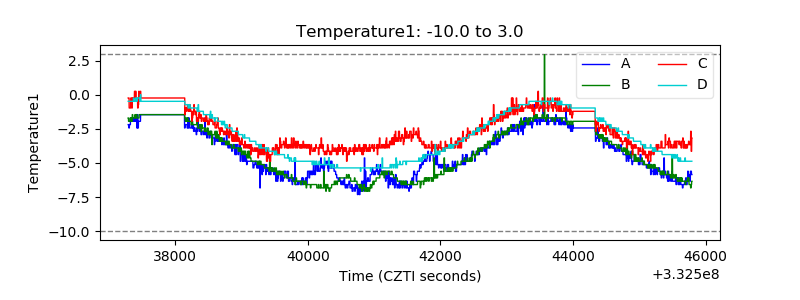 |
| Veto HV Monitor | 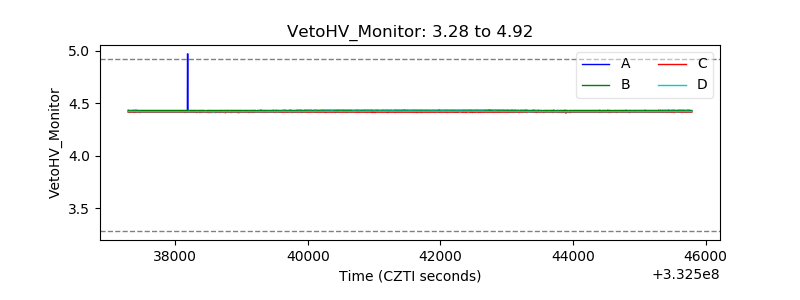 |
| Veto LLD |  |
| Alpha Counter | 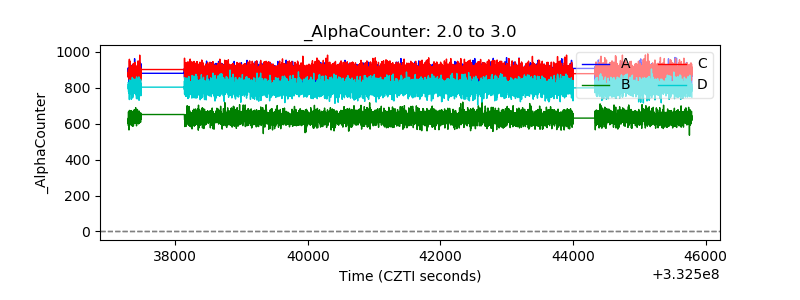 |
| _CPM_Rate | 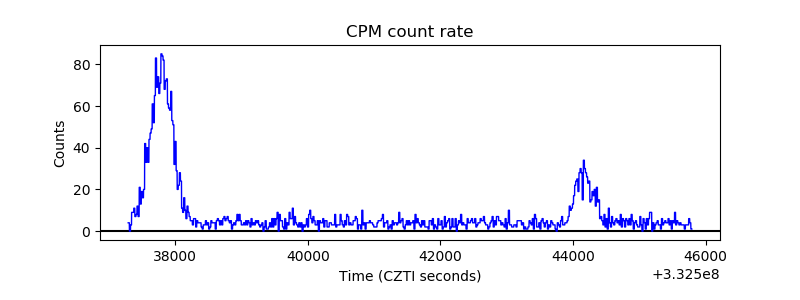 |
| CZT Counter | 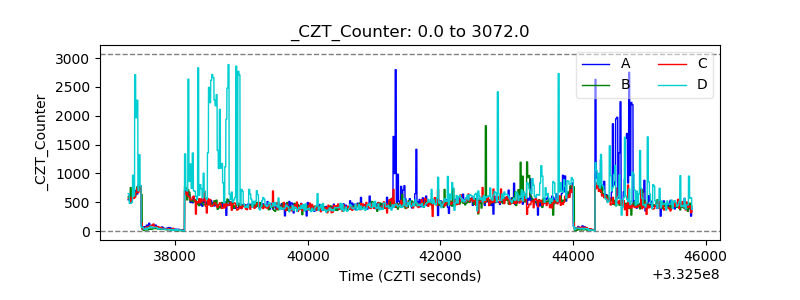 |
| +2.5 Volts monitor |  |
| +5 Volts monitor |  |
| _ROLL_ROT | 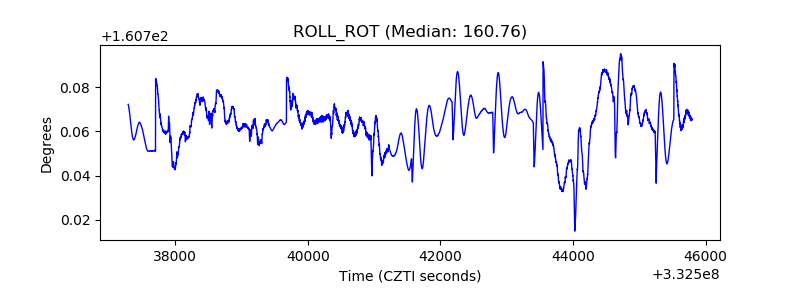 |
| _Roll_DEC | 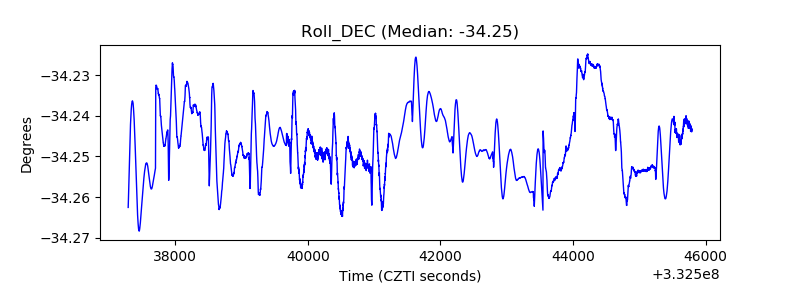 |
| _Roll_RA | 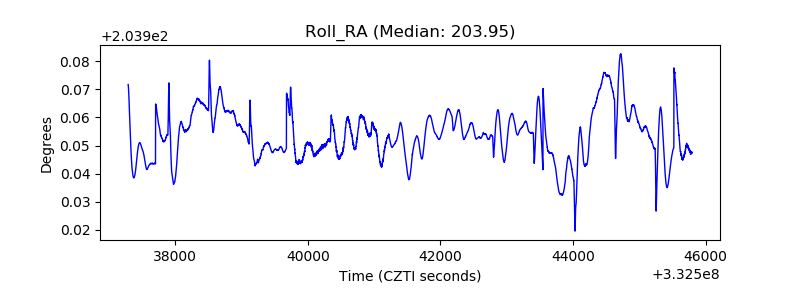 |
| Veto Counter | 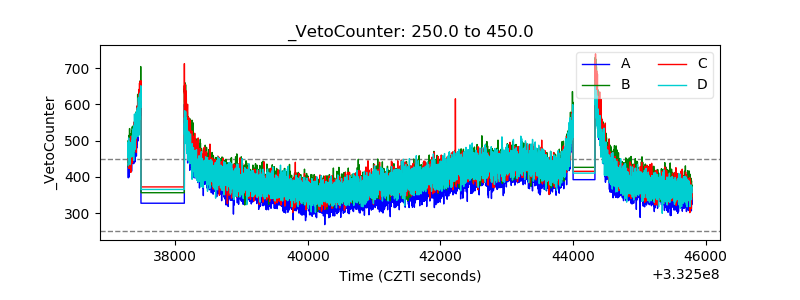 |