| Param | Original file | Final file |
|---|---|---|
| Filename | modeM0/AS1A07_068T01_9000003760_25944cztM0_level2.evt | modeM0/AS1A07_068T01_9000003760_25944cztM0_level2_quad_clean.evt |
| Size (bytes) | 561,991,680 | 105,891,840 |
| Size | 536.0 MB | 101.0 MB |
| Events in quadrant A | 4,550,182 | 669,864 |
| Events in quadrant B | 3,774,607 | 689,658 |
| Events in quadrant C | 3,798,363 | 653,441 |
| Events in quadrant D | 4,371,339 | 655,178 |
| Mode M0 | |||
|---|---|---|---|
| Quadrant | BADHDUFLAG | Total packets | Discarded packets |
| A | 0 | 18597 | 0 |
| B | 0 | 16247 | 0 |
| C | 0 | 16204 | 0 |
| D | 0 | 18255 | 0 |
| Mode M9 | |||
|---|---|---|---|
| Quadrant | BADHDUFLAG | Total packets | Discarded packets |
| A | 0 | 7 | 0 |
| B | 0 | 7 | 0 |
| C | 0 | 7 | 0 |
| D | 0 | 7 | 0 |
| Quadrant | Total seconds | Saturated seconds | Saturation percentage |
|---|---|---|---|
| A | 7739 | 339 | 4.380411% |
| B | 7740 | 101 | 1.304910% |
| C | 7739 | 113 | 1.460137% |
| D | 7739 | 156 | 2.015764% |
Noise dominated data is calculated using 1-second bins in cleaned event files. If a bin has >2000 counts, and if more than 50% of those come from <1% of pixels, then it is considered to be noise-dominated and hence unusable.
| Quadrant | # 1 sec bins | Bins with >0 counts | Bins with >2000 counts | High rate bins dominated by noise | Noise dominated (total time) | Noise dominated (detector-on time) | Marked lightcurve |
|---|---|---|---|---|---|---|---|
| A | 8439 | 7741 | 217 | 217 | 2.57% | 2.80% | 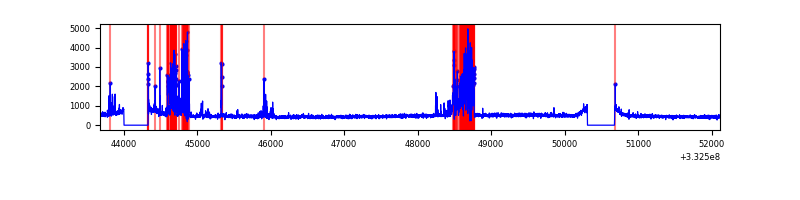 |
| B | 8440 | 7742 | 0 | 0 | 0.00% | 0.00% | 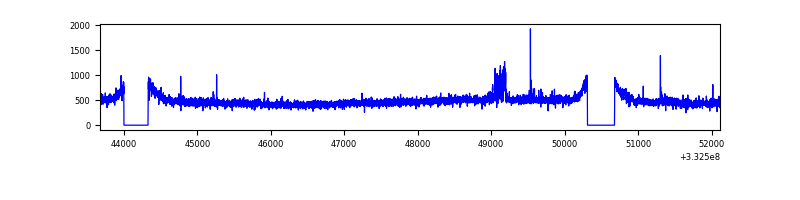 |
| C | 8439 | 7741 | 2 | 2 | 0.02% | 0.03% | 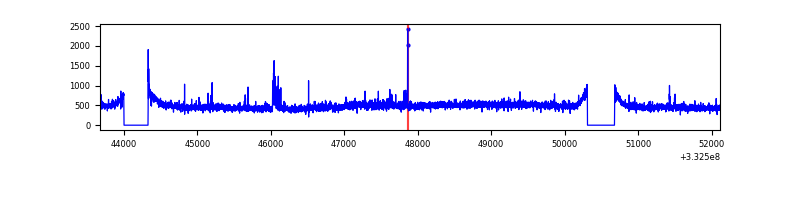 |
| D | 8439 | 7741 | 96 | 96 | 1.14% | 1.24% | 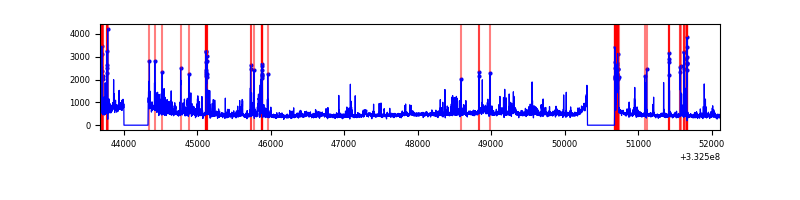 |
Top three noisy pixels from each quadrant. If the there are fewer than three noisy pixels in the level2.evt file, extra rows are filled as -1
| Pixel properties | Quadrant properties | ||||||
|---|---|---|---|---|---|---|---|
| Quadrant | DetID | PixID | Counts | Sigma | Mean | Median | Sigma |
| A | 0 | 13 | 941752 | 5015.85 | 931 | 911 | 187.6 |
| A | 12 | 16 | 16170 | 81.35 | 931 | 911 | 187.6 |
| A | 13 | 254 | 10751 | 52.46 | 931 | 911 | 187.6 |
| B | 0 | 190 | 56509 | 303.89 | 937 | 916 | 182.9 |
| B | 0 | 245 | 34635 | 184.32 | 937 | 916 | 182.9 |
| B | 12 | 111 | 22369 | 117.27 | 937 | 916 | 182.9 |
| C | 3 | 233 | 167261 | 791.31 | 894 | 896 | 210.2 |
| C | 14 | 238 | 142075 | 671.52 | 894 | 896 | 210.2 |
| C | 13 | 61 | 6193 | 25.2 | 894 | 896 | 210.2 |
| D | 1 | 52 | 886845 | 4080.64 | 904 | 880 | 217.1 |
| D | 12 | 233 | 53507 | 242.39 | 904 | 880 | 217.1 |
| D | 2 | 234 | 30632 | 137.03 | 904 | 880 | 217.1 |
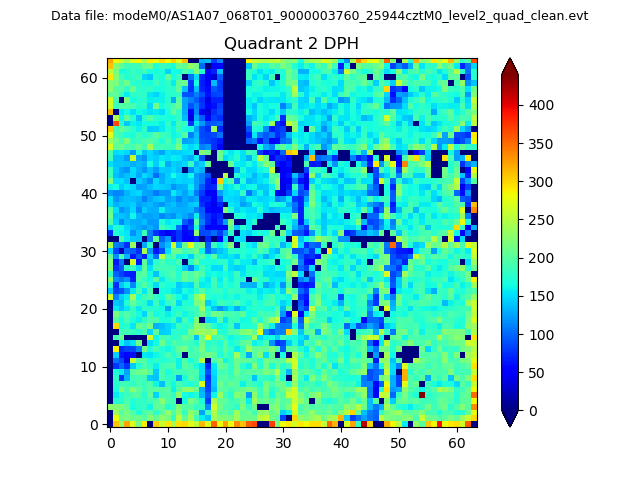
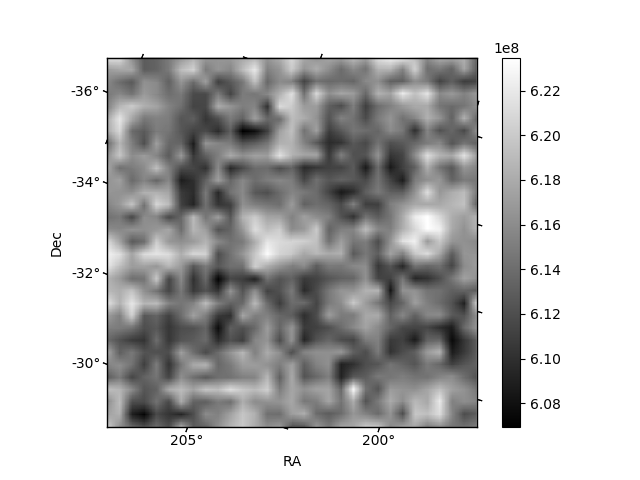
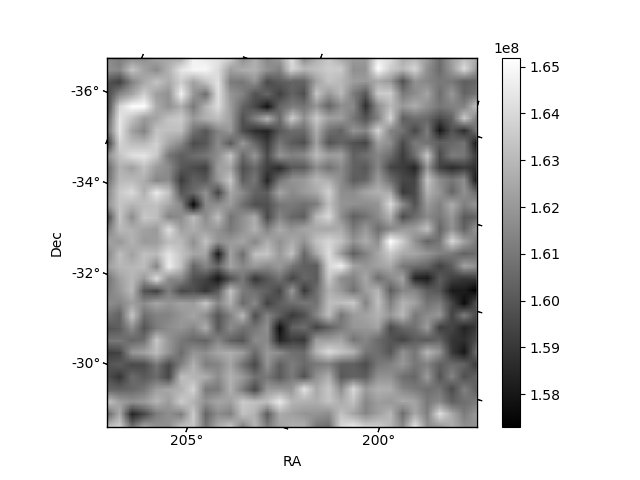
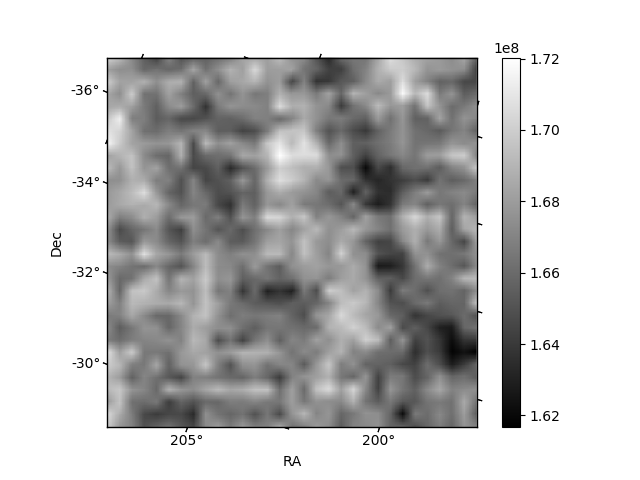
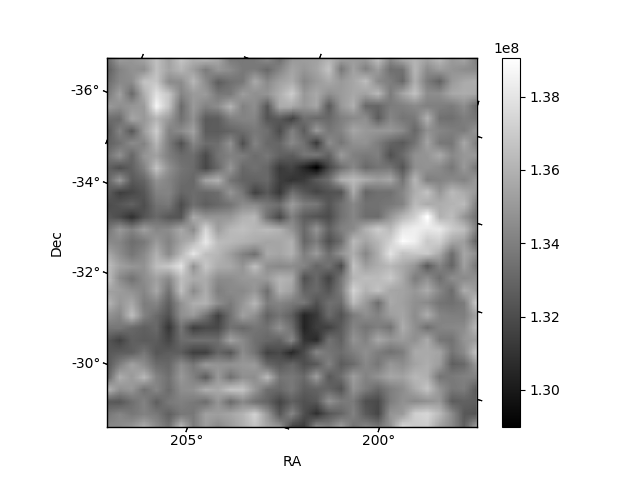
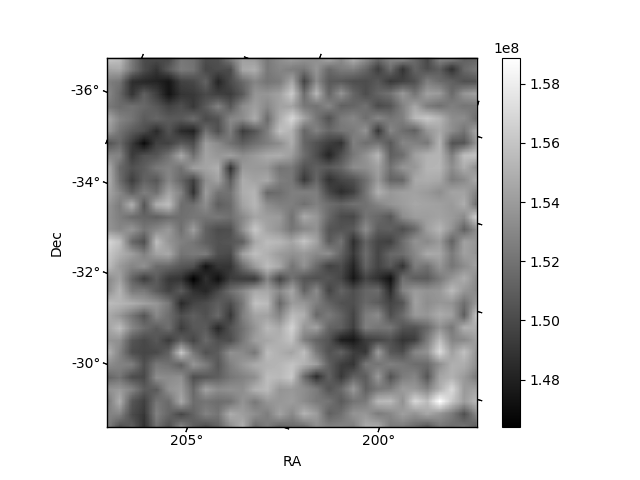
Histogram calculated using DETX and DETY for each event in the final _common_clean file
| Quadrant A | 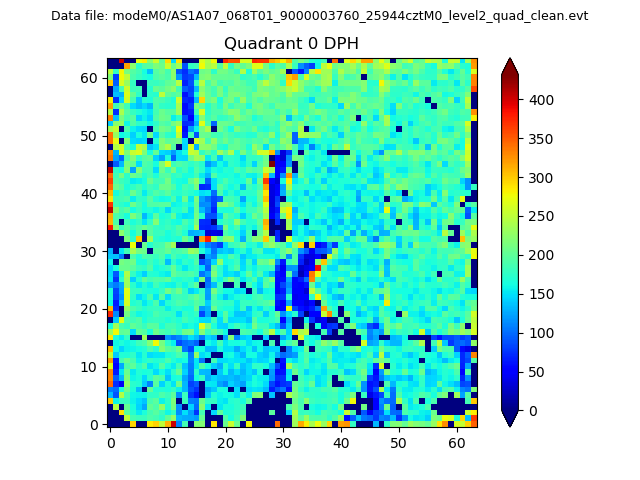 |
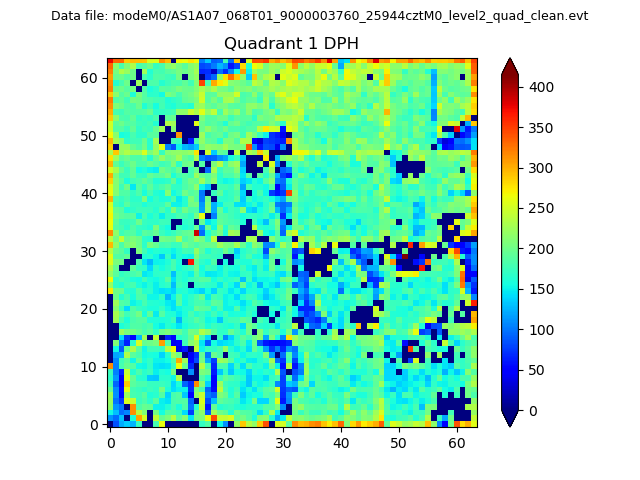 |
Quadrant B |
|---|---|---|---|
| Quadrant D | 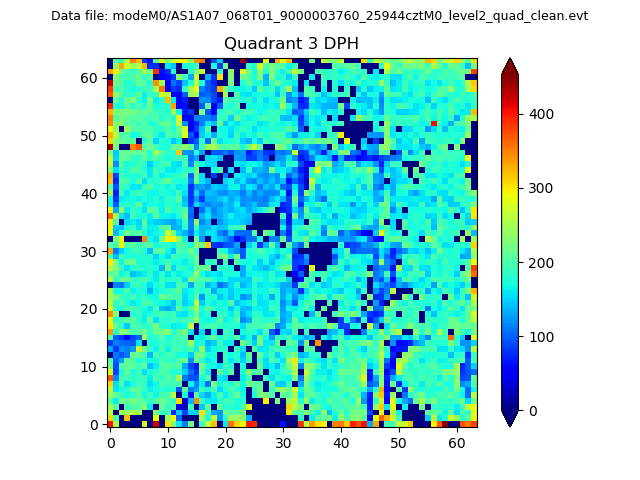 |
 |
Quadrant C |
| Plot type | Count rate plots | Images |
|---|---|---|
| Comparison with Poisson distribution Blue bars denote a histogram of data divided into 1 sec bins. Red curve is a Poisson curve with rate = median count rate of data. |
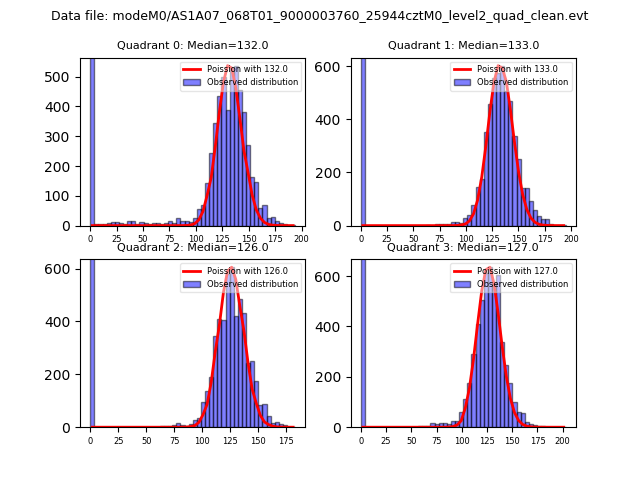 |
 |
| Quadrant-wise count rates Data is divided into 100 sec bins |
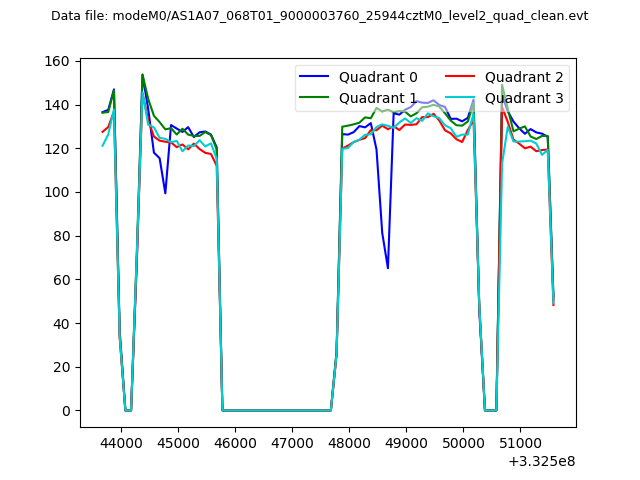 |
|
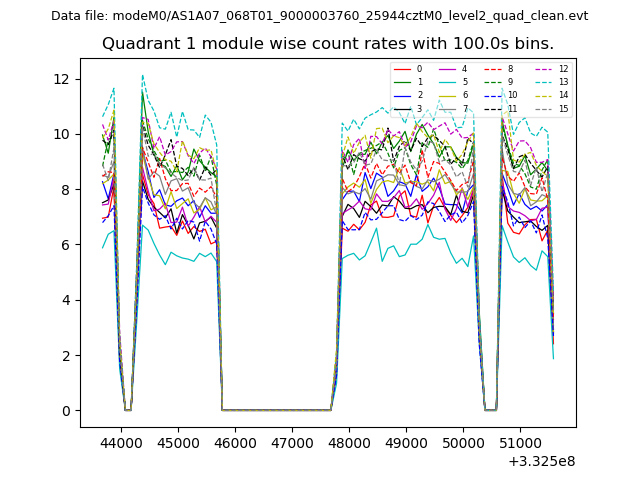
| Module-wise count rates for Quadrant A Data is divided into 100 sec bins |
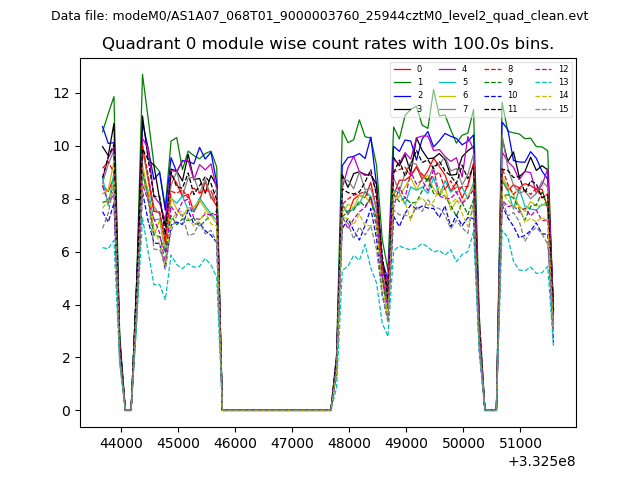 |
 |
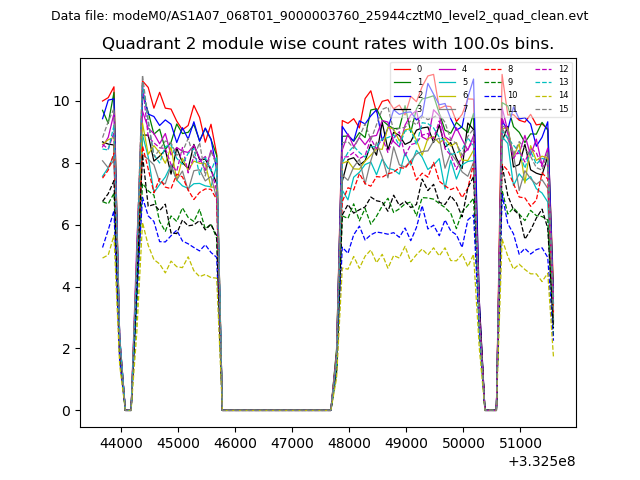
| Module-wise count rates for Quadrant B Data is divided into 100 sec bins |
 |
 |
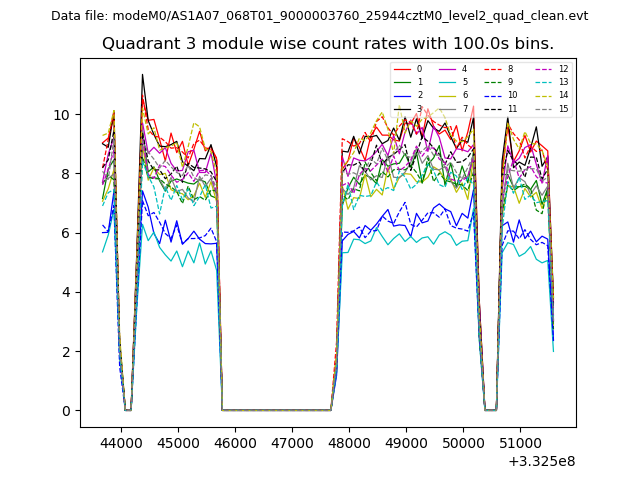
| Module-wise count rates for Quadrant C Data is divided into 100 sec bins |
 |
 |
| Module-wise count rates for Quadrant D Data is divided into 100 sec bins |
 |
 |
| Parameter | Plot |
|---|---|
| CZT HV Monitor | 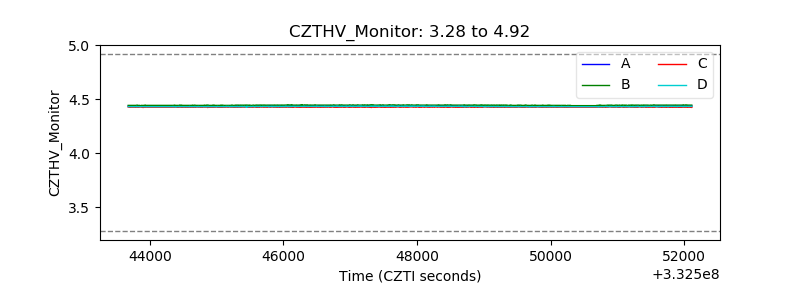 |
| D_VDD | 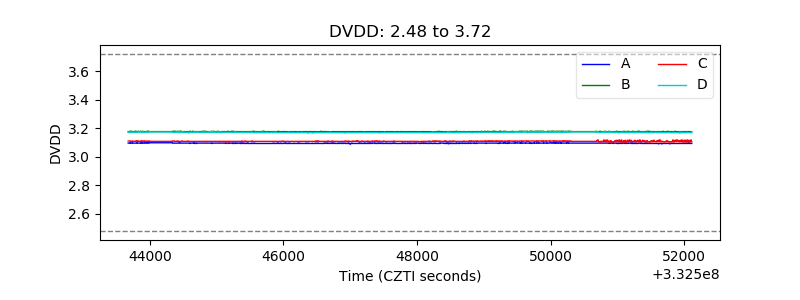 |
| Temperature 1 | 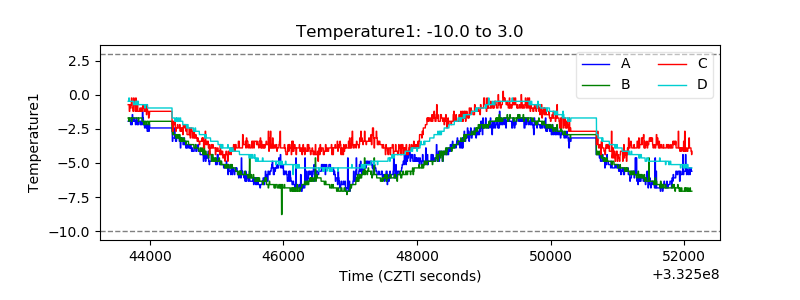 |
| Veto HV Monitor | 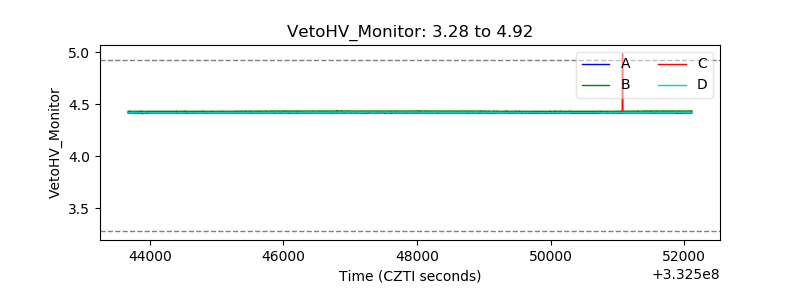 |
| Veto LLD |  |
| Alpha Counter | 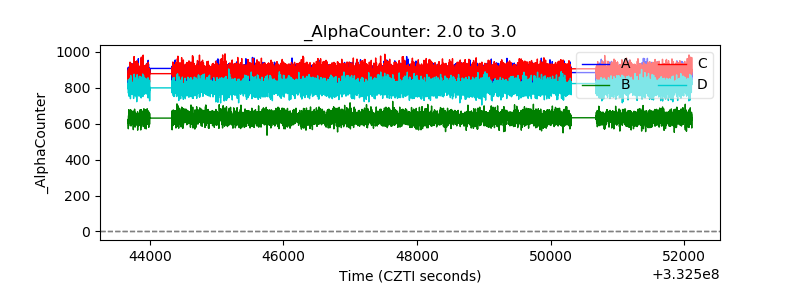 |
| _CPM_Rate | 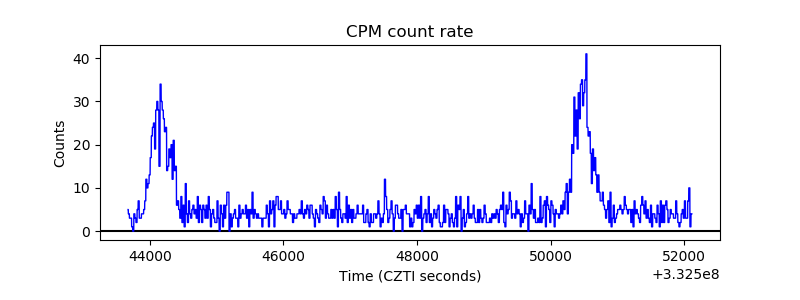 |
| CZT Counter | 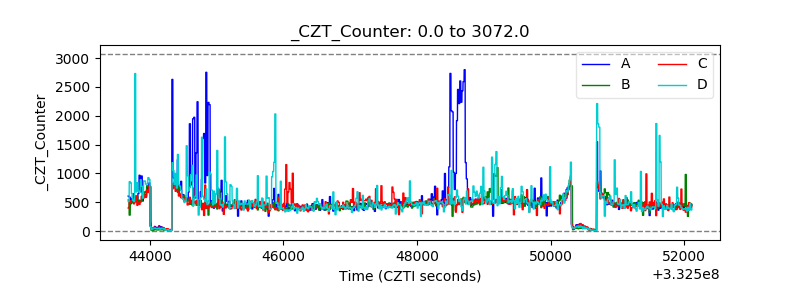 |
| +2.5 Volts monitor |  |
| +5 Volts monitor |  |
| _ROLL_ROT | 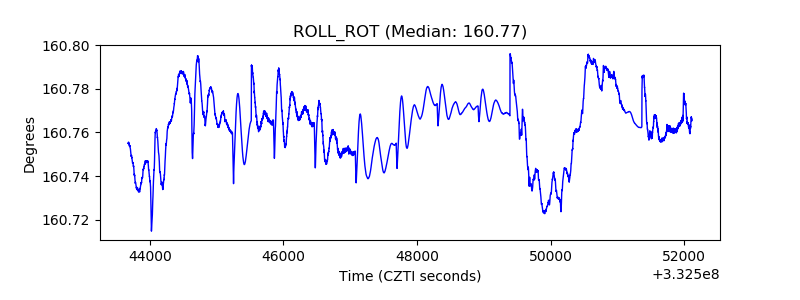 |
| _Roll_DEC |  |
| _Roll_RA | 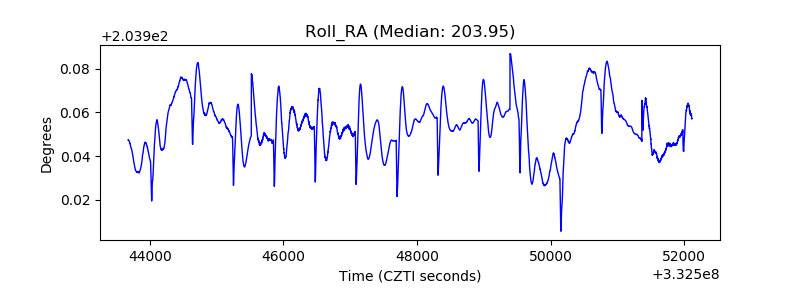 |
| Veto Counter | 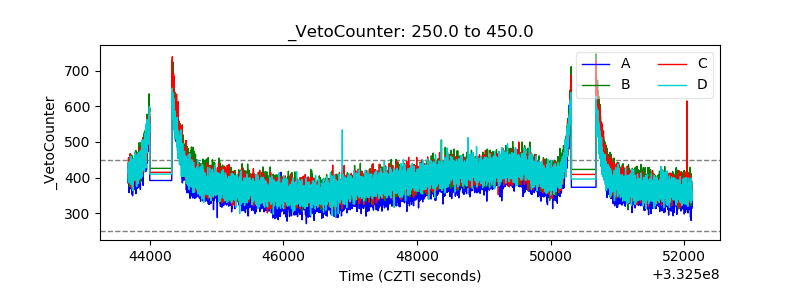 |