| Param | Original file | Final file |
|---|---|---|
| Filename | modeM0/AS1A07_068T01_9000003760_25947cztM0_level2.evt | modeM0/AS1A07_068T01_9000003760_25947cztM0_level2_quad_clean.evt |
| Size (bytes) | 1,255,466,880 | 229,144,320 |
| Size | 1.2 GB | 218.5 MB |
| Events in quadrant A | 9,095,783 | 1,440,355 |
| Events in quadrant B | 9,164,613 | 1,442,897 |
| Events in quadrant C | 9,026,488 | 1,372,190 |
| Events in quadrant D | 9,454,759 | 1,380,593 |
| Mode M0 | |||
|---|---|---|---|
| Quadrant | BADHDUFLAG | Total packets | Discarded packets |
| A | 0 | 39231 | 0 |
| B | 0 | 39396 | 0 |
| C | 0 | 38955 | 0 |
| D | 0 | 41125 | 0 |
| Mode M9 | |||
|---|---|---|---|
| Quadrant | BADHDUFLAG | Total packets | Discarded packets |
| A | 0 | 24 | 0 |
| B | 0 | 24 | 0 |
| C | 0 | 24 | 0 |
| D | 0 | 24 | 0 |
| Quadrant | Total seconds | Saturated seconds | Saturation percentage |
|---|---|---|---|
| A | 18931 | 202 | 1.067033% |
| B | 18932 | 238 | 1.257131% |
| C | 18932 | 289 | 1.526516% |
| D | 18932 | 280 | 1.478977% |
Noise dominated data is calculated using 1-second bins in cleaned event files. If a bin has >2000 counts, and if more than 50% of those come from <1% of pixels, then it is considered to be noise-dominated and hence unusable.
| Quadrant | # 1 sec bins | Bins with >0 counts | Bins with >2000 counts | High rate bins dominated by noise | Noise dominated (total time) | Noise dominated (detector-on time) | Marked lightcurve |
|---|---|---|---|---|---|---|---|
| A | 21222 | 18935 | 4 | 4 | 0.02% | 0.02% |  |
| B | 21223 | 18935 | 2 | 2 | 0.01% | 0.01% |  |
| C | 21223 | 18935 | 0 | 0 | 0.00% | 0.00% |  |
| D | 21223 | 18935 | 88 | 88 | 0.41% | 0.46% |  |
Top three noisy pixels from each quadrant. If the there are fewer than three noisy pixels in the level2.evt file, extra rows are filled as -1
| Pixel properties | Quadrant properties | ||||||
|---|---|---|---|---|---|---|---|
| Quadrant | DetID | PixID | Counts | Sigma | Mean | Median | Sigma |
| A | 0 | 13 | 144201 | 306.51 | 2306 | 2257 | 463.1 |
| A | 12 | 16 | 54386 | 112.56 | 2306 | 2257 | 463.1 |
| A | 13 | 254 | 27758 | 55.06 | 2306 | 2257 | 463.1 |
| B | 0 | 190 | 181959 | 406.82 | 2284 | 2219 | 441.8 |
| B | 12 | 111 | 55096 | 119.68 | 2284 | 2219 | 441.8 |
| B | 11 | 111 | 49614 | 107.27 | 2284 | 2219 | 441.8 |
| C | 14 | 238 | 348306 | 675.88 | 2187 | 2199 | 512.1 |
| C | 3 | 233 | 142769 | 274.51 | 2187 | 2199 | 512.1 |
| C | 13 | 61 | 15262 | 25.51 | 2187 | 2199 | 512.1 |
| D | 1 | 52 | 737446 | 1379.79 | 2220 | 2165 | 532.9 |
| D | 12 | 1 | 246607 | 458.71 | 2220 | 2165 | 532.9 |
| D | 2 | 234 | 77077 | 140.58 | 2220 | 2165 | 532.9 |
Histogram calculated using DETX and DETY for each event in the final _common_clean file
| Quadrant A |  |
 |
Quadrant B |
|---|---|---|---|
| Quadrant D |  |
 |
Quadrant C |
| Plot type | Count rate plots | Images |
|---|---|---|
| Comparison with Poisson distribution Blue bars denote a histogram of data divided into 1 sec bins. Red curve is a Poisson curve with rate = median count rate of data. |
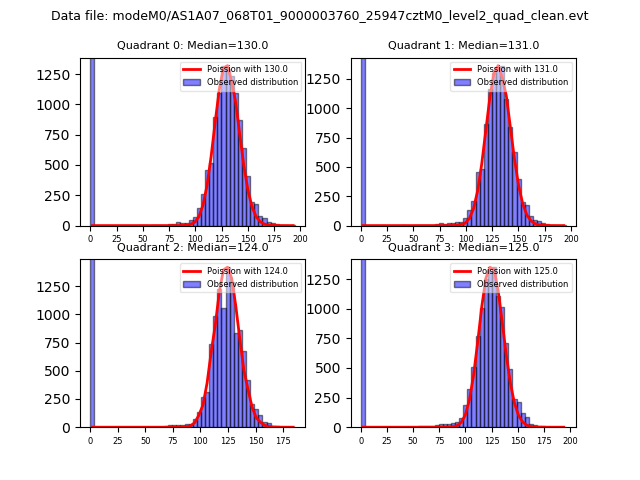 |
 |
| Quadrant-wise count rates Data is divided into 100 sec bins |
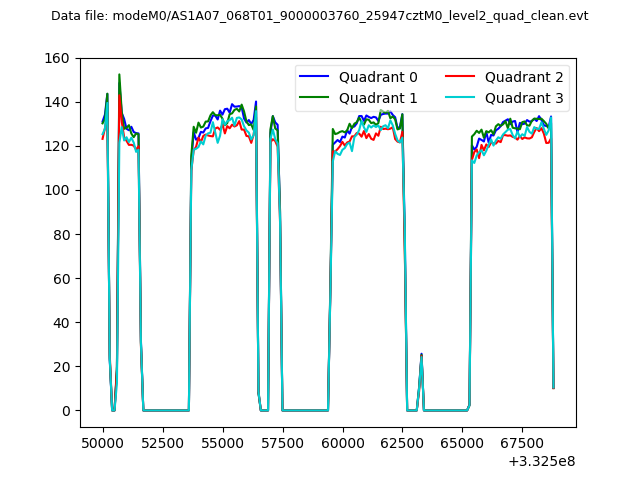 |
|
| Module-wise count rates for Quadrant A Data is divided into 100 sec bins |
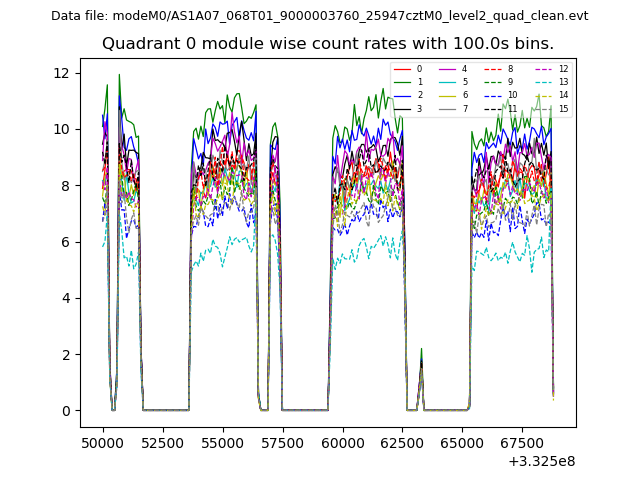 |
 |
| Module-wise count rates for Quadrant B Data is divided into 100 sec bins |
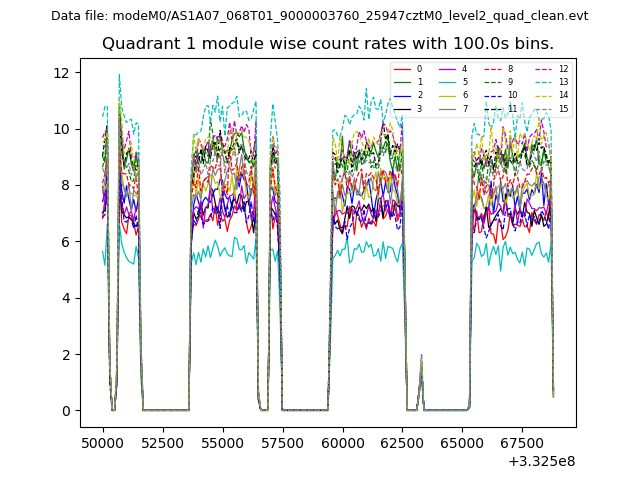 |
 |
| Module-wise count rates for Quadrant C Data is divided into 100 sec bins |
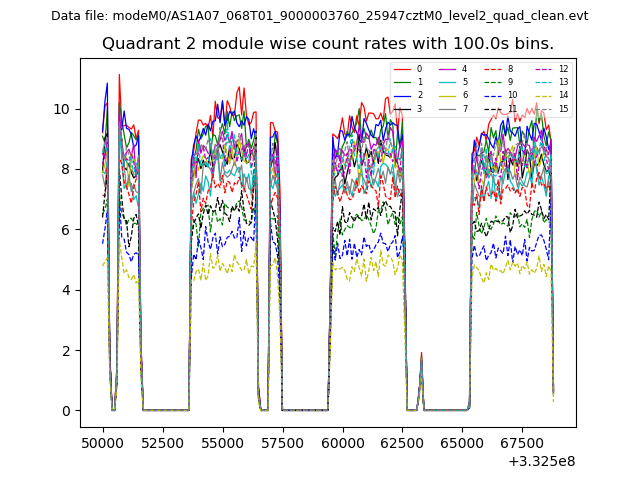 |
 |
| Module-wise count rates for Quadrant D Data is divided into 100 sec bins |
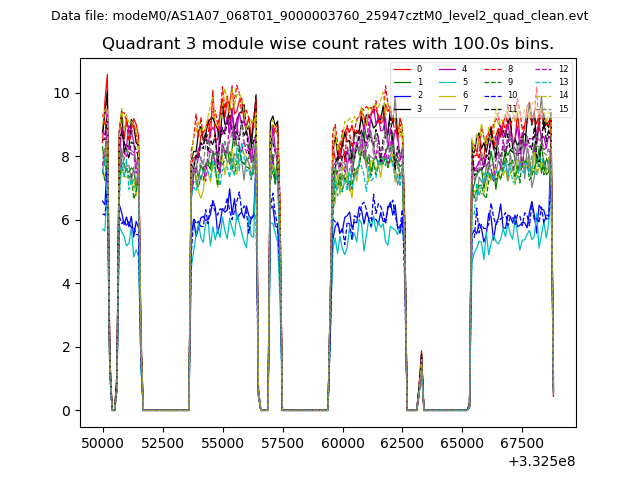 |
 |
| Parameter | Plot |
|---|---|
| CZT HV Monitor | 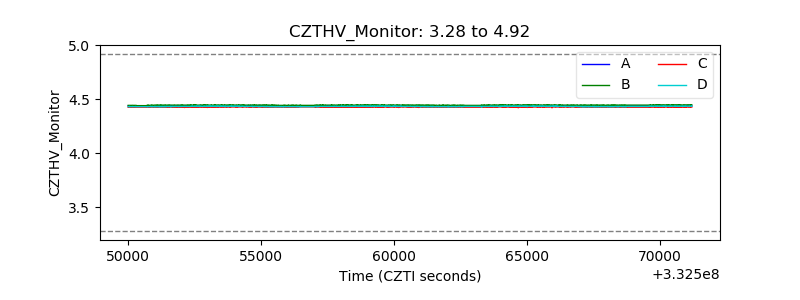 |
| D_VDD |  |
| Temperature 1 |  |
| Veto HV Monitor |  |
| Veto LLD |  |
| Alpha Counter | 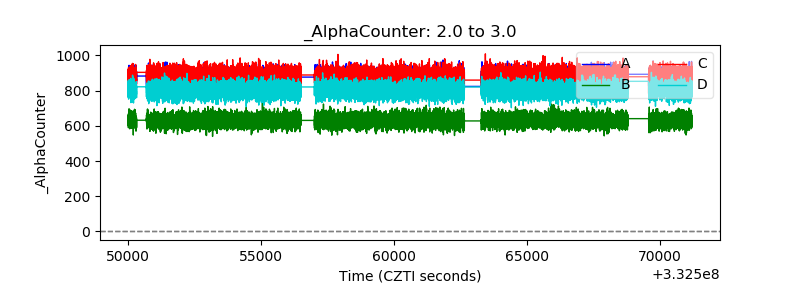 |
| _CPM_Rate | 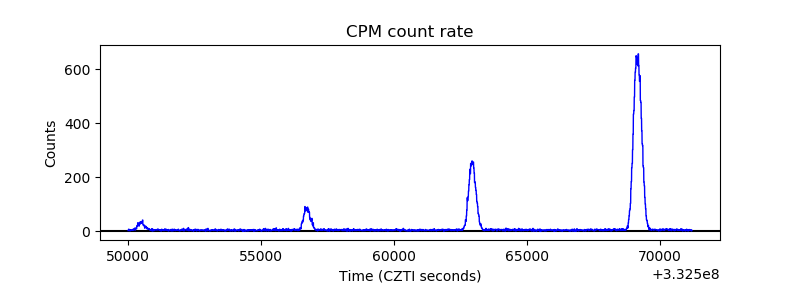 |
| CZT Counter |  |
| +2.5 Volts monitor |  |
| +5 Volts monitor |  |
| _ROLL_ROT | 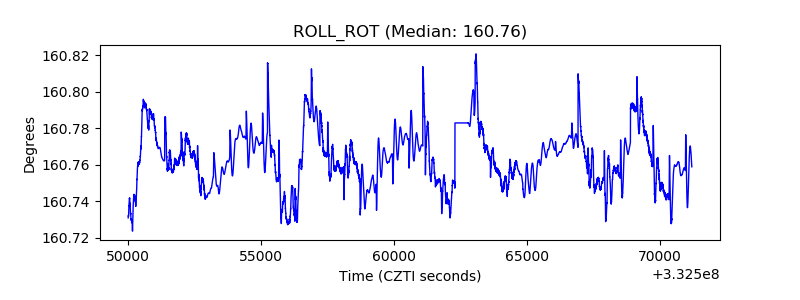 |
| _Roll_DEC |  |
| _Roll_RA |  |
| Veto Counter | 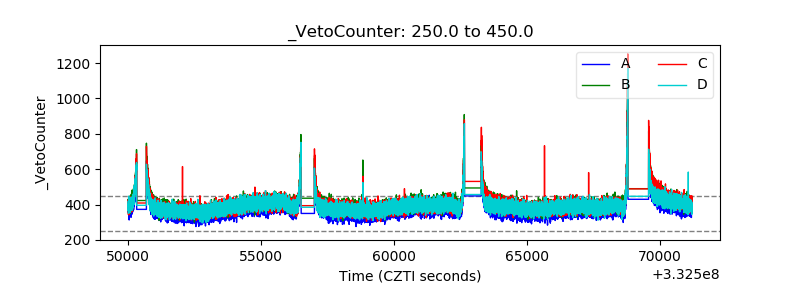 |