| Param | Original file | Final file |
|---|---|---|
| Filename | modeM0/AS1A07_068T01_9000003760_25948cztM0_level2.evt | modeM0/AS1A07_068T01_9000003760_25948cztM0_level2_quad_clean.evt |
| Size (bytes) | 472,746,240 | 82,892,160 |
| Size | 450.8 MB | 79.1 MB |
| Events in quadrant A | 3,451,411 | 520,729 |
| Events in quadrant B | 3,340,253 | 522,481 |
| Events in quadrant C | 3,344,183 | 496,629 |
| Events in quadrant D | 3,716,939 | 493,877 |
| Mode M0 | |||
|---|---|---|---|
| Quadrant | BADHDUFLAG | Total packets | Discarded packets |
| A | 0 | 14451 | 0 |
| B | 0 | 14102 | 0 |
| C | 0 | 14166 | 0 |
| D | 0 | 15515 | 0 |
| Mode M9 | |||
|---|---|---|---|
| Quadrant | BADHDUFLAG | Total packets | Discarded packets |
| A | 0 | 16 | 0 |
| B | 0 | 17 | 0 |
| C | 0 | 17 | 0 |
| D | 0 | 17 | 0 |
| Quadrant | Total seconds | Saturated seconds | Saturation percentage |
|---|---|---|---|
| A | 6838 | 71 | 1.038315% |
| B | 6838 | 81 | 1.184557% |
| C | 6838 | 109 | 1.594033% |
| D | 6838 | 134 | 1.959637% |
Noise dominated data is calculated using 1-second bins in cleaned event files. If a bin has >2000 counts, and if more than 50% of those come from <1% of pixels, then it is considered to be noise-dominated and hence unusable.
| Quadrant | # 1 sec bins | Bins with >0 counts | Bins with >2000 counts | High rate bins dominated by noise | Noise dominated (total time) | Noise dominated (detector-on time) | Marked lightcurve |
|---|---|---|---|---|---|---|---|
| A | 7793 | 6839 | 8 | 8 | 0.10% | 0.12% | 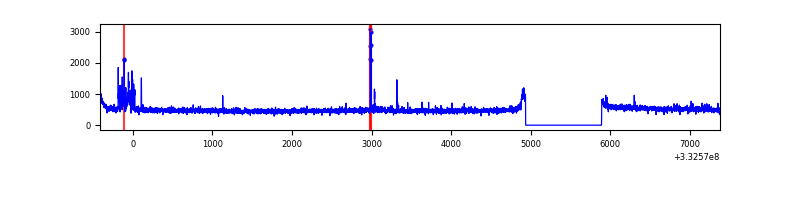 |
| B | 7793 | 6839 | 1 | 1 | 0.01% | 0.01% | 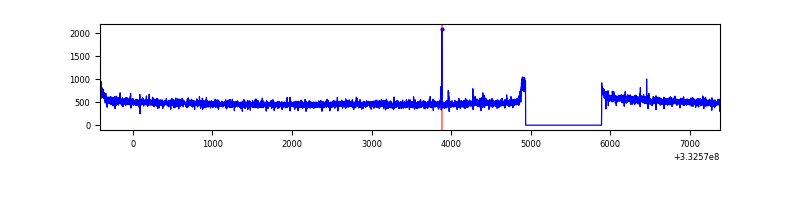 |
| C | 7793 | 6839 | 0 | 0 | 0.00% | 0.00% | 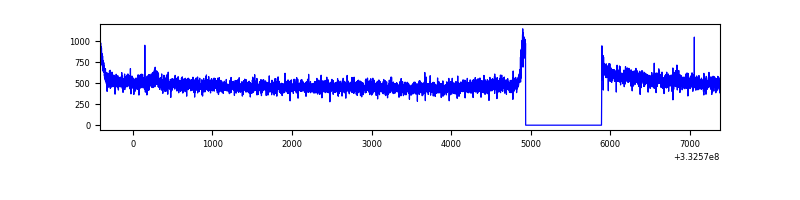 |
| D | 7793 | 6839 | 72 | 72 | 0.92% | 1.05% | 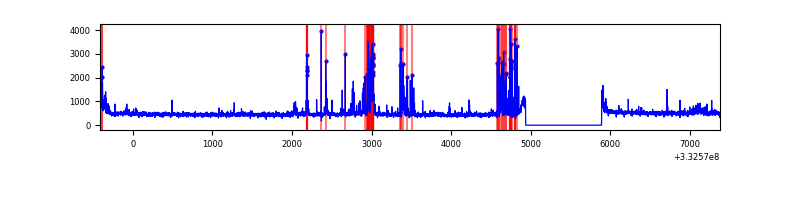 |
Top three noisy pixels from each quadrant. If the there are fewer than three noisy pixels in the level2.evt file, extra rows are filled as -1
| Pixel properties | Quadrant properties | ||||||
|---|---|---|---|---|---|---|---|
| Quadrant | DetID | PixID | Counts | Sigma | Mean | Median | Sigma |
| A | 0 | 13 | 131853 | 755.55 | 861 | 842 | 173.4 |
| A | 13 | 254 | 10222 | 54.1 | 861 | 842 | 173.4 |
| A | 3 | 137 | 7953 | 41.01 | 861 | 842 | 173.4 |
| B | 12 | 111 | 20221 | 119.47 | 851 | 830 | 162.3 |
| B | 11 | 111 | 18494 | 108.83 | 851 | 830 | 162.3 |
| B | 14 | 111 | 16802 | 98.41 | 851 | 830 | 162.3 |
| C | 14 | 238 | 132081 | 685.47 | 819 | 824 | 191.5 |
| C | 3 | 233 | 14561 | 71.74 | 819 | 824 | 191.5 |
| C | 13 | 61 | 5646 | 25.18 | 819 | 824 | 191.5 |
| D | 12 | 1 | 396136 | 2004.05 | 828 | 808 | 197.3 |
| D | 1 | 52 | 101784 | 511.88 | 828 | 808 | 197.3 |
| D | 12 | 233 | 61447 | 307.4 | 828 | 808 | 197.3 |
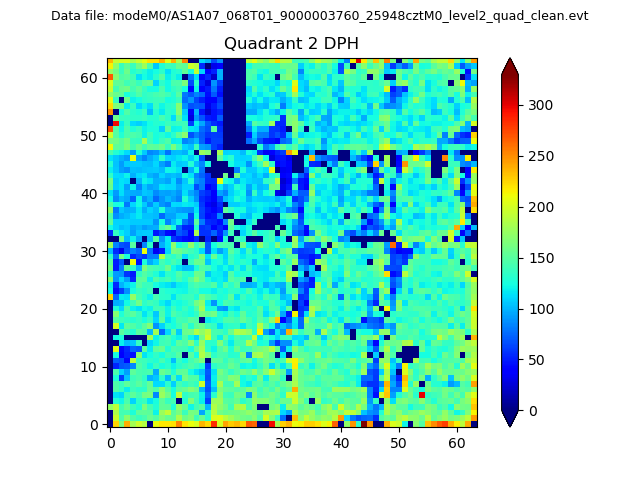
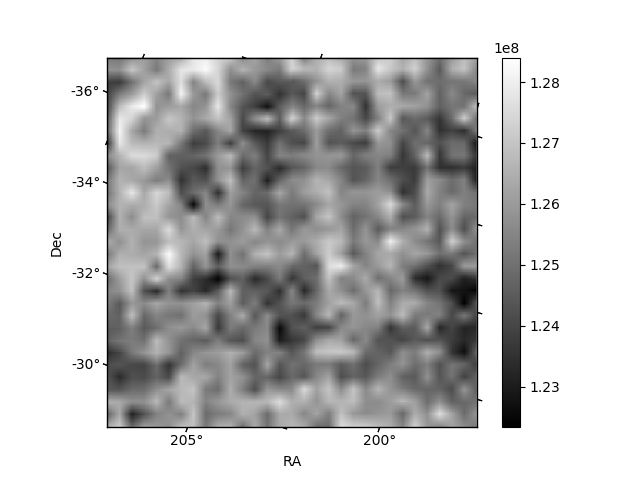
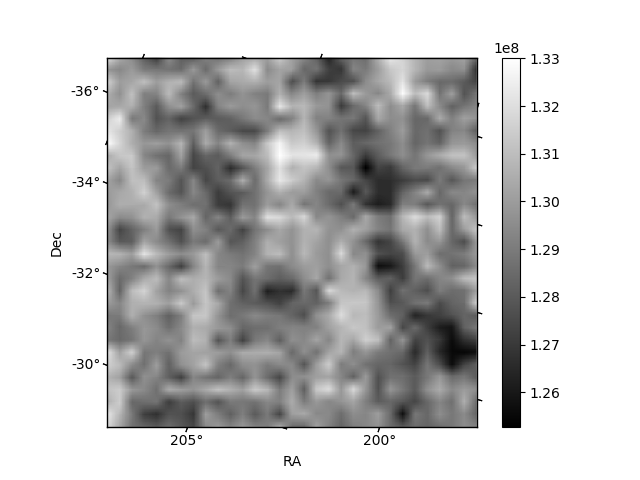
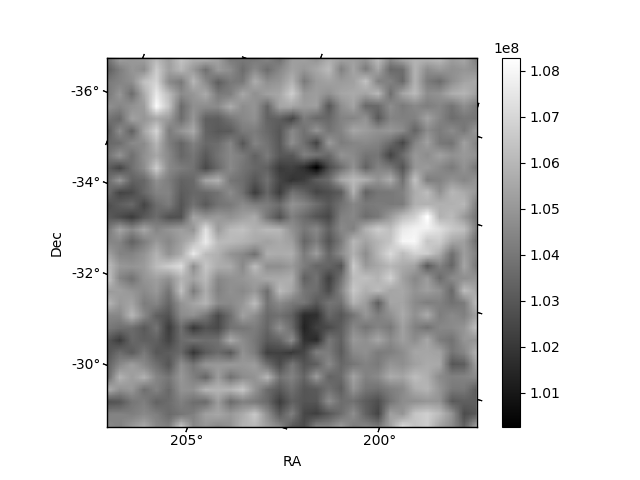
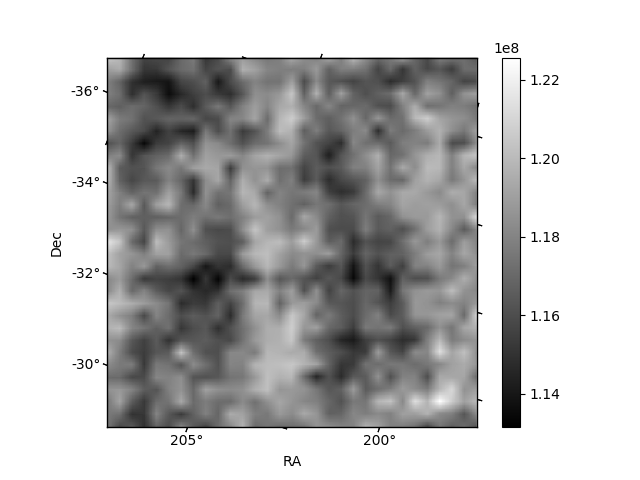
Histogram calculated using DETX and DETY for each event in the final _common_clean file
| Quadrant A | 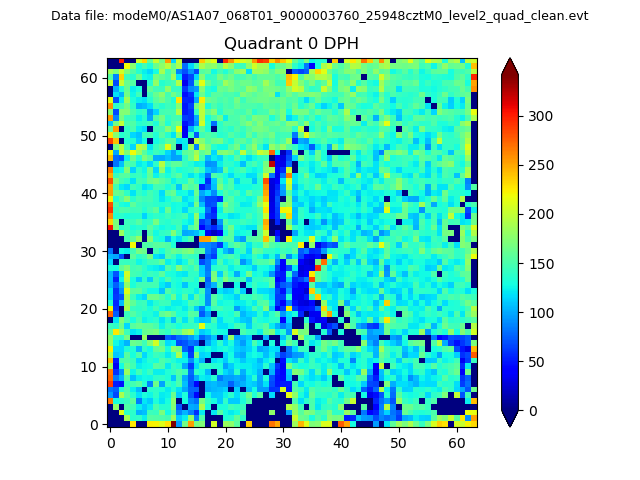 |
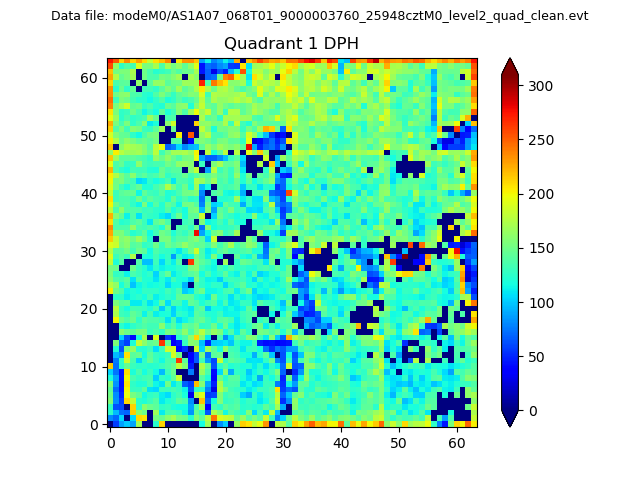 |
Quadrant B |
|---|---|---|---|
| Quadrant D | 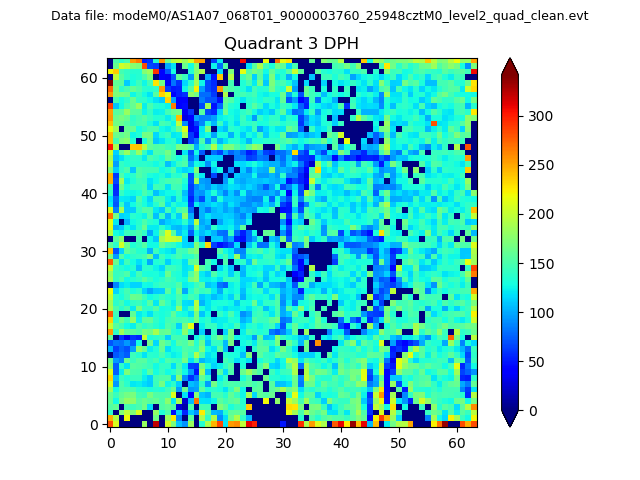 |
 |
Quadrant C |
| Plot type | Count rate plots | Images |
|---|---|---|
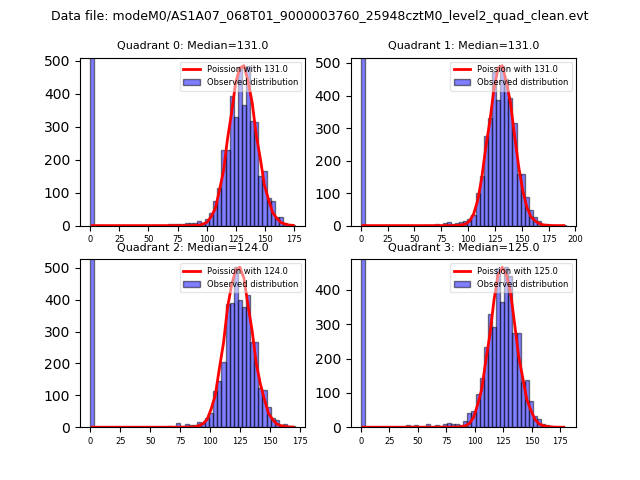
| Comparison with Poisson distribution Blue bars denote a histogram of data divided into 1 sec bins. Red curve is a Poisson curve with rate = median count rate of data. |
 |
 |
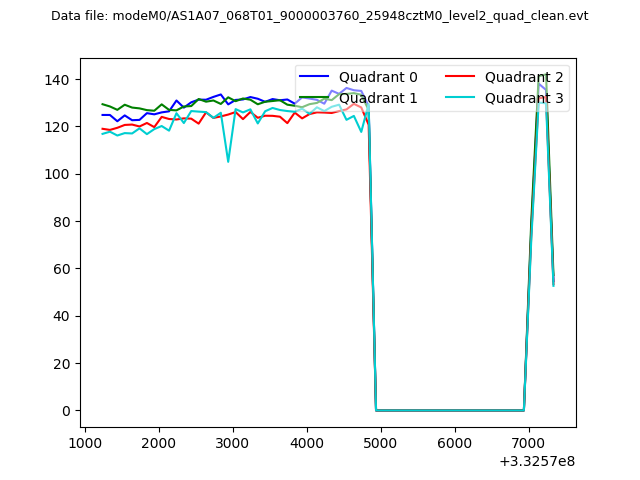
| Quadrant-wise count rates Data is divided into 100 sec bins |
 |
|
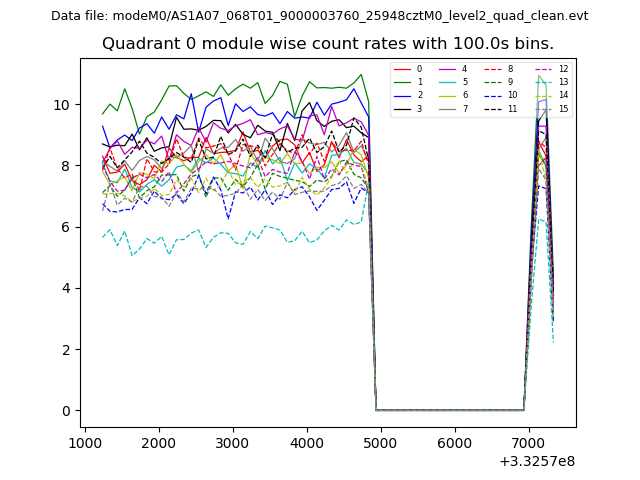
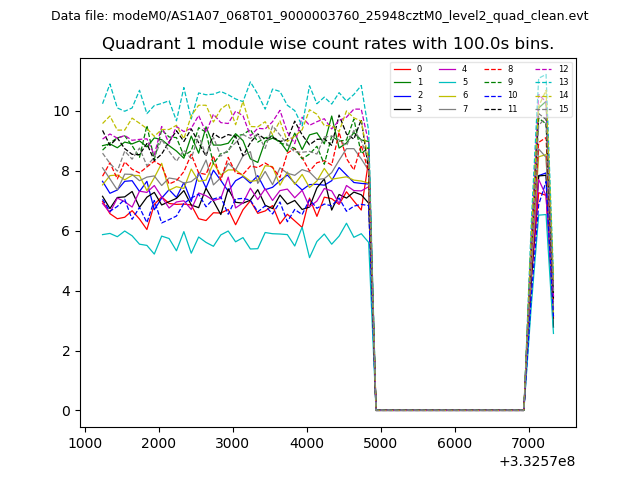
| Module-wise count rates for Quadrant A Data is divided into 100 sec bins |
 |
 |
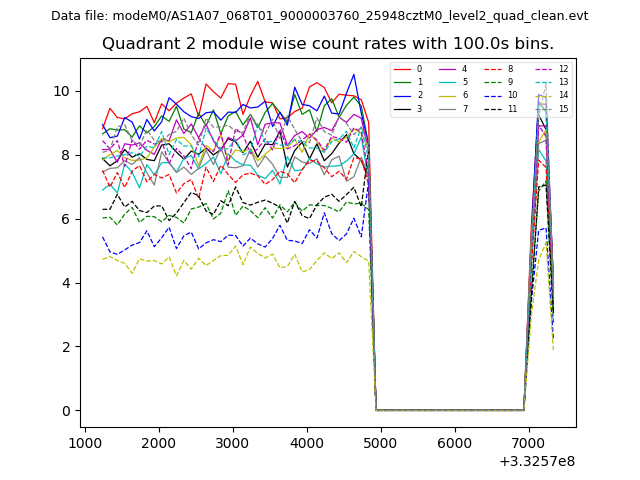
| Module-wise count rates for Quadrant B Data is divided into 100 sec bins |
 |
 |
| Module-wise count rates for Quadrant C Data is divided into 100 sec bins |
 |
 |
| Module-wise count rates for Quadrant D Data is divided into 100 sec bins |
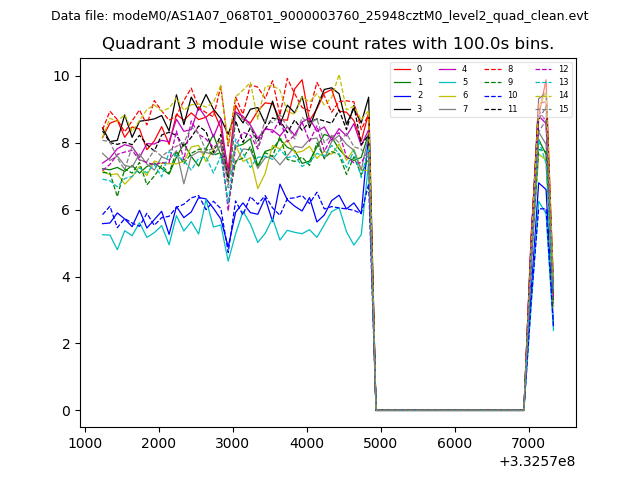 |
 |
| Parameter | Plot |
|---|---|
| CZT HV Monitor | 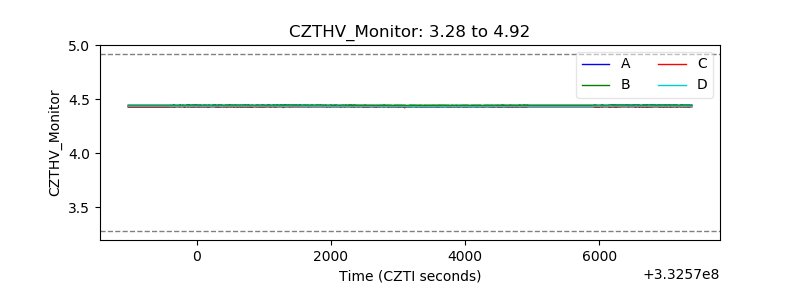 |
| D_VDD | 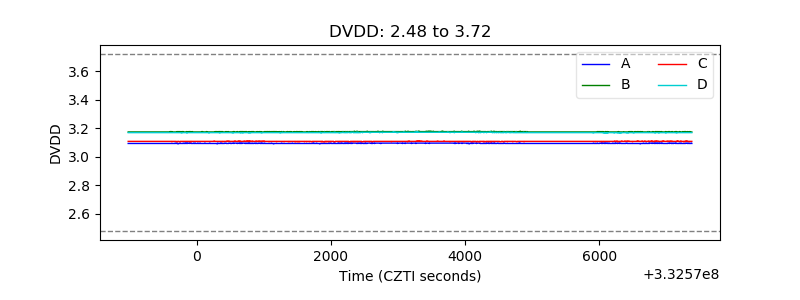 |
| Temperature 1 | 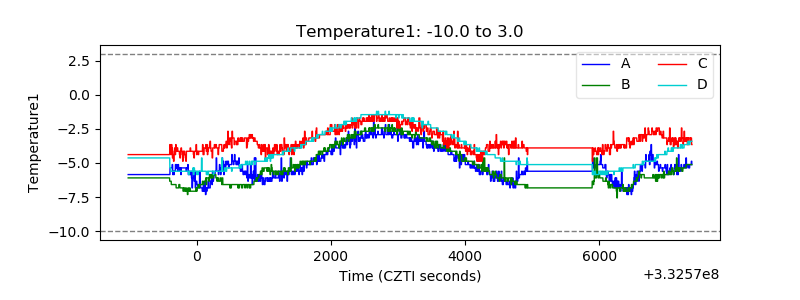 |
| Veto HV Monitor | 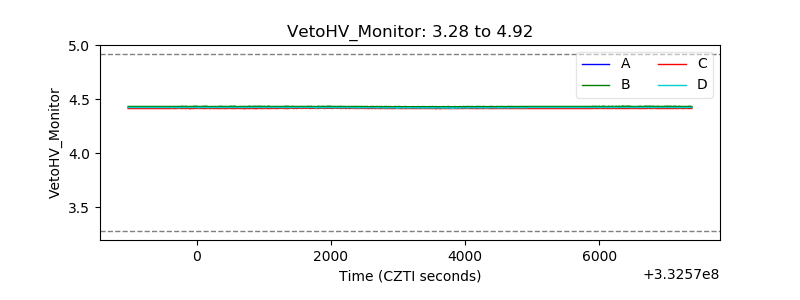 |
| Veto LLD | 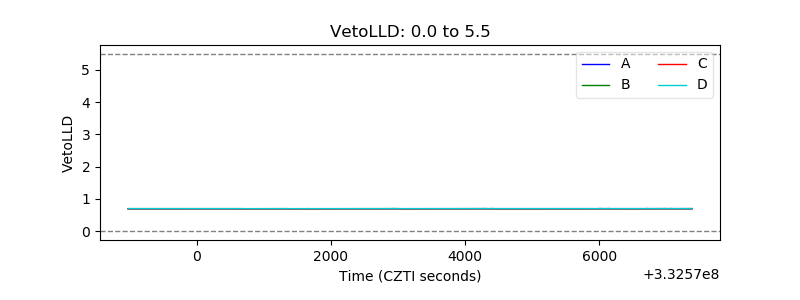 |
| Alpha Counter | 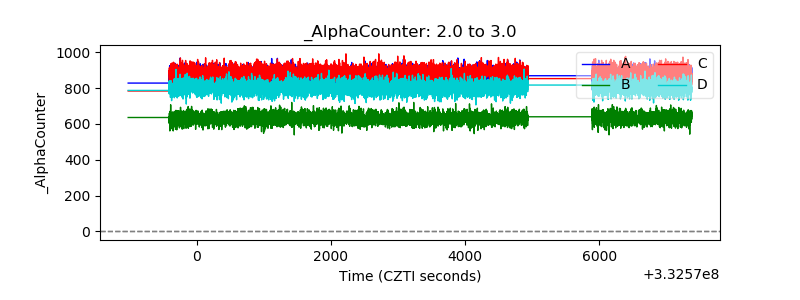 |
| _CPM_Rate | 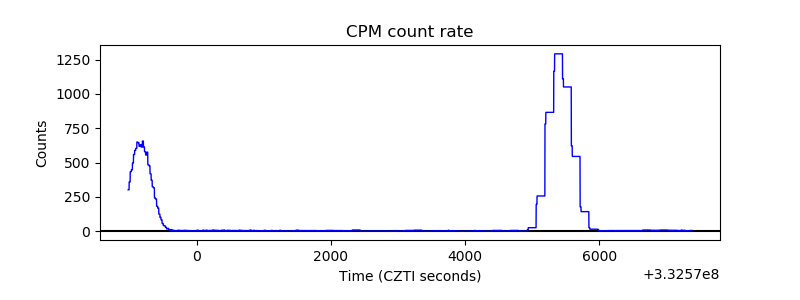 |
| CZT Counter | 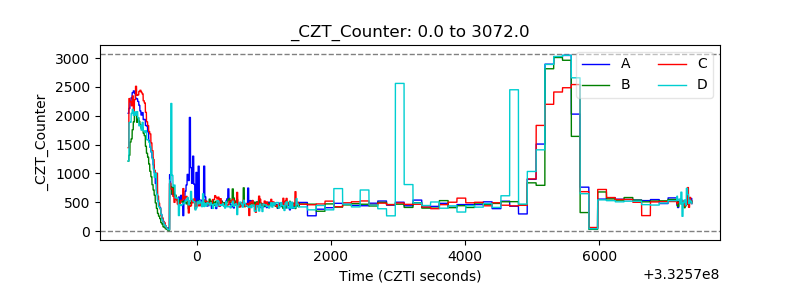 |
| +2.5 Volts monitor |  |
| +5 Volts monitor |  |
| _ROLL_ROT | 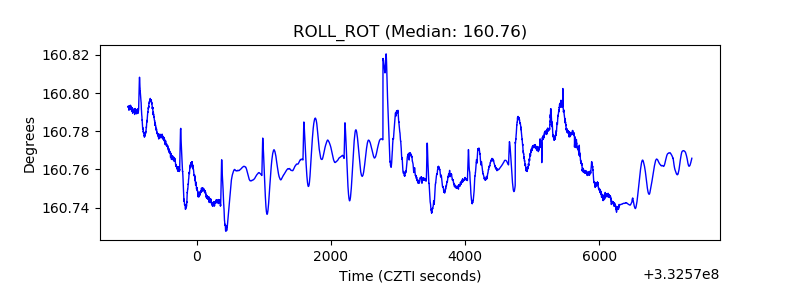 |
| _Roll_DEC | 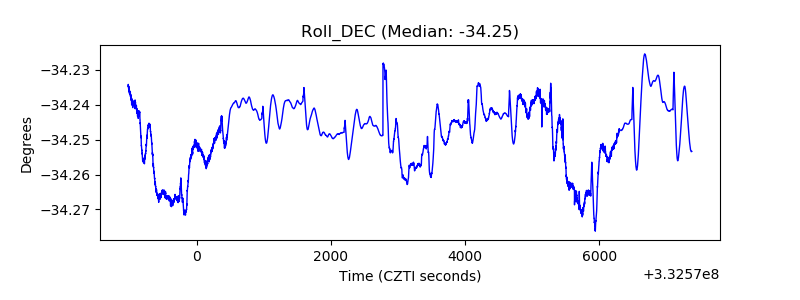 |
| _Roll_RA | 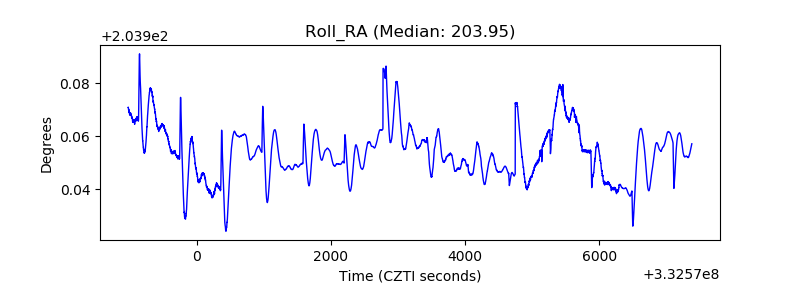 |
| Veto Counter | 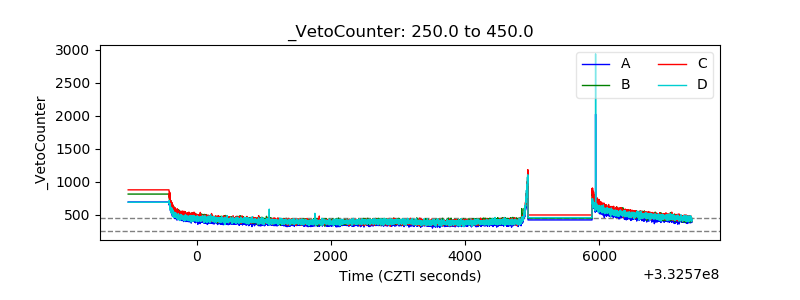 |