| Param | Original file | Final file |
|---|---|---|
| Filename | modeM0/AS1A07_068T01_9000003760_25950cztM0_level2.evt | modeM0/AS1A07_068T01_9000003760_25950cztM0_level2_quad_clean.evt |
| Size (bytes) | 469,869,120 | 91,601,280 |
| Size | 448.1 MB | 87.4 MB |
| Events in quadrant A | 3,336,324 | 592,011 |
| Events in quadrant B | 3,301,190 | 595,775 |
| Events in quadrant C | 3,328,228 | 566,834 |
| Events in quadrant D | 3,821,541 | 564,749 |
| Mode M0 | |||
|---|---|---|---|
| Quadrant | BADHDUFLAG | Total packets | Discarded packets |
| A | 0 | 13915 | 0 |
| B | 0 | 13898 | 0 |
| C | 0 | 14075 | 0 |
| D | 0 | 15564 | 0 |
| Mode M9 | |||
|---|---|---|---|
| Quadrant | BADHDUFLAG | Total packets | Discarded packets |
| A | 0 | 14 | 0 |
| B | 0 | 15 | 0 |
| C | 0 | 15 | 0 |
| D | 0 | 15 | 0 |
| Quadrant | Total seconds | Saturated seconds | Saturation percentage |
|---|---|---|---|
| A | 6513 | 66 | 1.013358% |
| B | 6513 | 77 | 1.182251% |
| C | 6513 | 125 | 1.919238% |
| D | 6513 | 85 | 1.305082% |
Noise dominated data is calculated using 1-second bins in cleaned event files. If a bin has >2000 counts, and if more than 50% of those come from <1% of pixels, then it is considered to be noise-dominated and hence unusable.
| Quadrant | # 1 sec bins | Bins with >0 counts | Bins with >2000 counts | High rate bins dominated by noise | Noise dominated (total time) | Noise dominated (detector-on time) | Marked lightcurve |
|---|---|---|---|---|---|---|---|
| A | 7598 | 6513 | 2 | 2 | 0.03% | 0.03% | 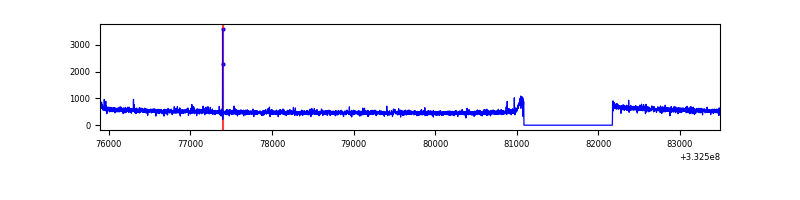 |
| B | 7598 | 6513 | 0 | 0 | 0.00% | 0.00% | 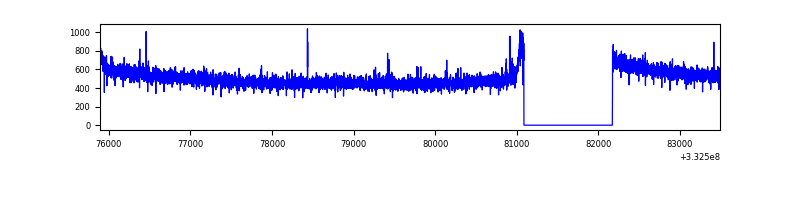 |
| C | 7598 | 6514 | 1 | 1 | 0.01% | 0.02% | 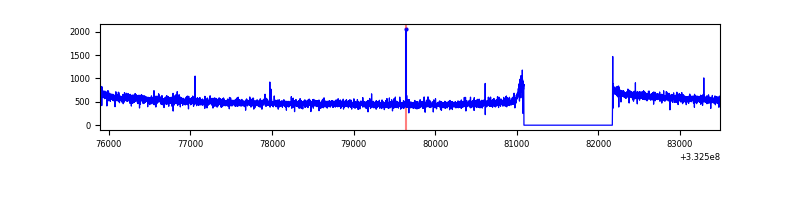 |
| D | 7598 | 6513 | 20 | 20 | 0.26% | 0.31% | 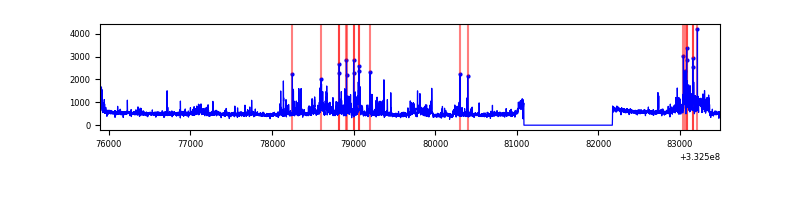 |
Top three noisy pixels from each quadrant. If the there are fewer than three noisy pixels in the level2.evt file, extra rows are filled as -1
| Pixel properties | Quadrant properties | ||||||
|---|---|---|---|---|---|---|---|
| Quadrant | DetID | PixID | Counts | Sigma | Mean | Median | Sigma |
| A | 0 | 13 | 31723 | 180.84 | 858 | 842 | 170.8 |
| A | 13 | 254 | 8679 | 45.89 | 858 | 842 | 170.8 |
| A | 3 | 137 | 7727 | 40.32 | 858 | 842 | 170.8 |
| B | 12 | 111 | 19359 | 116.7 | 841 | 822 | 158.8 |
| B | 11 | 111 | 17743 | 106.53 | 841 | 822 | 158.8 |
| B | 14 | 111 | 16322 | 97.58 | 841 | 822 | 158.8 |
| C | 14 | 238 | 132312 | 695.73 | 814 | 820 | 189.0 |
| C | 2 | 16 | 10480 | 51.11 | 814 | 820 | 189.0 |
| C | 3 | 233 | 6948 | 32.42 | 814 | 820 | 189.0 |
| D | 1 | 52 | 470305 | 2425.42 | 827 | 807 | 193.6 |
| D | 12 | 1 | 188551 | 969.88 | 827 | 807 | 193.6 |
| D | 2 | 234 | 24587 | 122.85 | 827 | 807 | 193.6 |
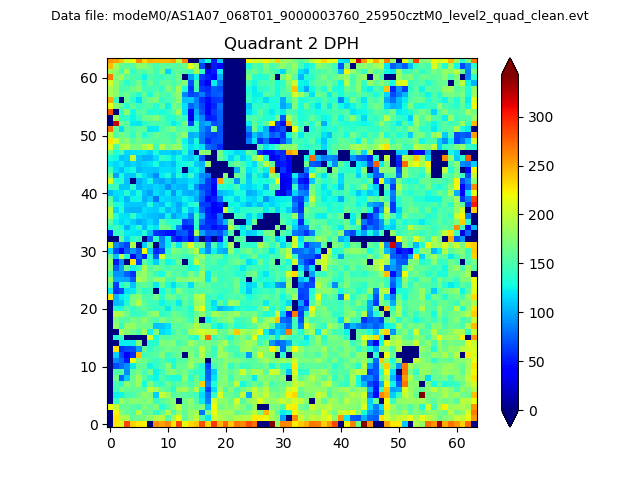
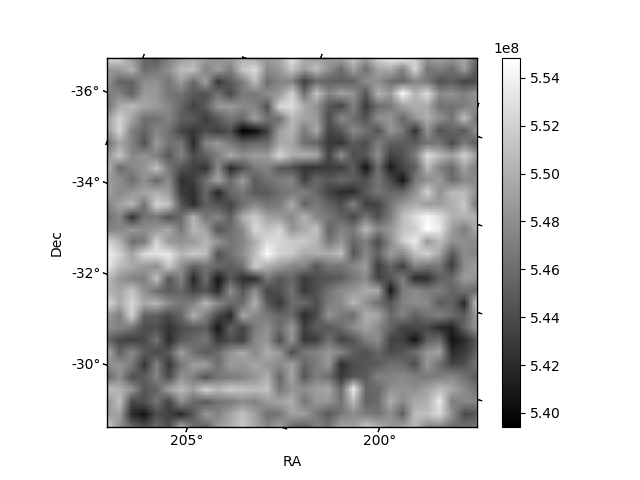
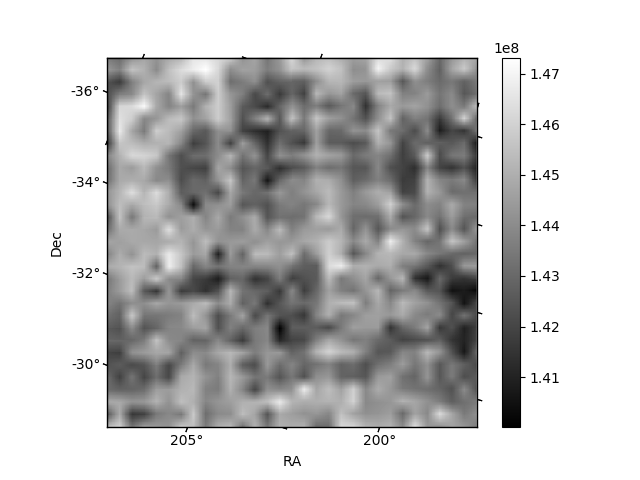
Histogram calculated using DETX and DETY for each event in the final _common_clean file
| Quadrant A | 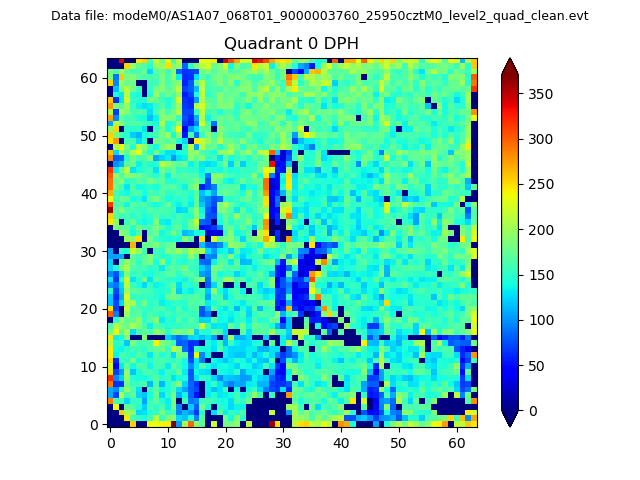 |
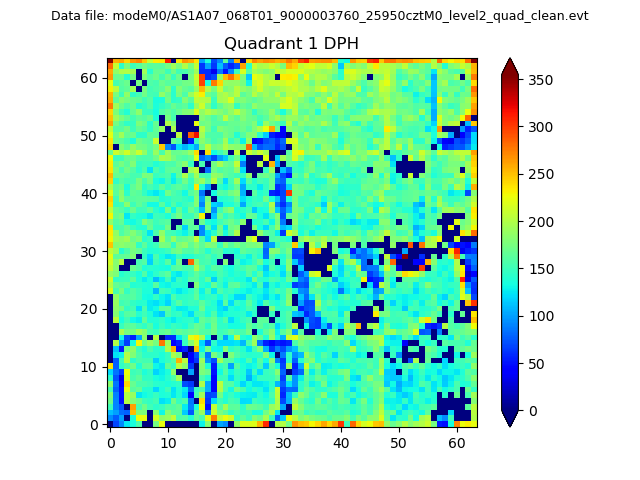 |
Quadrant B |
|---|---|---|---|
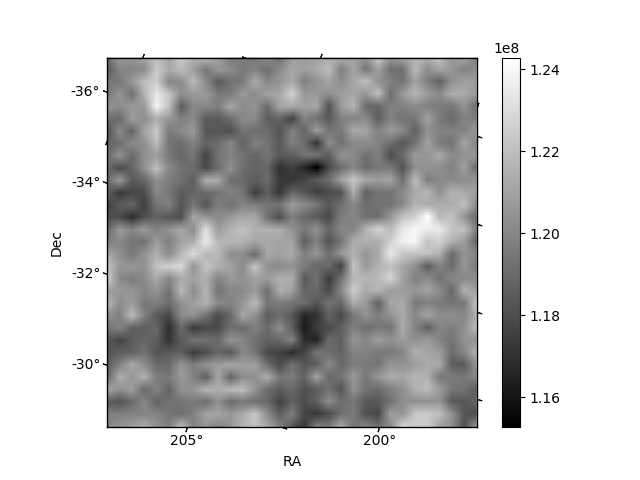
| Quadrant D | 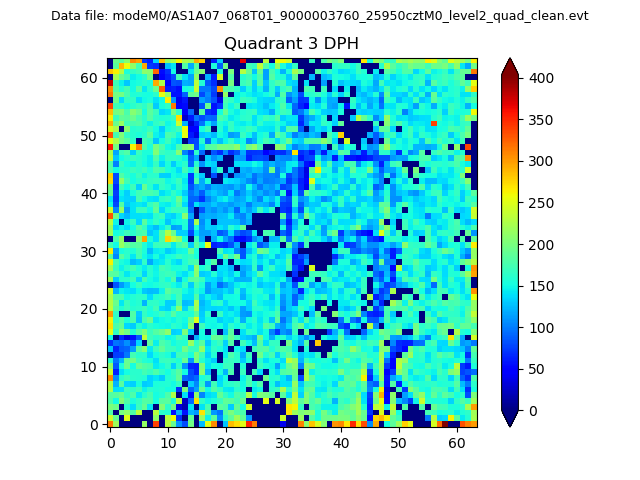 |
 |
Quadrant C |
| Plot type | Count rate plots | Images |
|---|---|---|
| Comparison with Poisson distribution Blue bars denote a histogram of data divided into 1 sec bins. Red curve is a Poisson curve with rate = median count rate of data. |
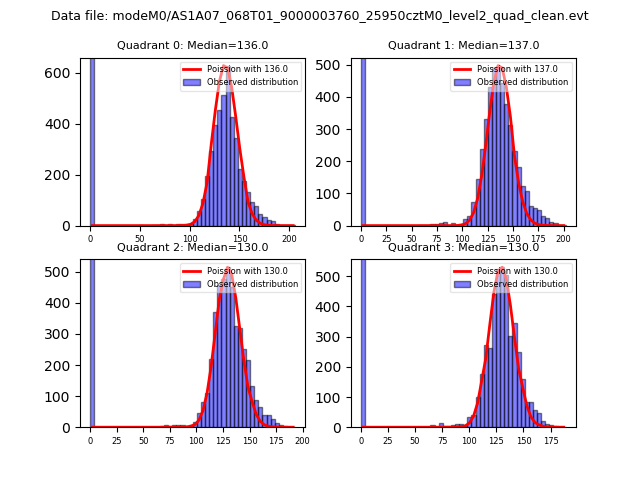 |
 |
| Quadrant-wise count rates Data is divided into 100 sec bins |
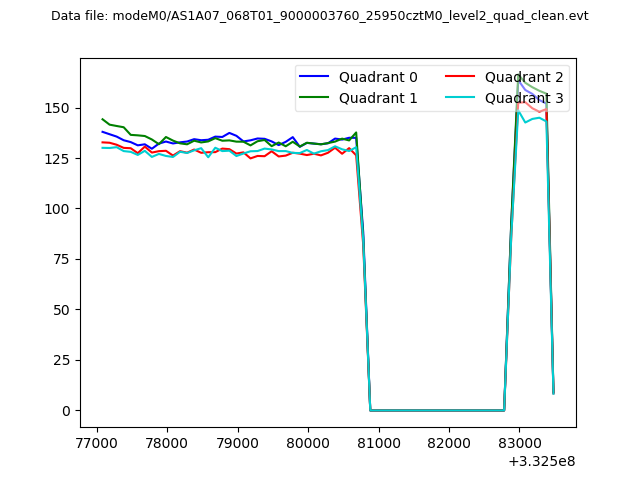 |
|
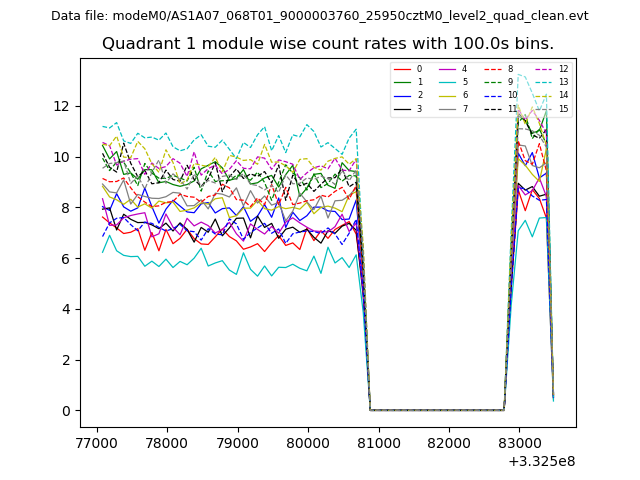
| Module-wise count rates for Quadrant A Data is divided into 100 sec bins |
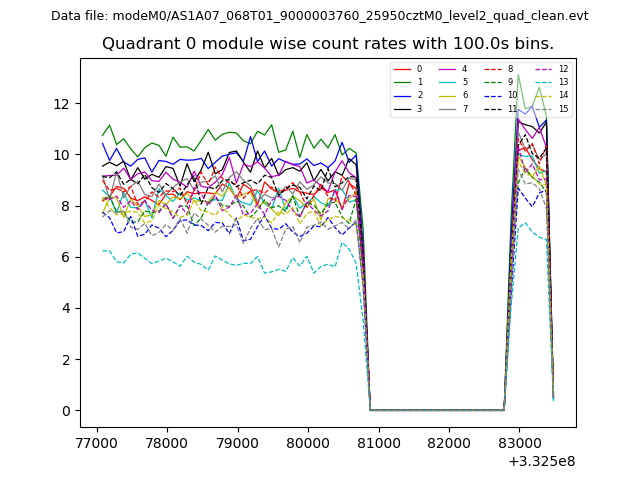 |
 |
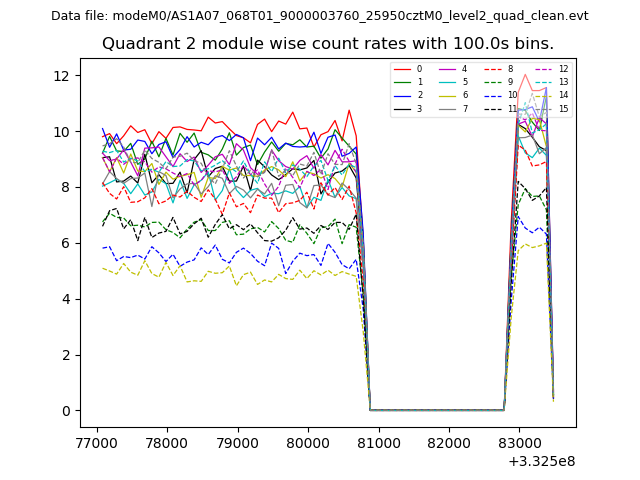
| Module-wise count rates for Quadrant B Data is divided into 100 sec bins |
 |
 |
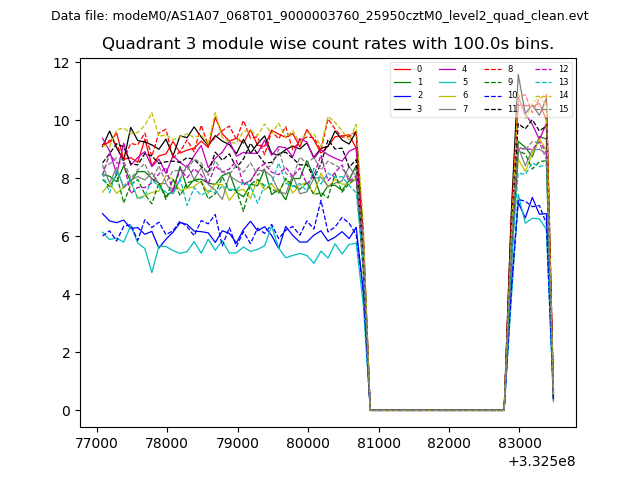
| Module-wise count rates for Quadrant C Data is divided into 100 sec bins |
 |
 |
| Module-wise count rates for Quadrant D Data is divided into 100 sec bins |
 |
 |
| Parameter | Plot |
|---|---|
| CZT HV Monitor | 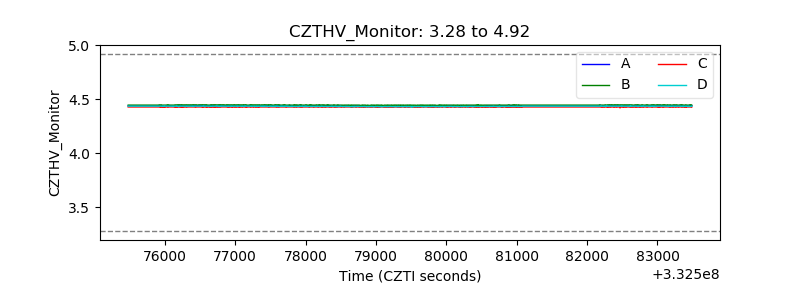 |
| D_VDD | 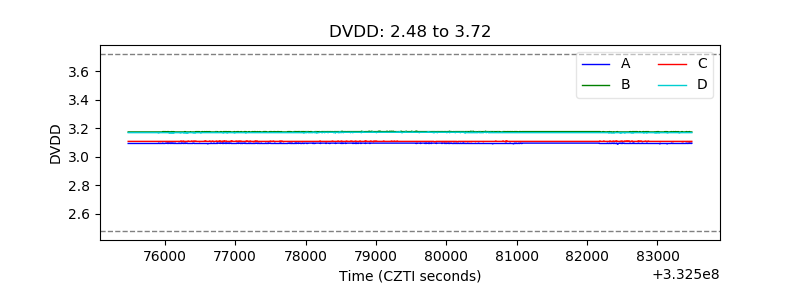 |
| Temperature 1 | 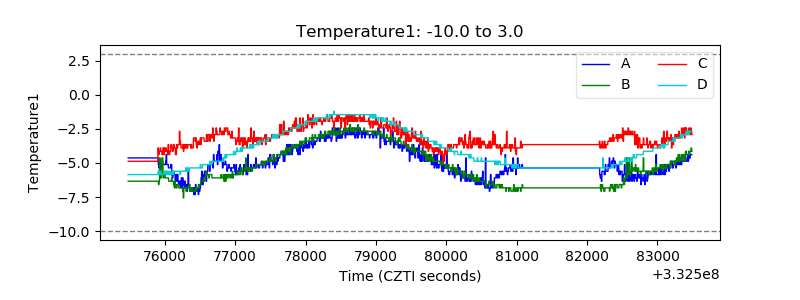 |
| Veto HV Monitor | 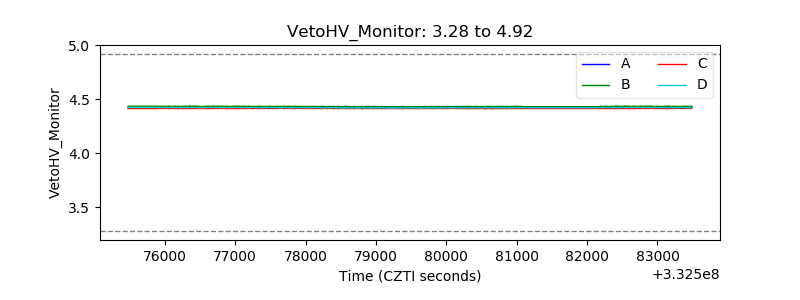 |
| Veto LLD | 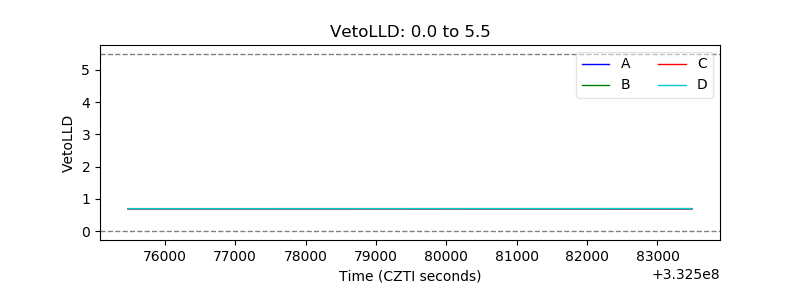 |
| Alpha Counter | 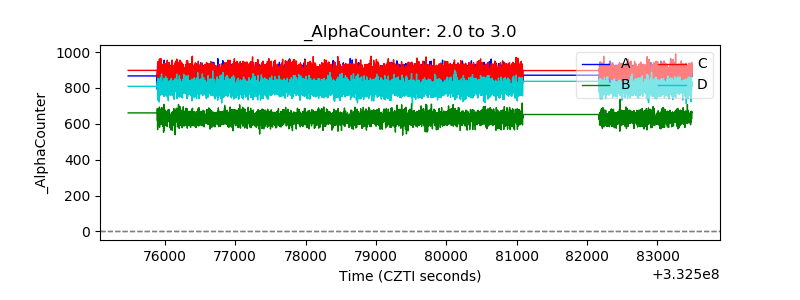 |
| _CPM_Rate | 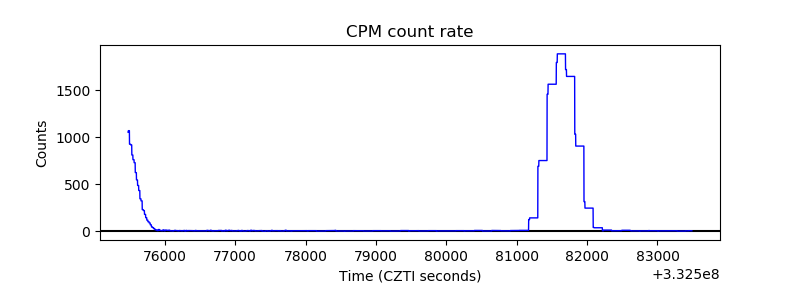 |
| CZT Counter | 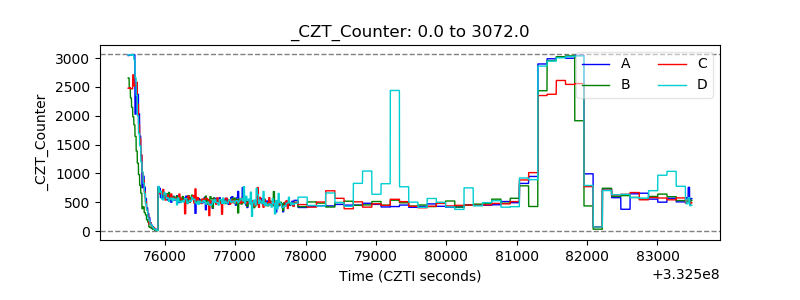 |
| +2.5 Volts monitor |  |
| +5 Volts monitor |  |
| _ROLL_ROT | 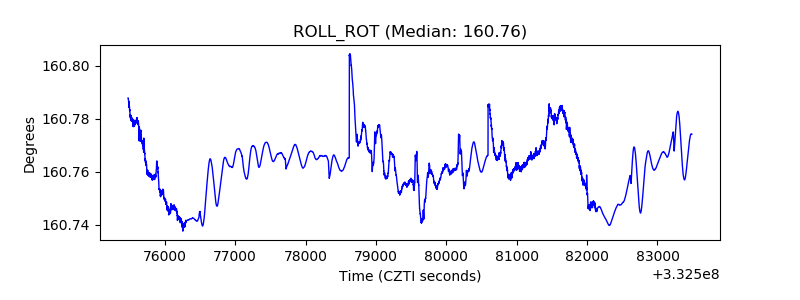 |
| _Roll_DEC | 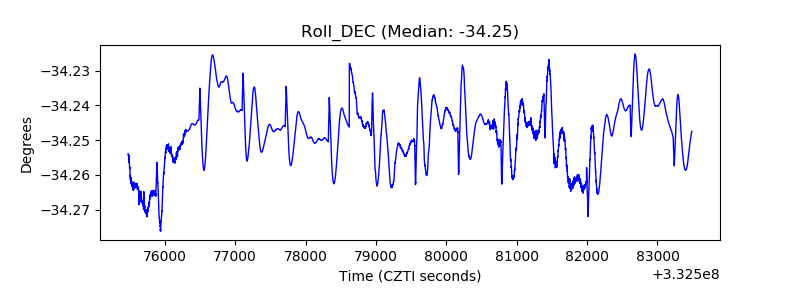 |
| _Roll_RA | 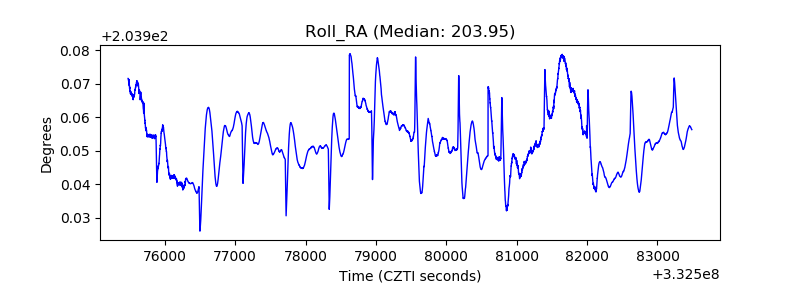 |
| Veto Counter | 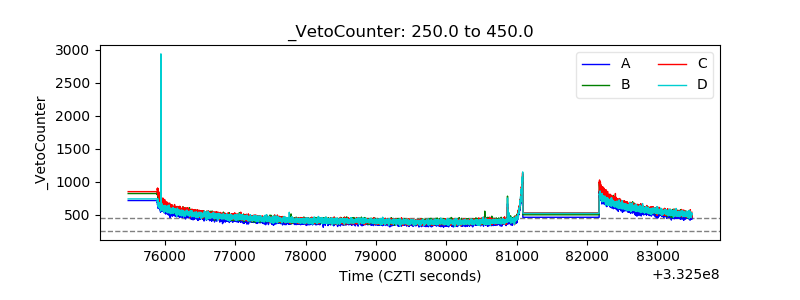 |