| Param | Original file | Final file |
|---|---|---|
| Filename | modeM0/AS1A07_068T01_9000003760_25951cztM0_level2.evt | modeM0/AS1A07_068T01_9000003760_25951cztM0_level2_quad_clean.evt |
| Size (bytes) | 520,274,880 | 106,689,600 |
| Size | 496.2 MB | 101.7 MB |
| Events in quadrant A | 3,441,873 | 720,550 |
| Events in quadrant B | 3,388,897 | 719,800 |
| Events in quadrant C | 3,418,533 | 685,139 |
| Events in quadrant D | 5,073,384 | 659,316 |
| Mode M0 | |||
|---|---|---|---|
| Quadrant | BADHDUFLAG | Total packets | Discarded packets |
| A | 0 | 14412 | 0 |
| B | 0 | 14211 | 0 |
| C | 0 | 14430 | 0 |
| D | 0 | 19506 | 0 |
| Mode M9 | |||
|---|---|---|---|
| Quadrant | BADHDUFLAG | Total packets | Discarded packets |
| A | 0 | 15 | 0 |
| B | 0 | 16 | 0 |
| C | 0 | 16 | 0 |
| D | 0 | 16 | 0 |
| Quadrant | Total seconds | Saturated seconds | Saturation percentage |
|---|---|---|---|
| A | 6397 | 59 | 0.922307% |
| B | 6397 | 62 | 0.969204% |
| C | 6397 | 130 | 2.032203% |
| D | 6397 | 342 | 5.346256% |
Noise dominated data is calculated using 1-second bins in cleaned event files. If a bin has >2000 counts, and if more than 50% of those come from <1% of pixels, then it is considered to be noise-dominated and hence unusable.
| Quadrant | # 1 sec bins | Bins with >0 counts | Bins with >2000 counts | High rate bins dominated by noise | Noise dominated (total time) | Noise dominated (detector-on time) | Marked lightcurve |
|---|---|---|---|---|---|---|---|
| A | 7602 | 6398 | 0 | 0 | 0.00% | 0.00% | 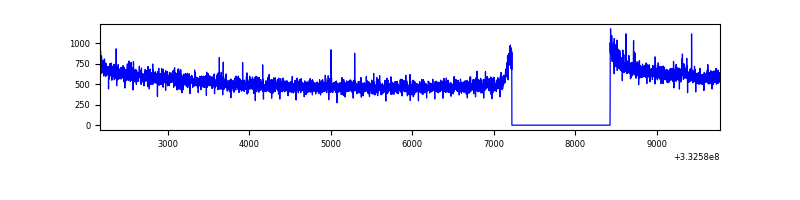 |
| B | 7602 | 6398 | 0 | 0 | 0.00% | 0.00% | 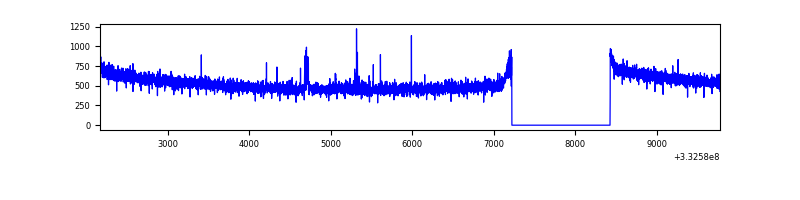 |
| C | 7602 | 6398 | 0 | 0 | 0.00% | 0.00% | 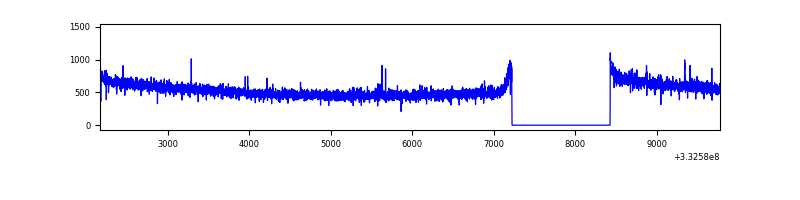 |
| D | 7602 | 6398 | 230 | 230 | 3.03% | 3.59% | 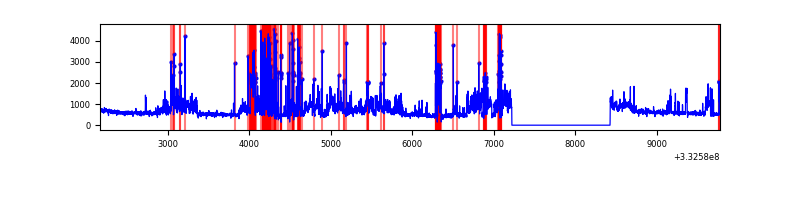 |
Top three noisy pixels from each quadrant. If the there are fewer than three noisy pixels in the level2.evt file, extra rows are filled as -1
| Pixel properties | Quadrant properties | ||||||
|---|---|---|---|---|---|---|---|
| Quadrant | DetID | PixID | Counts | Sigma | Mean | Median | Sigma |
| A | 0 | 13 | 29435 | 162.32 | 886 | 870 | 176.0 |
| A | 13 | 254 | 8844 | 45.31 | 886 | 870 | 176.0 |
| A | 3 | 137 | 7567 | 38.06 | 886 | 870 | 176.0 |
| B | 0 | 190 | 20324 | 119.93 | 863 | 843 | 162.4 |
| B | 12 | 111 | 19160 | 112.76 | 863 | 843 | 162.4 |
| B | 11 | 111 | 17545 | 102.82 | 863 | 843 | 162.4 |
| C | 14 | 238 | 138759 | 722.68 | 836 | 845 | 190.8 |
| C | 3 | 233 | 10563 | 50.92 | 836 | 845 | 190.8 |
| C | 2 | 16 | 7189 | 33.24 | 836 | 845 | 190.8 |
| D | 1 | 52 | 1531214 | 7778.99 | 837 | 819 | 196.7 |
| D | 7 | 80 | 256386 | 1299.05 | 837 | 819 | 196.7 |
| D | 12 | 1 | 96634 | 487.03 | 837 | 819 | 196.7 |
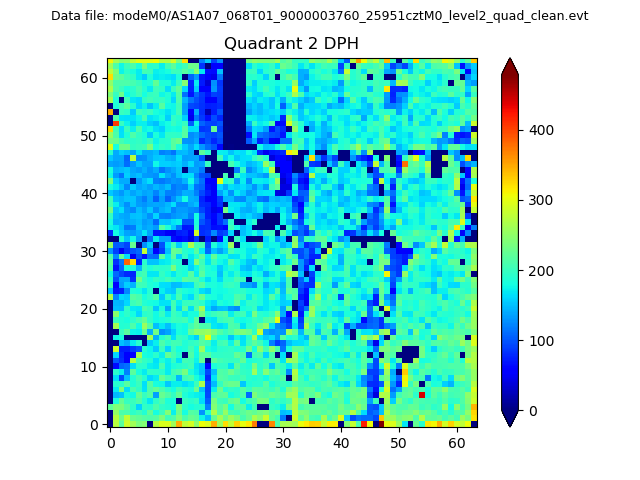
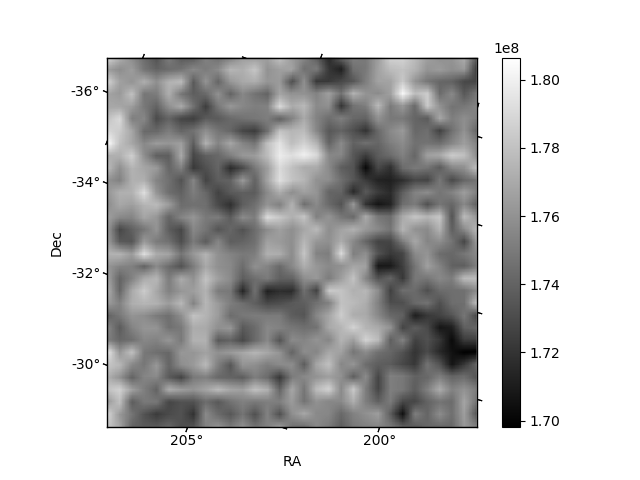
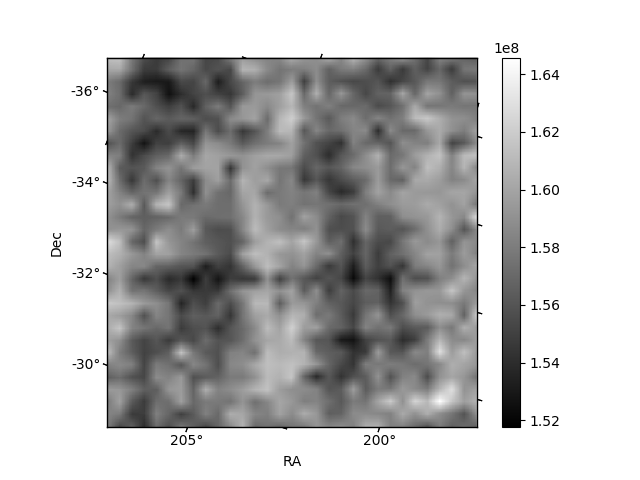
Histogram calculated using DETX and DETY for each event in the final _common_clean file
| Quadrant A | 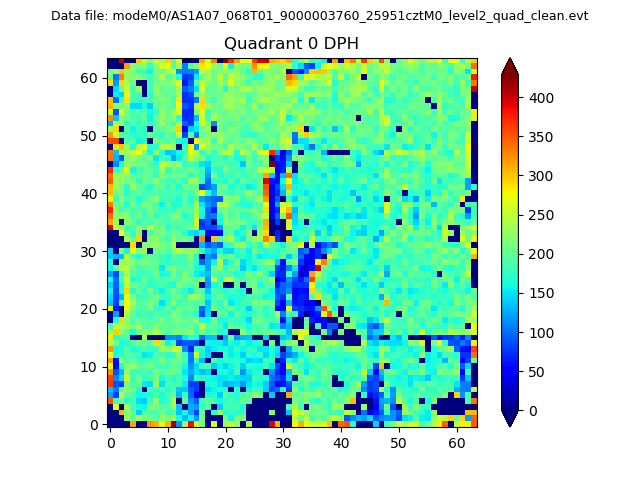 |
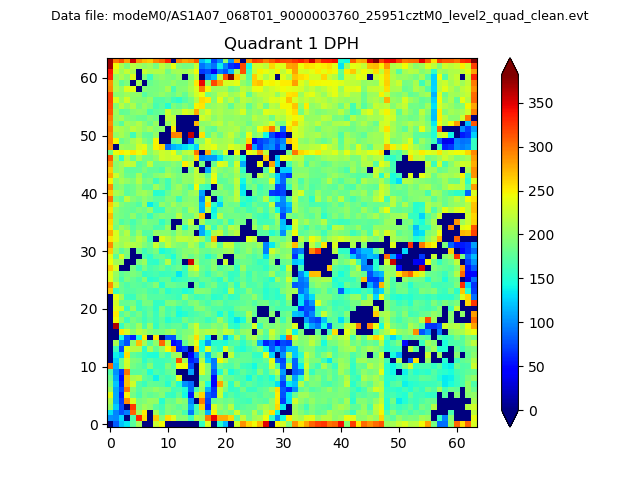 |
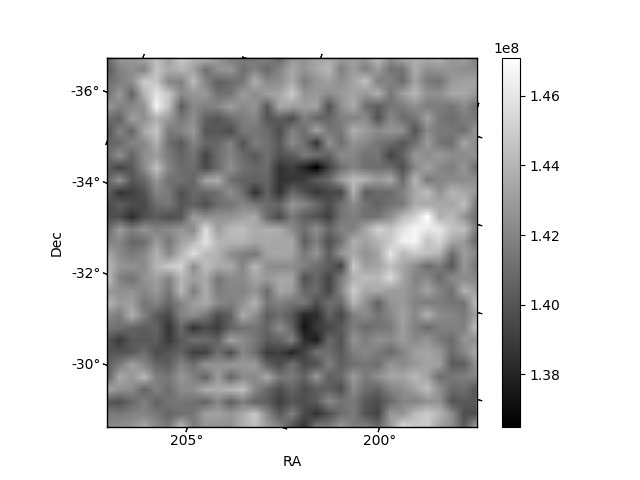
Quadrant B |
|---|---|---|---|
| Quadrant D | 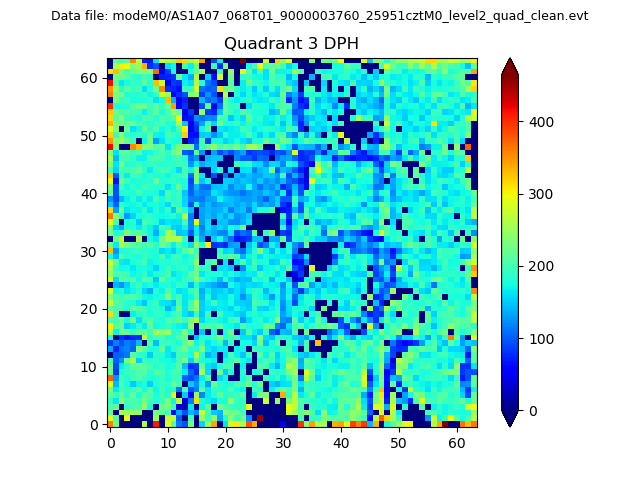 |
 |
Quadrant C |
| Plot type | Count rate plots | Images |
|---|---|---|
| Comparison with Poisson distribution Blue bars denote a histogram of data divided into 1 sec bins. Red curve is a Poisson curve with rate = median count rate of data. |
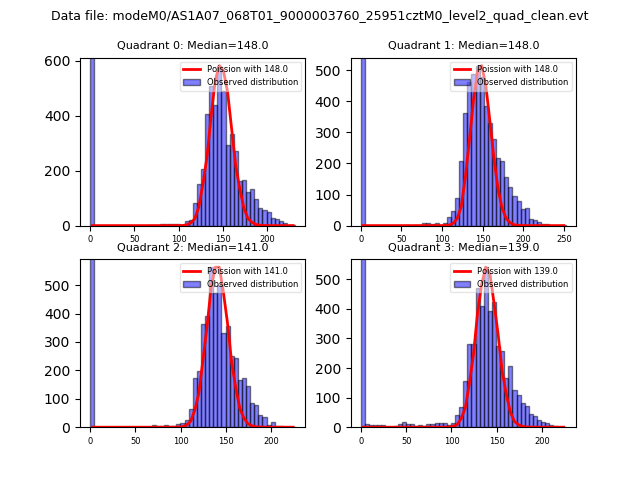 |
 |
| Quadrant-wise count rates Data is divided into 100 sec bins |
 |
|
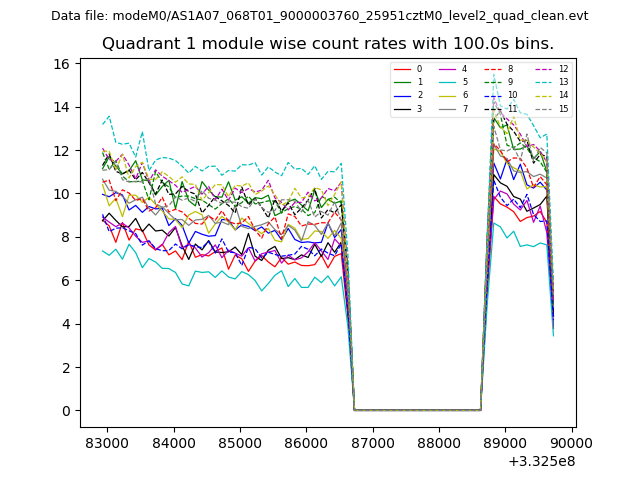
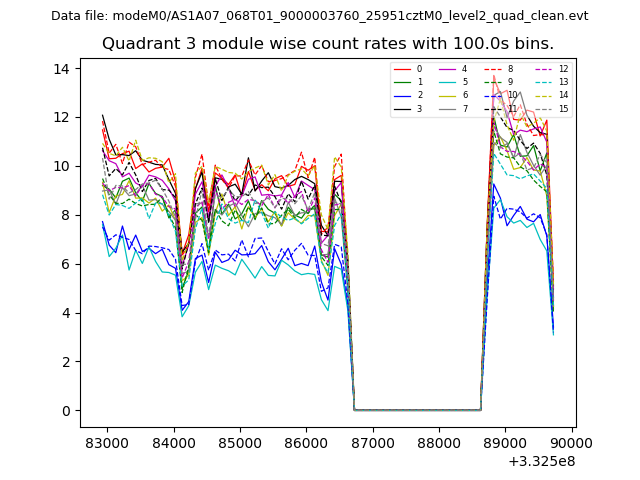
| Module-wise count rates for Quadrant A Data is divided into 100 sec bins |
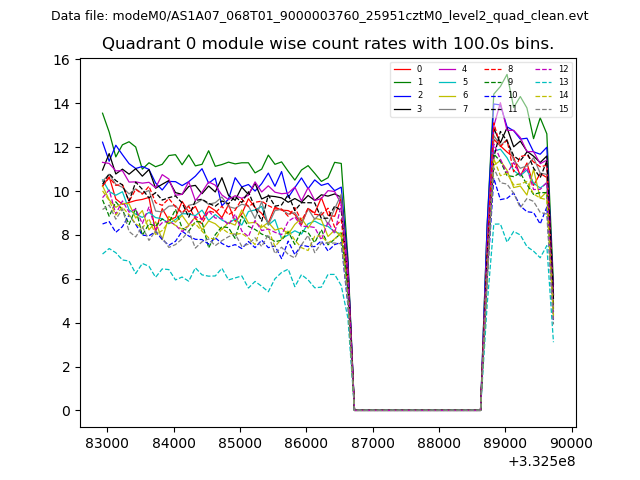 |
 |
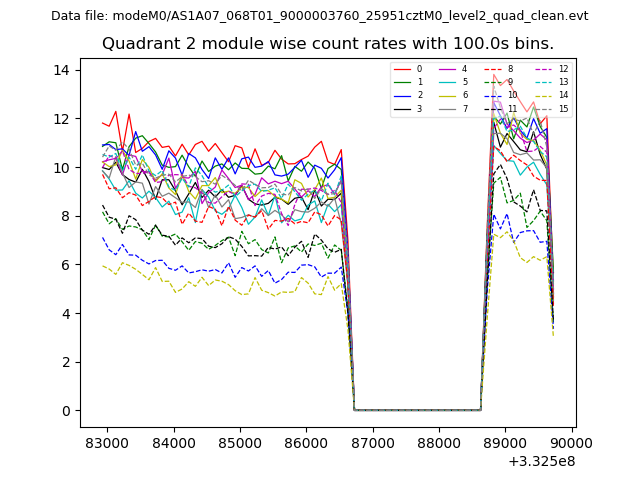
| Module-wise count rates for Quadrant B Data is divided into 100 sec bins |
 |
 |
| Module-wise count rates for Quadrant C Data is divided into 100 sec bins |
 |
 |
| Module-wise count rates for Quadrant D Data is divided into 100 sec bins |
 |
 |
| Parameter | Plot |
|---|---|
| CZT HV Monitor | 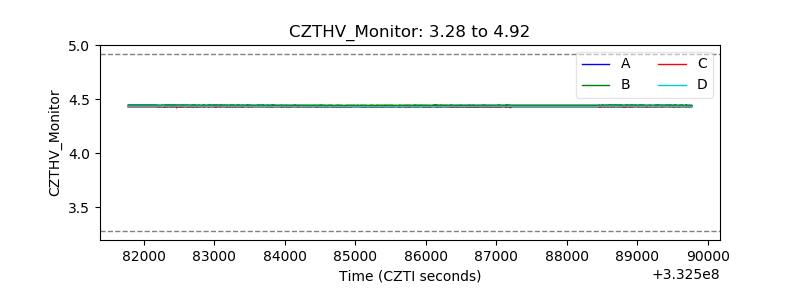 |
| D_VDD | 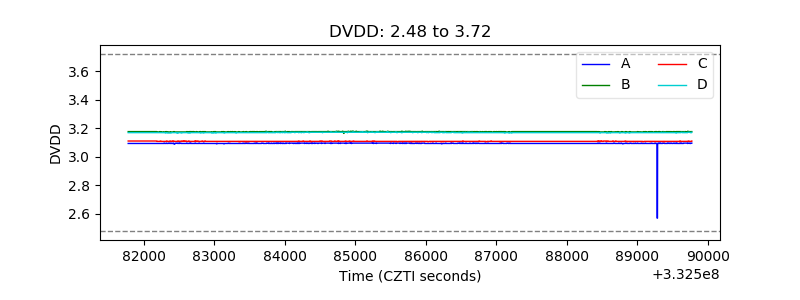 |
| Temperature 1 | 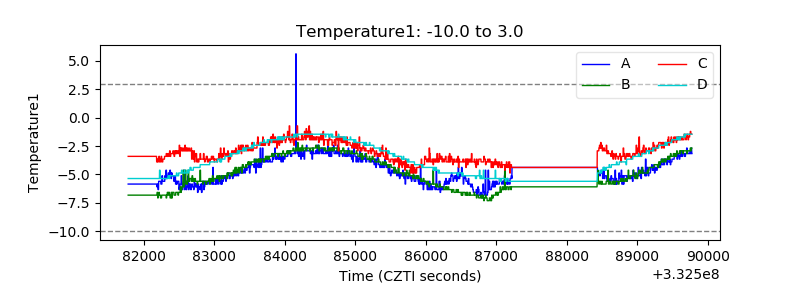 |
| Veto HV Monitor | 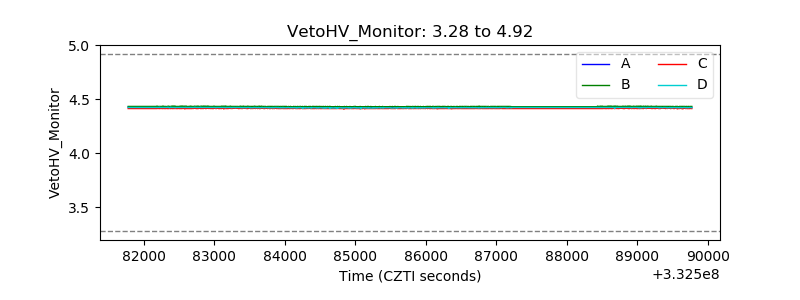 |
| Veto LLD | 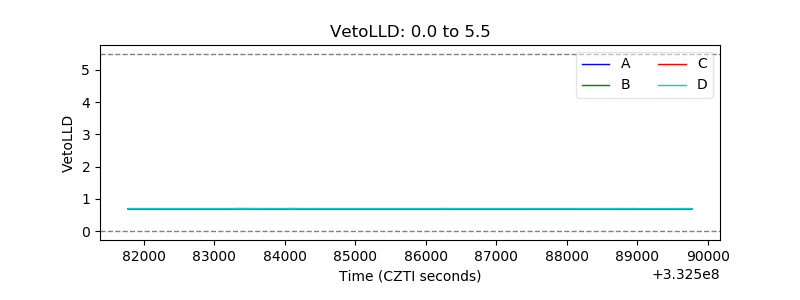 |
| Alpha Counter | 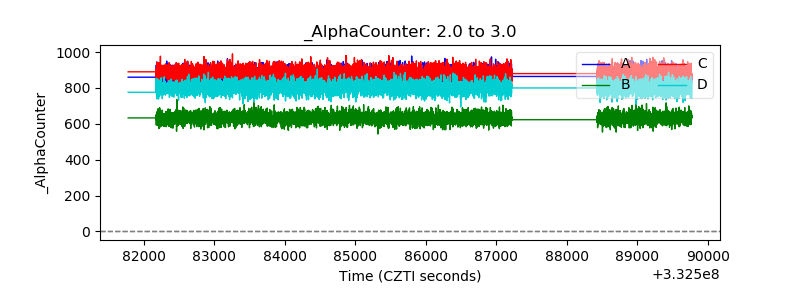 |
| _CPM_Rate | 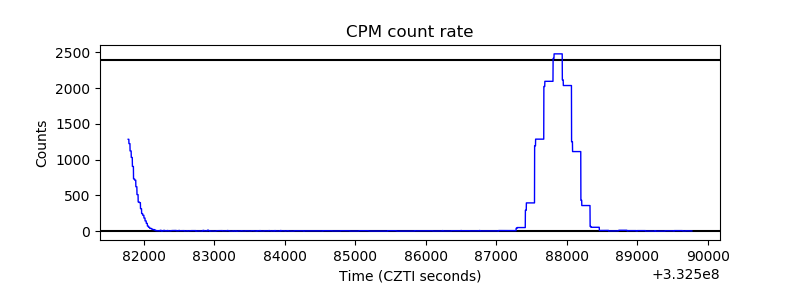 |
| CZT Counter | 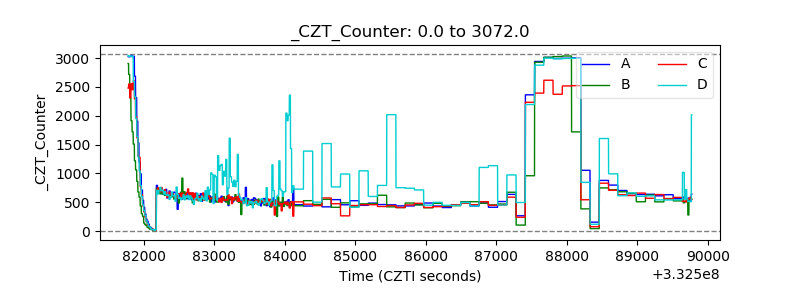 |
| +2.5 Volts monitor |  |
| +5 Volts monitor |  |
| _ROLL_ROT | 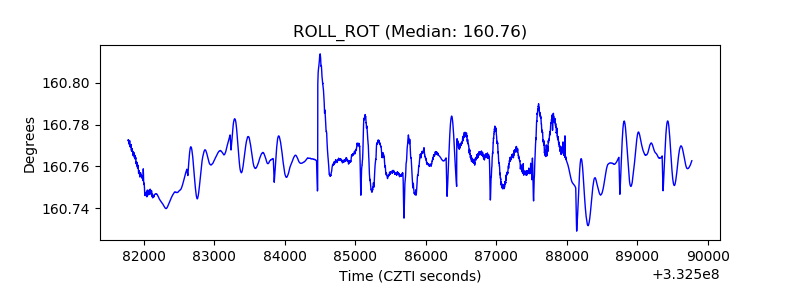 |
| _Roll_DEC | 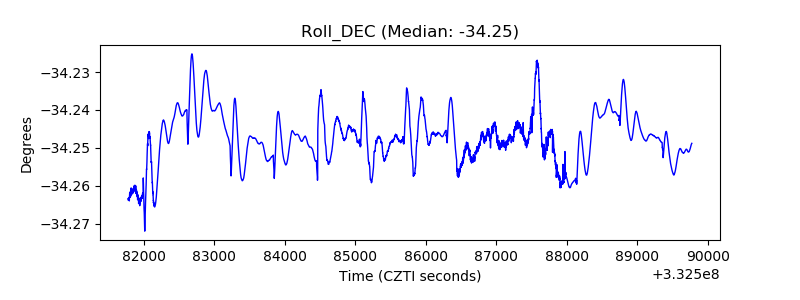 |
| _Roll_RA | 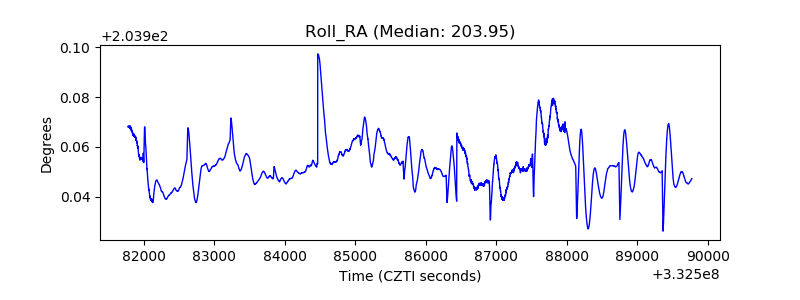 |
| Veto Counter | 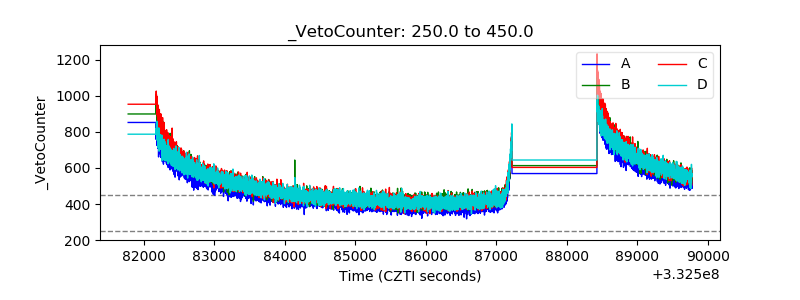 |