| Param | Original file | Final file |
|---|---|---|
| Filename | modeM0/AS1A07_068T01_9000003760_25952cztM0_level2.evt | modeM0/AS1A07_068T01_9000003760_25952cztM0_level2_quad_clean.evt |
| Size (bytes) | 496,630,080 | 123,336,000 |
| Size | 473.6 MB | 117.6 MB |
| Events in quadrant A | 3,584,562 | 848,660 |
| Events in quadrant B | 3,477,157 | 845,510 |
| Events in quadrant C | 3,507,953 | 794,777 |
| Events in quadrant D | 4,038,916 | 802,635 |
| Mode M0 | |||
|---|---|---|---|
| Quadrant | BADHDUFLAG | Total packets | Discarded packets |
| A | 0 | 14922 | 0 |
| B | 0 | 14484 | 0 |
| C | 0 | 14721 | 0 |
| D | 0 | 16274 | 0 |
| Mode M9 | |||
|---|---|---|---|
| Quadrant | BADHDUFLAG | Total packets | Discarded packets |
| A | 0 | 16 | 0 |
| B | 0 | 17 | 0 |
| C | 0 | 17 | 0 |
| D | 0 | 17 | 0 |
| Quadrant | Total seconds | Saturated seconds | Saturation percentage |
|---|---|---|---|
| A | 6362 | 113 | 1.776171% |
| B | 6362 | 110 | 1.729016% |
| C | 6362 | 159 | 2.499214% |
| D | 6361 | 140 | 2.200912% |
Noise dominated data is calculated using 1-second bins in cleaned event files. If a bin has >2000 counts, and if more than 50% of those come from <1% of pixels, then it is considered to be noise-dominated and hence unusable.
| Quadrant | # 1 sec bins | Bins with >0 counts | Bins with >2000 counts | High rate bins dominated by noise | Noise dominated (total time) | Noise dominated (detector-on time) | Marked lightcurve |
|---|---|---|---|---|---|---|---|
| A | 7602 | 6362 | 0 | 0 | 0.00% | 0.00% | 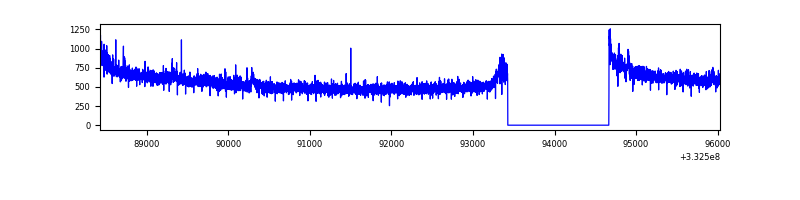 |
| B | 7602 | 6362 | 0 | 0 | 0.00% | 0.00% | 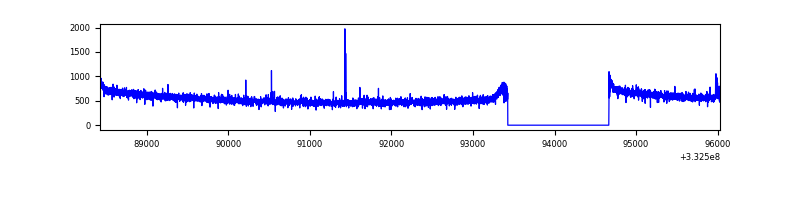 |
| C | 7602 | 6362 | 0 | 0 | 0.00% | 0.00% | 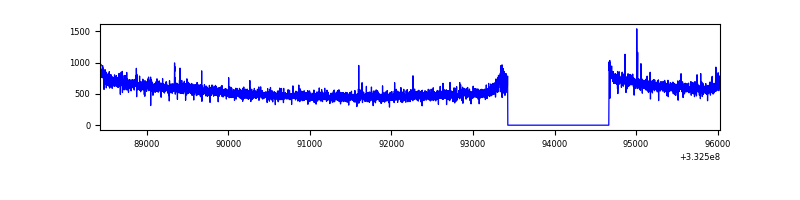 |
| D | 7601 | 6361 | 49 | 49 | 0.64% | 0.77% | 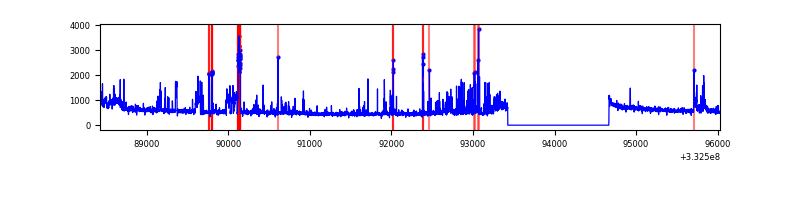 |
Top three noisy pixels from each quadrant. If the there are fewer than three noisy pixels in the level2.evt file, extra rows are filled as -1
| Pixel properties | Quadrant properties | ||||||
|---|---|---|---|---|---|---|---|
| Quadrant | DetID | PixID | Counts | Sigma | Mean | Median | Sigma |
| A | 0 | 13 | 40236 | 216.96 | 915 | 899 | 181.3 |
| A | 12 | 16 | 19339 | 101.7 | 915 | 899 | 181.3 |
| A | 13 | 254 | 9584 | 47.9 | 915 | 899 | 181.3 |
| B | 12 | 111 | 19301 | 111.29 | 884 | 865 | 165.7 |
| B | 11 | 111 | 17742 | 101.88 | 884 | 865 | 165.7 |
| B | 0 | 190 | 16520 | 94.5 | 884 | 865 | 165.7 |
| C | 14 | 238 | 140203 | 714.95 | 851 | 857 | 194.9 |
| C | 3 | 233 | 33380 | 166.87 | 851 | 857 | 194.9 |
| C | 15 | 127 | 5723 | 24.97 | 851 | 857 | 194.9 |
| D | 1 | 52 | 612798 | 2945.46 | 881 | 864 | 207.8 |
| D | 12 | 1 | 42050 | 198.24 | 881 | 864 | 207.8 |
| D | 2 | 234 | 23956 | 111.15 | 881 | 864 | 207.8 |
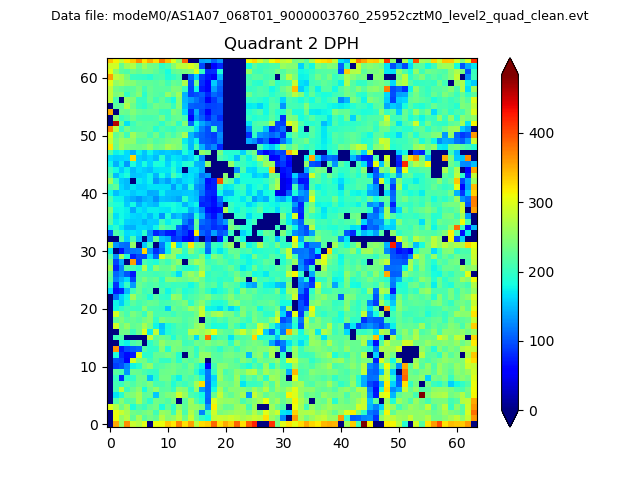
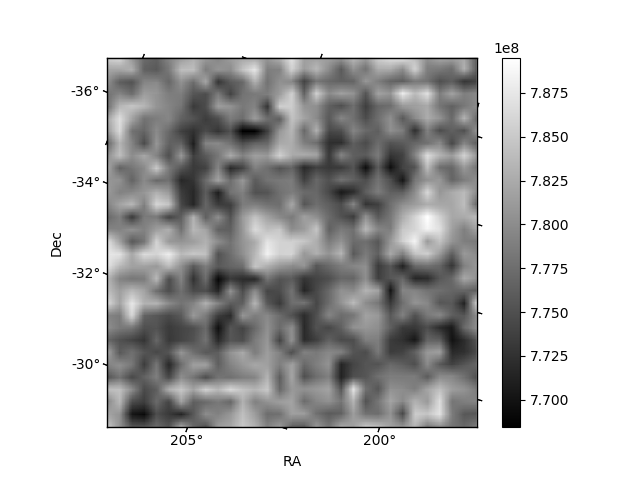
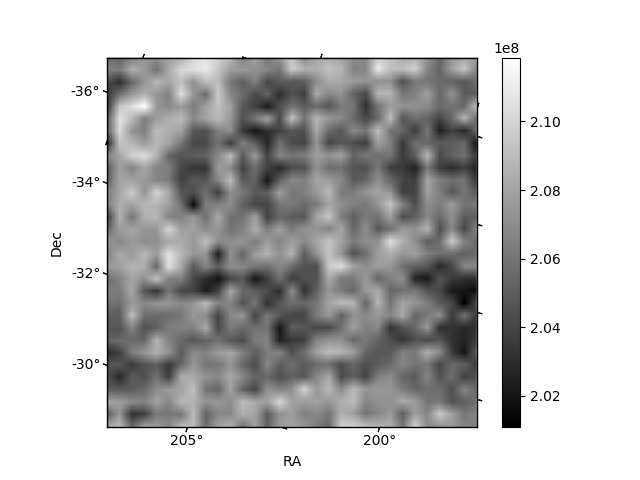
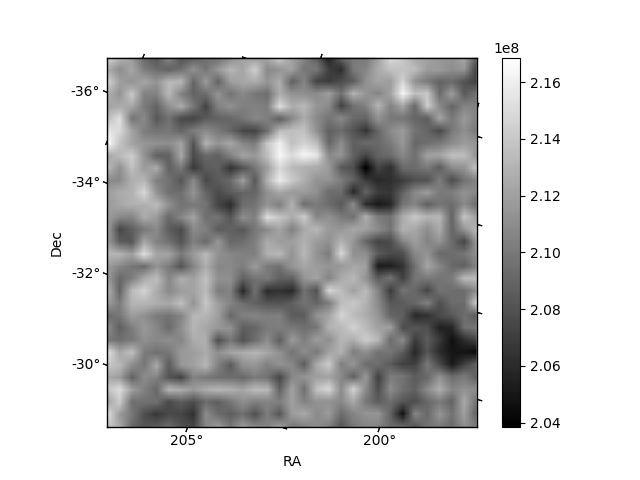
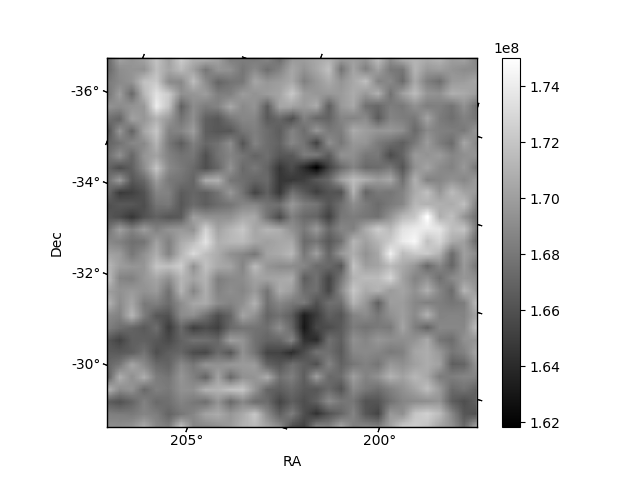
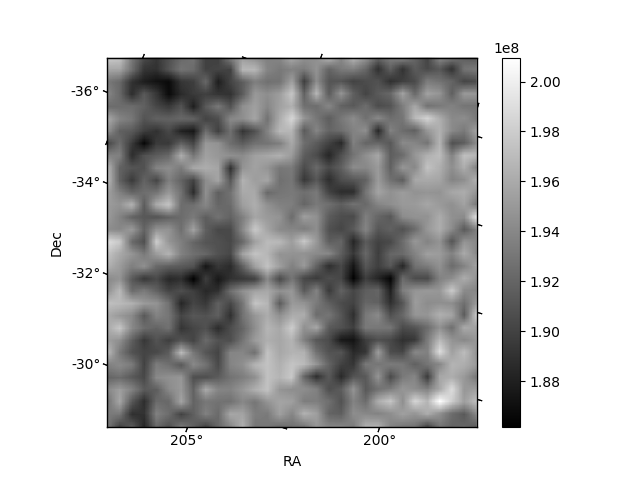
Histogram calculated using DETX and DETY for each event in the final _common_clean file
| Quadrant A | 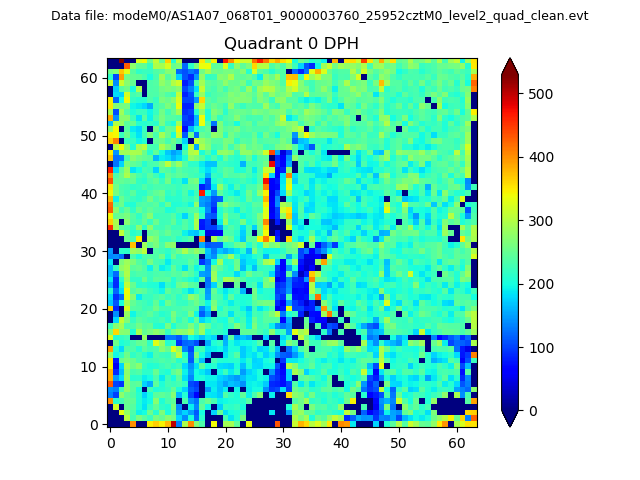 |
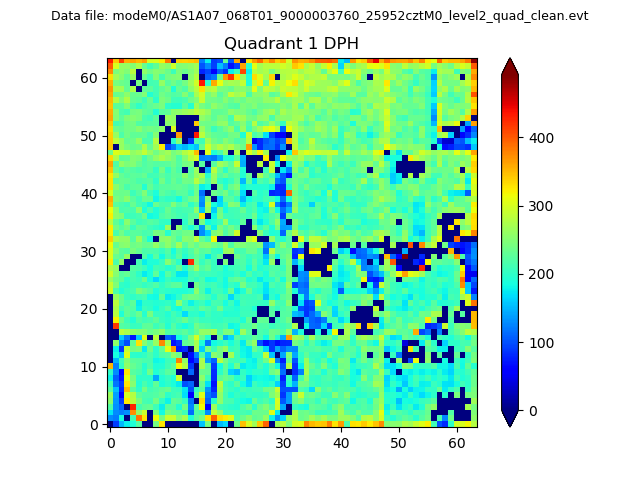 |
Quadrant B |
|---|---|---|---|
| Quadrant D | 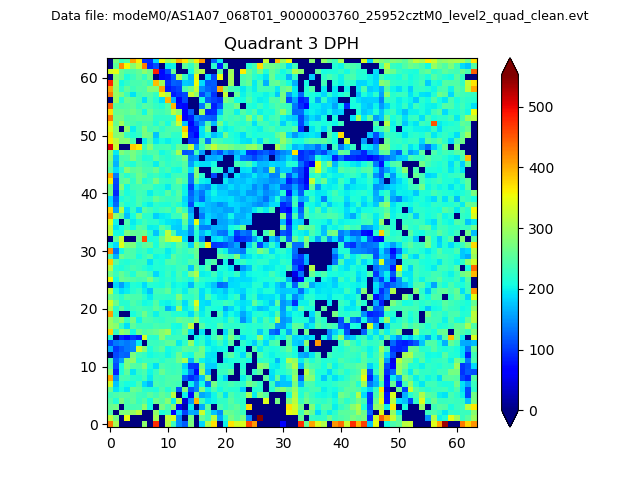 |
 |
Quadrant C |
| Plot type | Count rate plots | Images |
|---|---|---|
| Comparison with Poisson distribution Blue bars denote a histogram of data divided into 1 sec bins. Red curve is a Poisson curve with rate = median count rate of data. |
 |
 |
| Quadrant-wise count rates Data is divided into 100 sec bins |
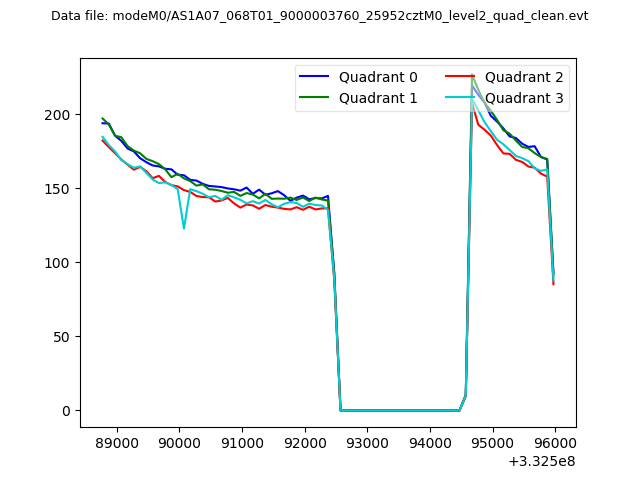 |
|
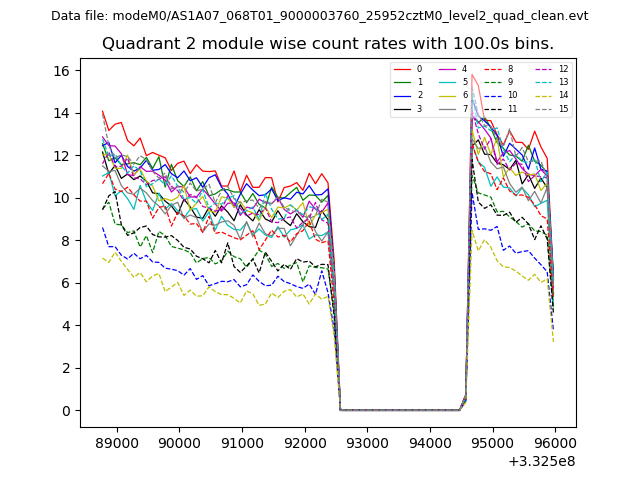
| Module-wise count rates for Quadrant A Data is divided into 100 sec bins |
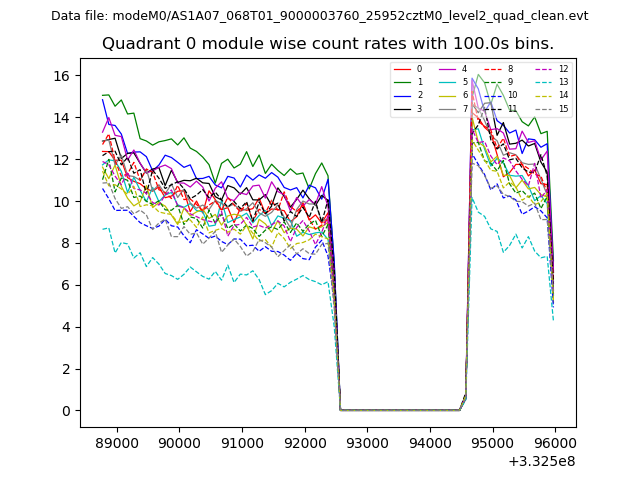 |
 |
| Module-wise count rates for Quadrant B Data is divided into 100 sec bins |
 |
 |
| Module-wise count rates for Quadrant C Data is divided into 100 sec bins |
 |
 |
| Module-wise count rates for Quadrant D Data is divided into 100 sec bins |
 |
 |
| Parameter | Plot |
|---|---|
| CZT HV Monitor | 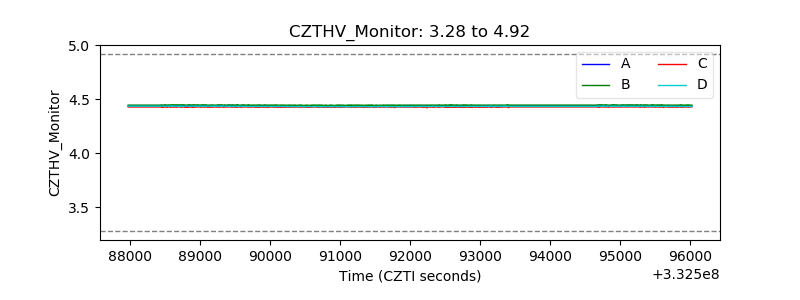 |
| D_VDD | 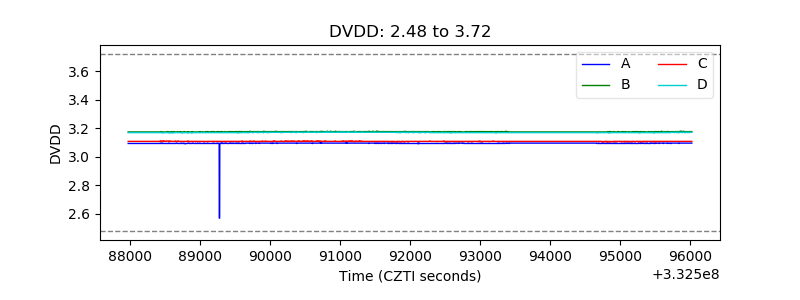 |
| Temperature 1 | 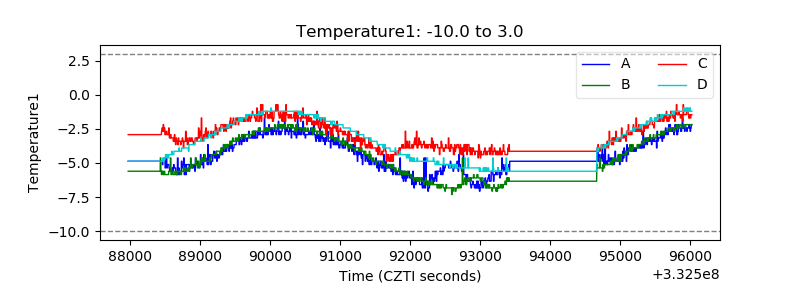 |
| Veto HV Monitor | 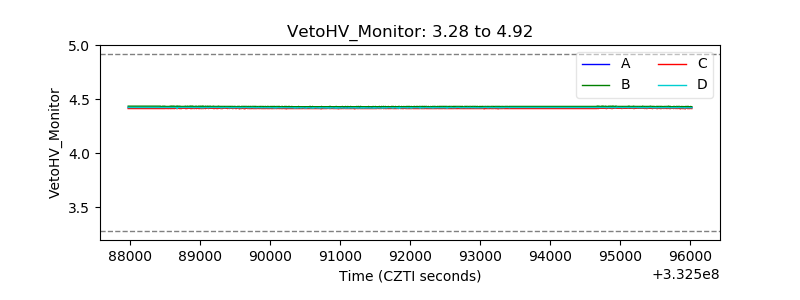 |
| Veto LLD | 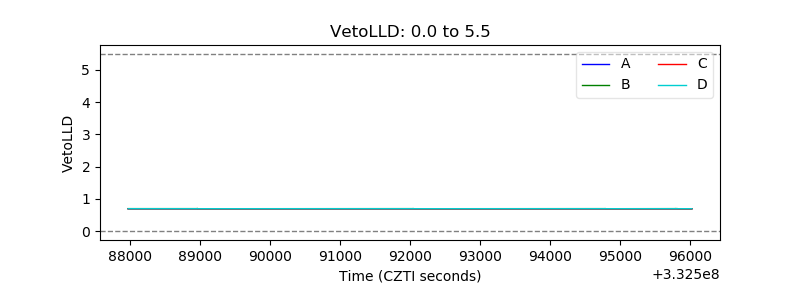 |
| Alpha Counter | 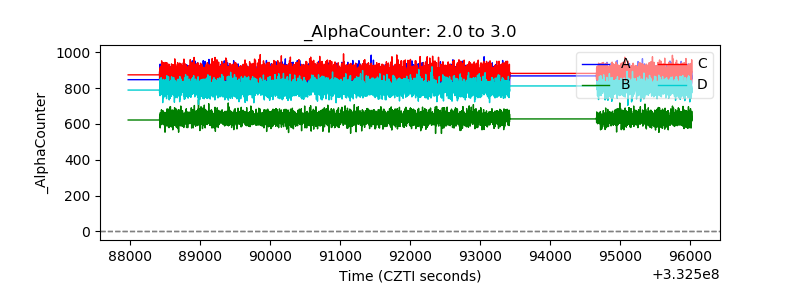 |
| _CPM_Rate | 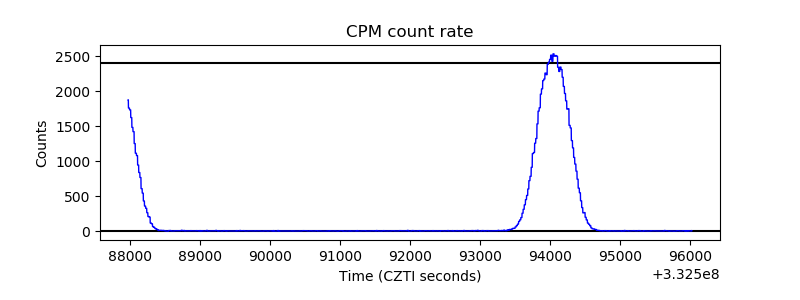 |
| CZT Counter | 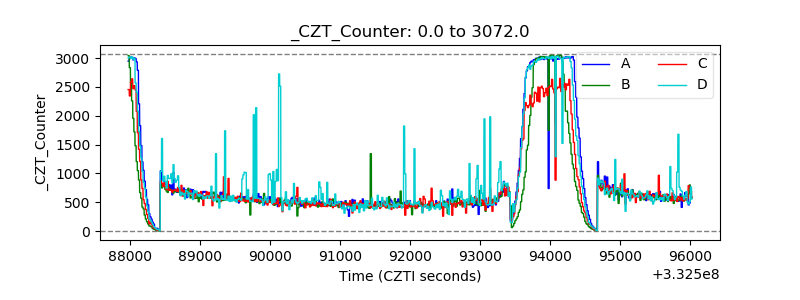 |
| +2.5 Volts monitor |  |
| +5 Volts monitor |  |
| _ROLL_ROT | 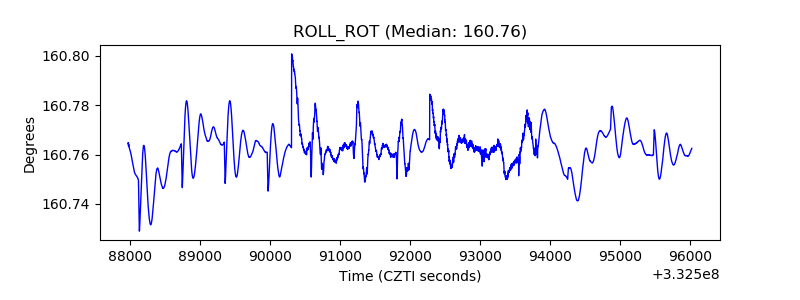 |
| _Roll_DEC | 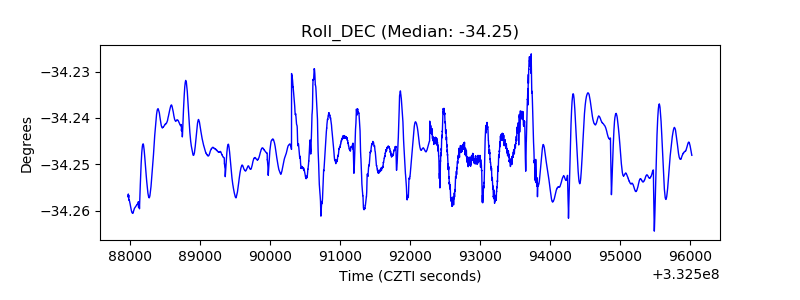 |
| _Roll_RA | 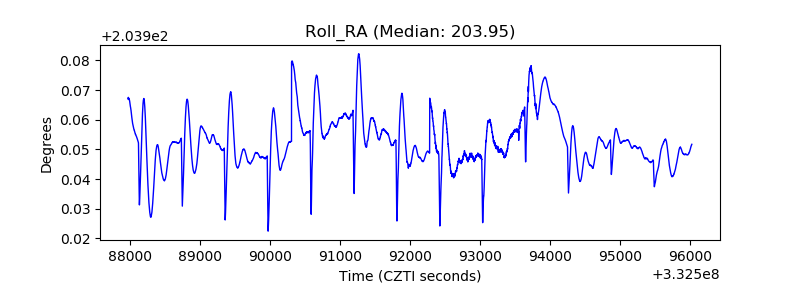 |
| Veto Counter |  |