| Param | Original file | Final file |
|---|---|---|
| Filename | modeM0/AS1A07_068T01_9000003760_25953cztM0_level2.evt | modeM0/AS1A07_068T01_9000003760_25953cztM0_level2_quad_clean.evt |
| Size (bytes) | 546,840,000 | 119,456,640 |
| Size | 521.5 MB | 113.9 MB |
| Events in quadrant A | 3,514,675 | 845,558 |
| Events in quadrant B | 3,424,419 | 834,806 |
| Events in quadrant C | 3,400,824 | 781,790 |
| Events in quadrant D | 5,793,278 | 715,376 |
| Mode M0 | |||
|---|---|---|---|
| Quadrant | BADHDUFLAG | Total packets | Discarded packets |
| A | 0 | 14600 | 0 |
| B | 0 | 14222 | 0 |
| C | 0 | 14213 | 0 |
| D | 0 | 21506 | 0 |
| Mode M9 | |||
|---|---|---|---|
| Quadrant | BADHDUFLAG | Total packets | Discarded packets |
| A | 0 | 13 | 0 |
| B | 0 | 13 | 0 |
| C | 0 | 13 | 0 |
| D | 0 | 13 | 0 |
| Quadrant | Total seconds | Saturated seconds | Saturation percentage |
|---|---|---|---|
| A | 6307 | 121 | 1.918503% |
| B | 6308 | 116 | 1.838935% |
| C | 6307 | 152 | 2.410021% |
| D | 6307 | 1026 | 16.267639% |
Noise dominated data is calculated using 1-second bins in cleaned event files. If a bin has >2000 counts, and if more than 50% of those come from <1% of pixels, then it is considered to be noise-dominated and hence unusable.
| Quadrant | # 1 sec bins | Bins with >0 counts | Bins with >2000 counts | High rate bins dominated by noise | Noise dominated (total time) | Noise dominated (detector-on time) | Marked lightcurve |
|---|---|---|---|---|---|---|---|
| A | 7587 | 6308 | 1 | 1 | 0.01% | 0.02% | 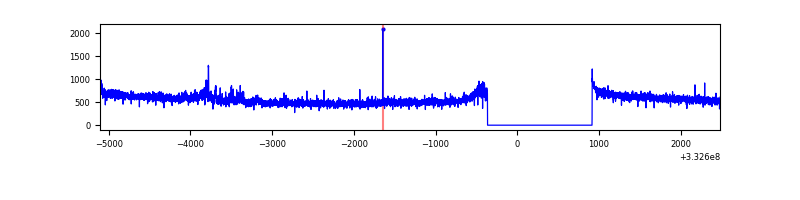 |
| B | 7588 | 6309 | 2 | 2 | 0.03% | 0.03% | 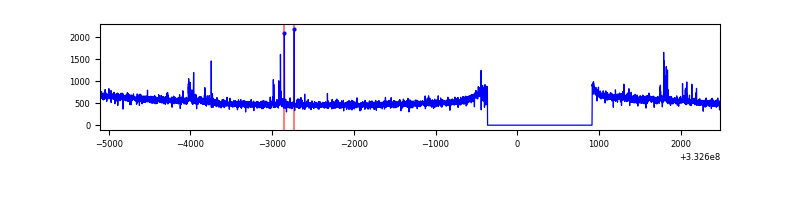 |
| C | 7587 | 6308 | 0 | 0 | 0.00% | 0.00% | 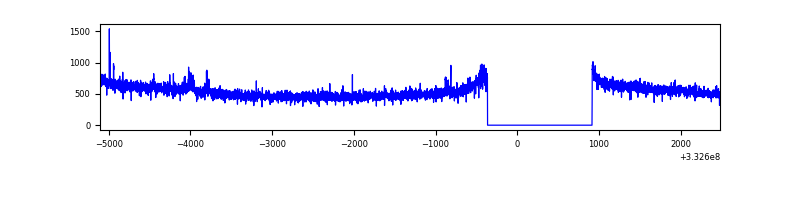 |
| D | 7587 | 6308 | 753 | 753 | 9.92% | 11.94% | 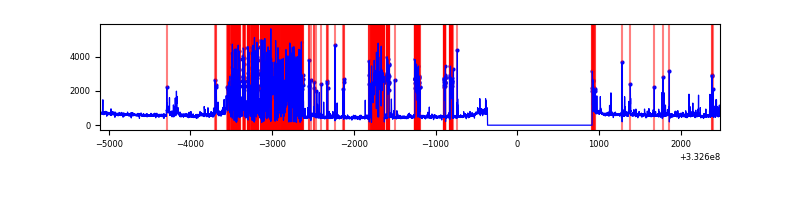 |
Top three noisy pixels from each quadrant. If the there are fewer than three noisy pixels in the level2.evt file, extra rows are filled as -1
| Pixel properties | Quadrant properties | ||||||
|---|---|---|---|---|---|---|---|
| Quadrant | DetID | PixID | Counts | Sigma | Mean | Median | Sigma |
| A | 12 | 16 | 57074 | 317.36 | 891 | 874 | 177.1 |
| A | 12 | 194 | 15142 | 80.57 | 891 | 874 | 177.1 |
| A | 3 | 1 | 10985 | 57.1 | 891 | 874 | 177.1 |
| B | 0 | 190 | 58915 | 358.93 | 858 | 837 | 161.8 |
| B | 12 | 111 | 18433 | 108.75 | 858 | 837 | 161.8 |
| B | 11 | 111 | 16875 | 99.12 | 858 | 837 | 161.8 |
| C | 14 | 238 | 134901 | 710.94 | 822 | 829 | 188.6 |
| C | 3 | 233 | 53040 | 276.86 | 822 | 829 | 188.6 |
| C | 13 | 61 | 5386 | 24.16 | 822 | 829 | 188.6 |
| D | 1 | 52 | 2171567 | 11567.65 | 787 | 768 | 187.7 |
| D | 1 | 3 | 509310 | 2709.89 | 787 | 768 | 187.7 |
| D | 7 | 80 | 89493 | 472.79 | 787 | 768 | 187.7 |
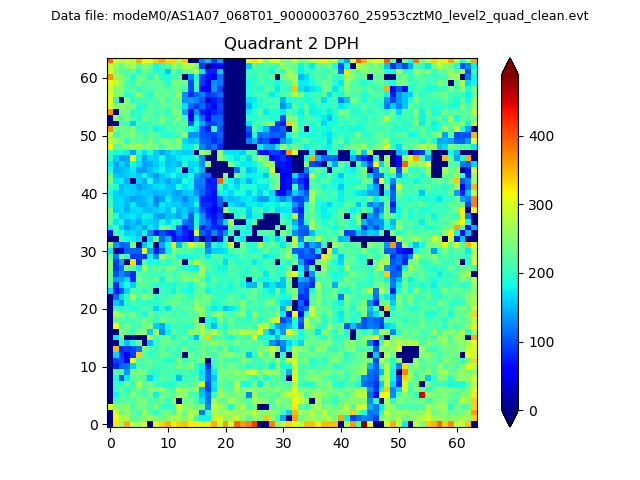
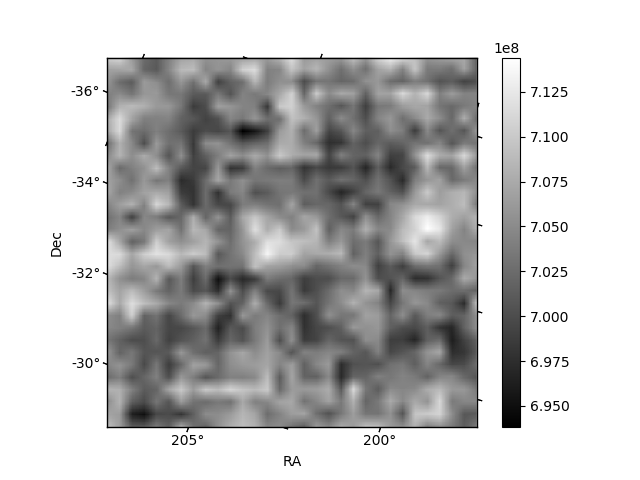
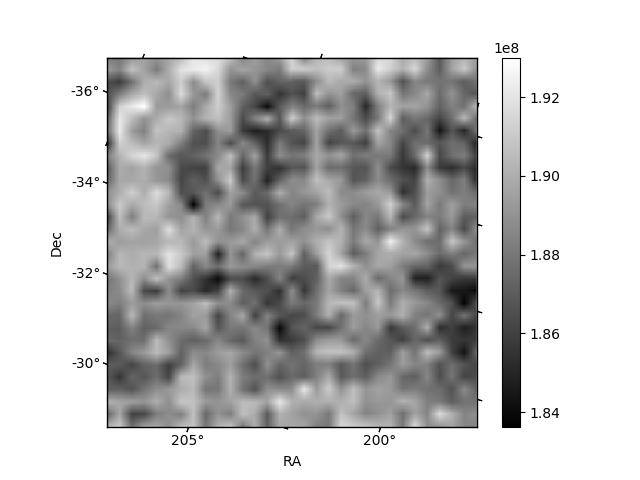
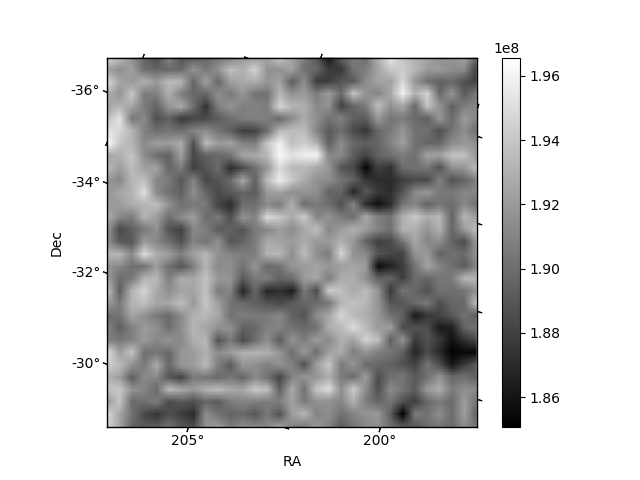
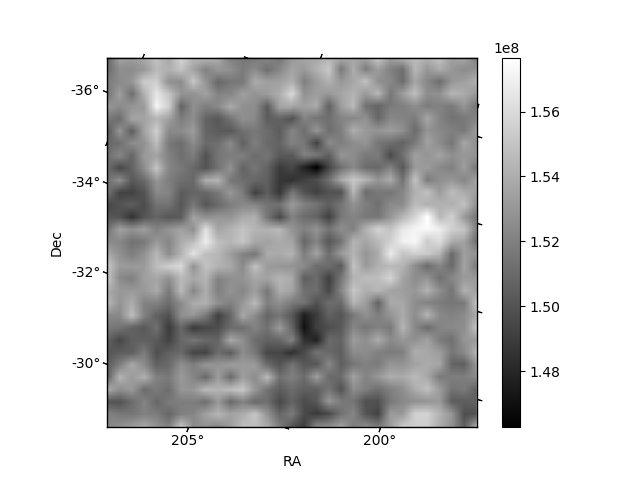
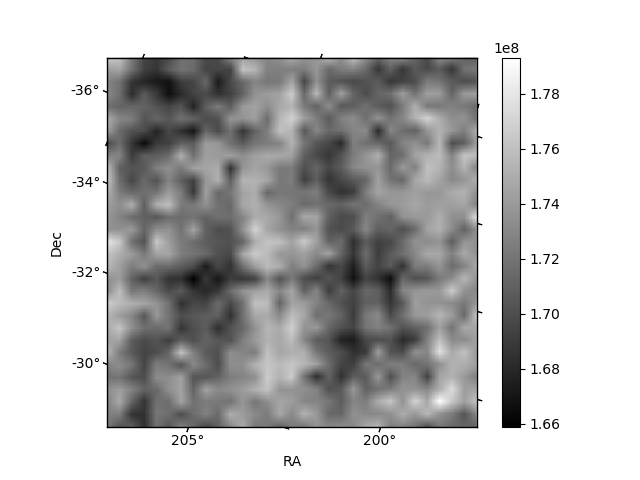
Histogram calculated using DETX and DETY for each event in the final _common_clean file
| Quadrant A | 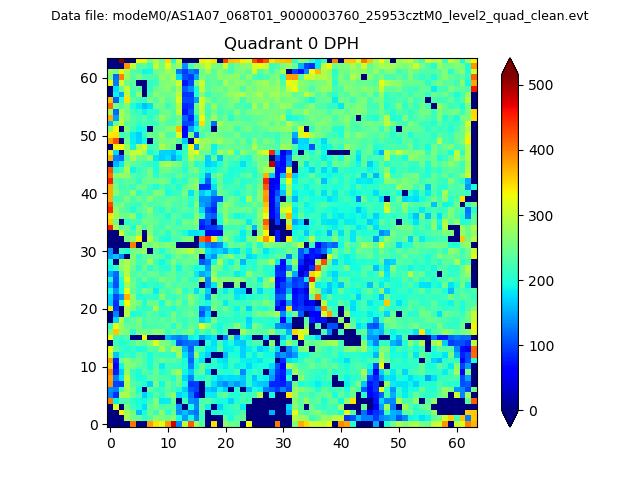 |
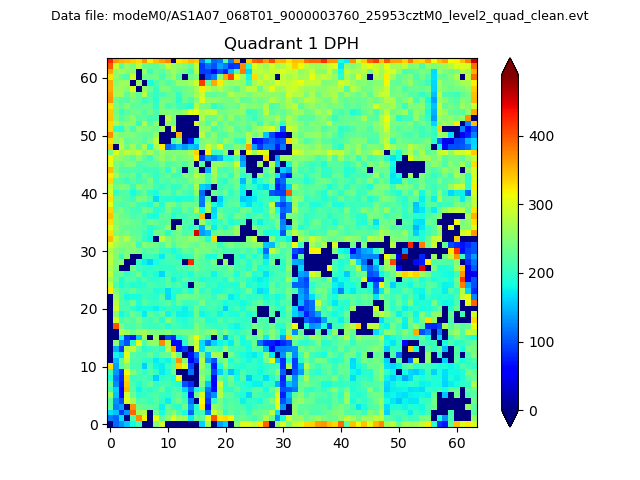 |
Quadrant B |
|---|---|---|---|
| Quadrant D | 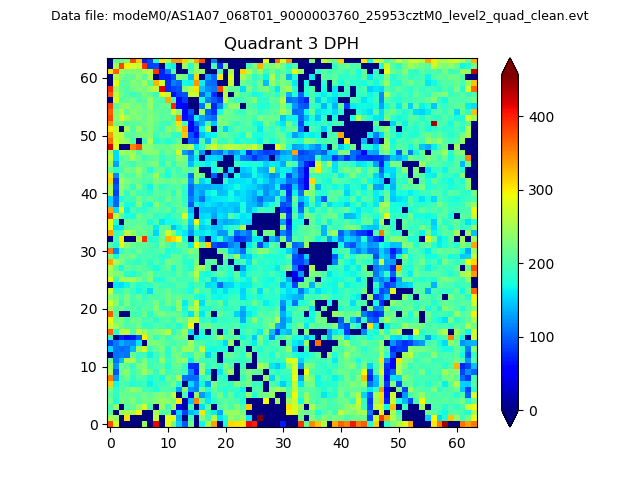 |
 |
Quadrant C |
| Plot type | Count rate plots | Images |
|---|---|---|
| Comparison with Poisson distribution Blue bars denote a histogram of data divided into 1 sec bins. Red curve is a Poisson curve with rate = median count rate of data. |
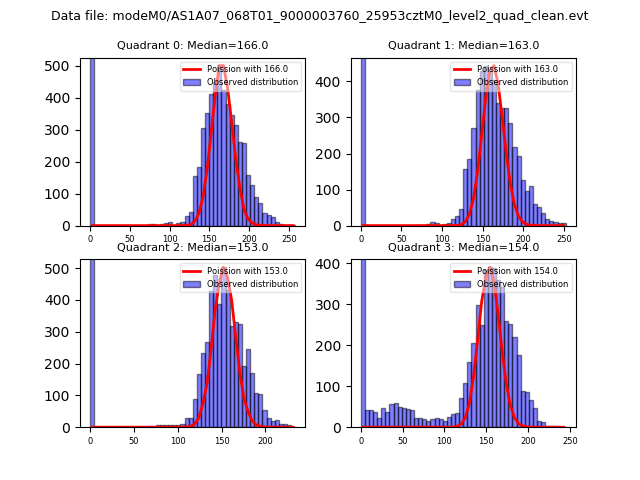 |
 |
| Quadrant-wise count rates Data is divided into 100 sec bins |
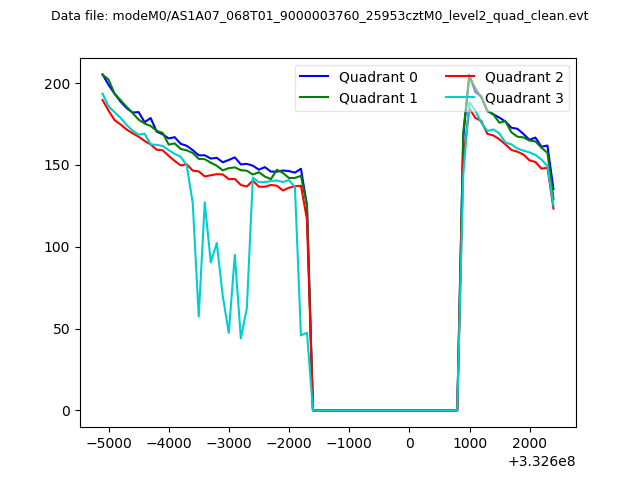 |
|
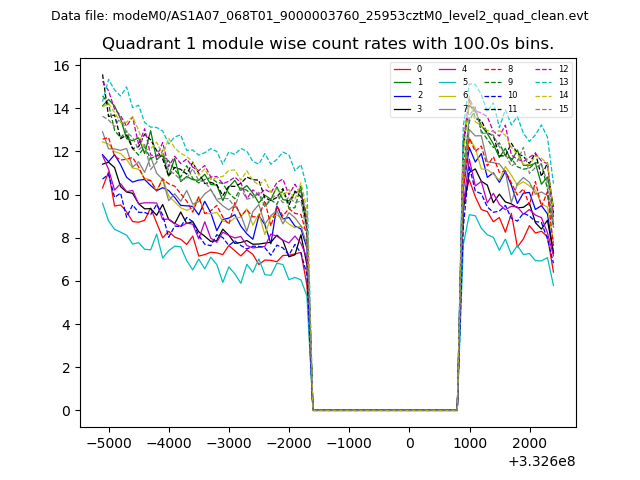
| Module-wise count rates for Quadrant A Data is divided into 100 sec bins |
 |
 |
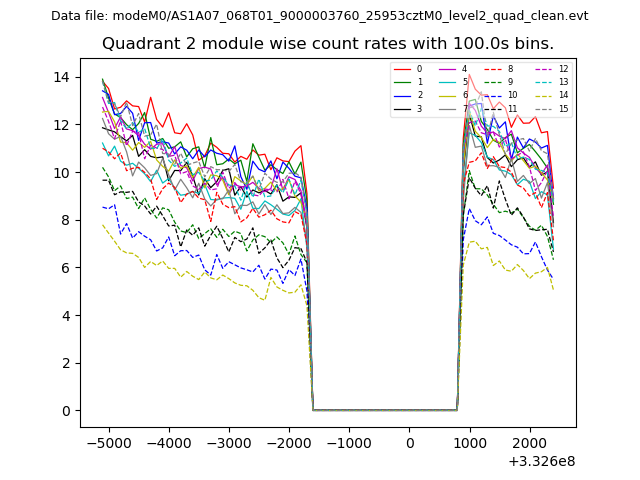
| Module-wise count rates for Quadrant B Data is divided into 100 sec bins |
 |
 |
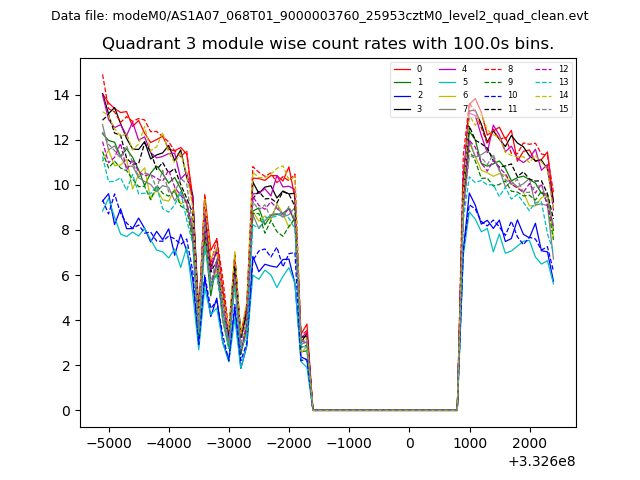
| Module-wise count rates for Quadrant C Data is divided into 100 sec bins |
 |
 |
| Module-wise count rates for Quadrant D Data is divided into 100 sec bins |
 |
 |
| Parameter | Plot |
|---|---|
| CZT HV Monitor | 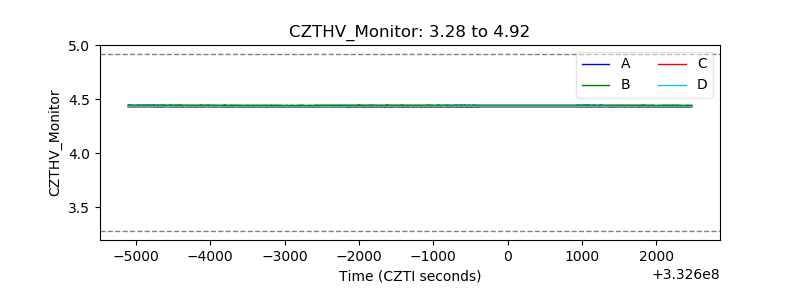 |
| D_VDD | 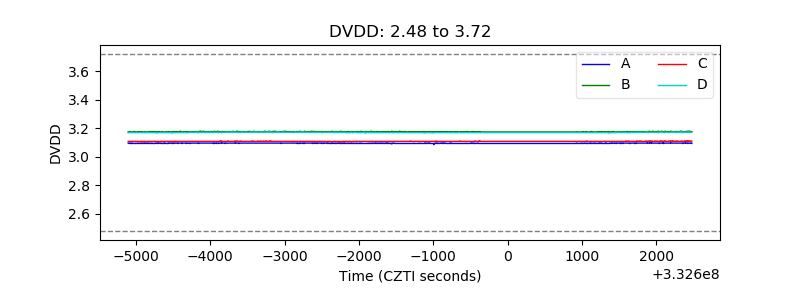 |
| Temperature 1 | 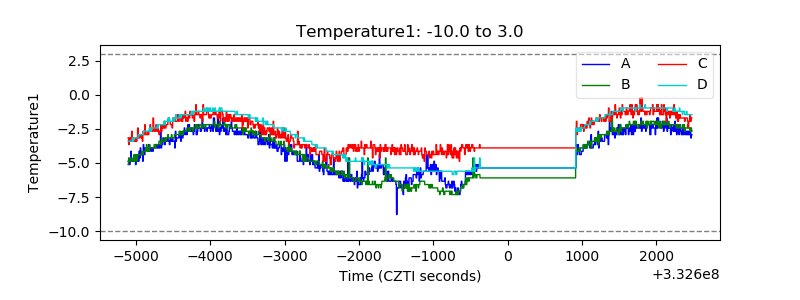 |
| Veto HV Monitor | 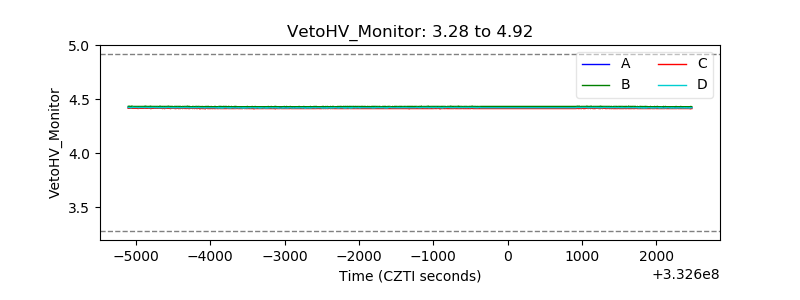 |
| Veto LLD | 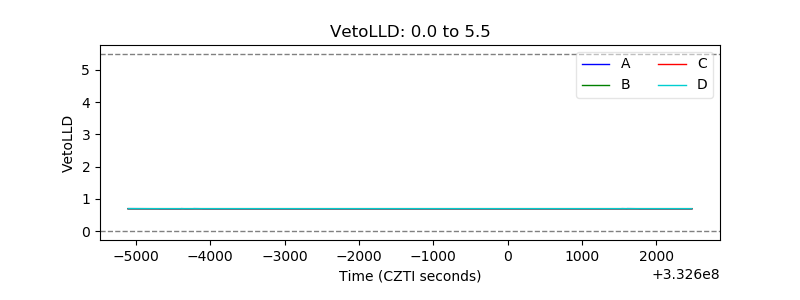 |
| Alpha Counter | 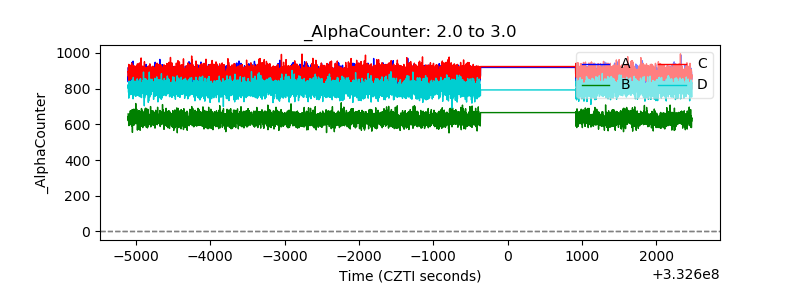 |
| _CPM_Rate | 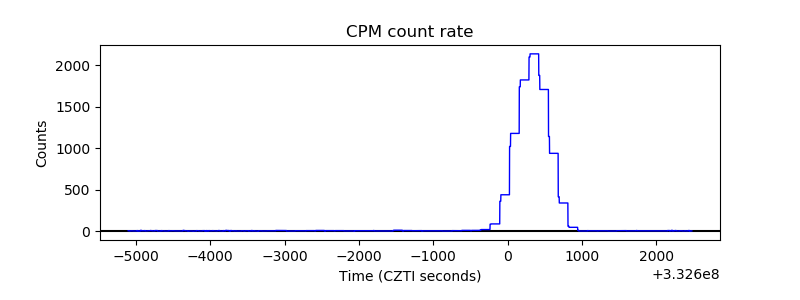 |
| CZT Counter | 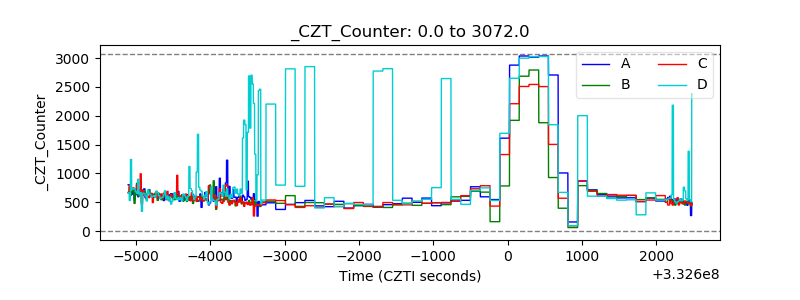 |
| +2.5 Volts monitor |  |
| +5 Volts monitor |  |
| _ROLL_ROT | 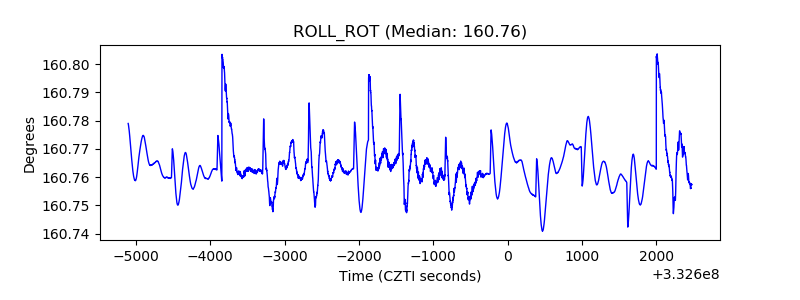 |
| _Roll_DEC | 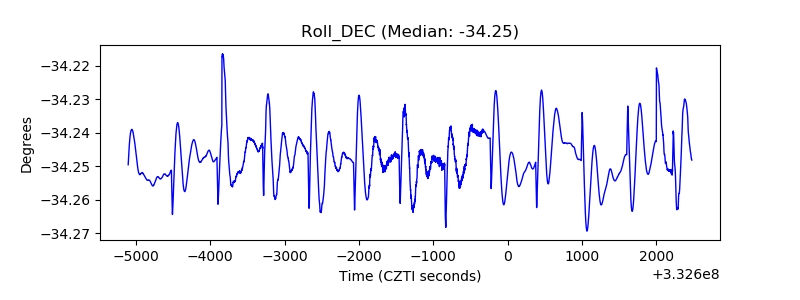 |
| _Roll_RA | 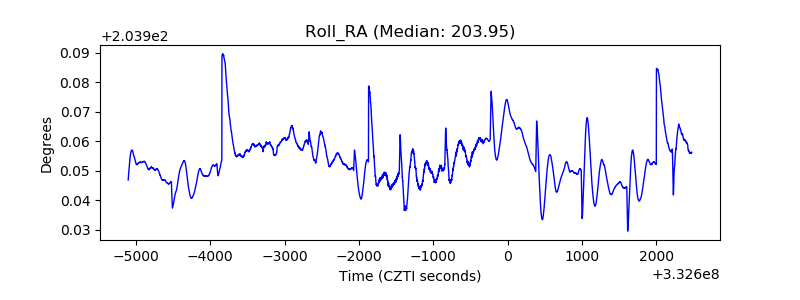 |
| Veto Counter | 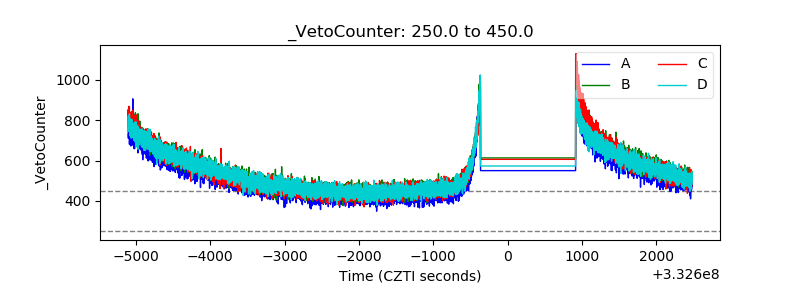 |