| Param | Original file | Final file |
|---|---|---|
| Filename | modeM0/AS1A07_068T01_9000003760_25954cztM0_level2.evt | modeM0/AS1A07_068T01_9000003760_25954cztM0_level2_quad_clean.evt |
| Size (bytes) | 465,511,680 | 102,925,440 |
| Size | 443.9 MB | 98.2 MB |
| Events in quadrant A | 3,273,365 | 700,689 |
| Events in quadrant B | 3,243,830 | 692,787 |
| Events in quadrant C | 3,120,562 | 647,039 |
| Events in quadrant D | 4,046,647 | 651,418 |
| Mode M0 | |||
|---|---|---|---|
| Quadrant | BADHDUFLAG | Total packets | Discarded packets |
| A | 0 | 13301 | 0 |
| B | 0 | 13390 | 0 |
| C | 0 | 13023 | 0 |
| D | 0 | 15994 | 0 |
| Mode M9 | |||
|---|---|---|---|
| Quadrant | BADHDUFLAG | Total packets | Discarded packets |
| A | 0 | 12 | 0 |
| B | 0 | 12 | 0 |
| C | 0 | 12 | 0 |
| D | 0 | 12 | 0 |
| Quadrant | Total seconds | Saturated seconds | Saturation percentage |
|---|---|---|---|
| A | 6089 | 116 | 1.905075% |
| B | 6090 | 133 | 2.183908% |
| C | 6090 | 130 | 2.134647% |
| D | 6090 | 225 | 3.694581% |
Noise dominated data is calculated using 1-second bins in cleaned event files. If a bin has >2000 counts, and if more than 50% of those come from <1% of pixels, then it is considered to be noise-dominated and hence unusable.
| Quadrant | # 1 sec bins | Bins with >0 counts | Bins with >2000 counts | High rate bins dominated by noise | Noise dominated (total time) | Noise dominated (detector-on time) | Marked lightcurve |
|---|---|---|---|---|---|---|---|
| A | 7339 | 6090 | 0 | 0 | 0.00% | 0.00% | 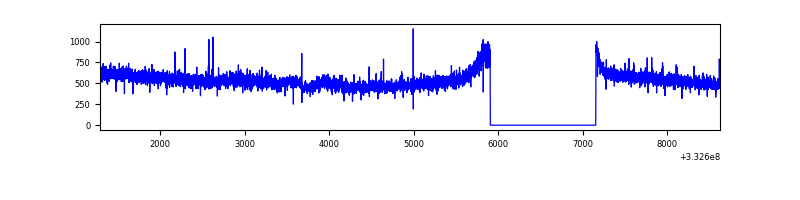 |
| B | 7340 | 6091 | 12 | 12 | 0.16% | 0.20% | 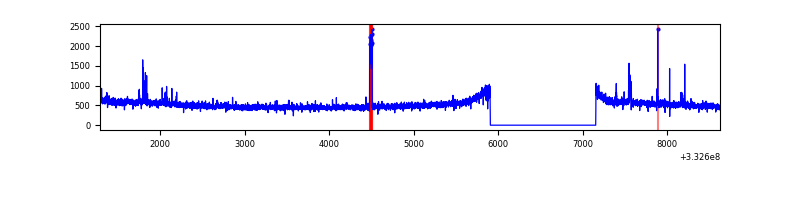 |
| C | 7340 | 6091 | 0 | 0 | 0.00% | 0.00% | 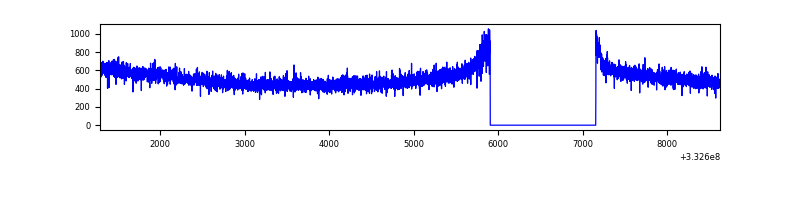 |
| D | 7340 | 6091 | 118 | 118 | 1.61% | 1.94% | 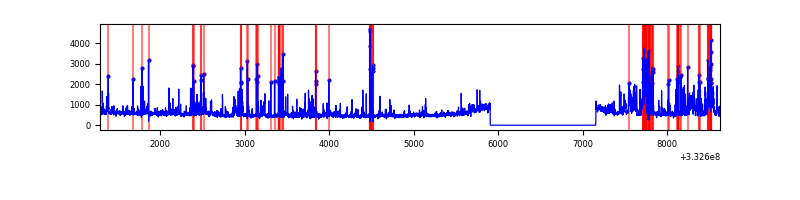 |
Top three noisy pixels from each quadrant. If the there are fewer than three noisy pixels in the level2.evt file, extra rows are filled as -1
| Pixel properties | Quadrant properties | ||||||
|---|---|---|---|---|---|---|---|
| Quadrant | DetID | PixID | Counts | Sigma | Mean | Median | Sigma |
| A | 10 | 229 | 78760 | 476.12 | 828 | 814 | 163.7 |
| A | 13 | 254 | 9508 | 53.1 | 828 | 814 | 163.7 |
| A | 0 | 226 | 7217 | 39.11 | 828 | 814 | 163.7 |
| B | 0 | 190 | 48611 | 315.86 | 801 | 784 | 151.4 |
| B | 7 | 219 | 23356 | 149.07 | 801 | 784 | 151.4 |
| B | 12 | 111 | 17708 | 111.77 | 801 | 784 | 151.4 |
| C | 14 | 238 | 124698 | 700.8 | 763 | 768 | 176.8 |
| C | 3 | 233 | 21253 | 115.84 | 763 | 768 | 176.8 |
| C | 13 | 61 | 5209 | 25.11 | 763 | 768 | 176.8 |
| D | 1 | 52 | 832579 | 4423.36 | 786 | 767 | 188.0 |
| D | 7 | 80 | 165645 | 876.78 | 786 | 767 | 188.0 |
| D | 12 | 233 | 45208 | 236.33 | 786 | 767 | 188.0 |
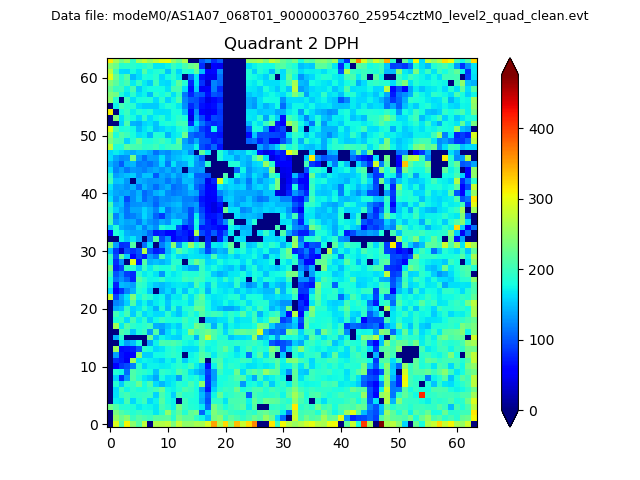
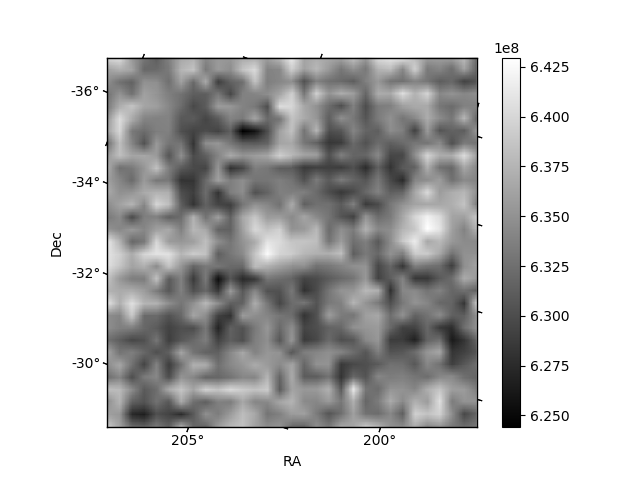
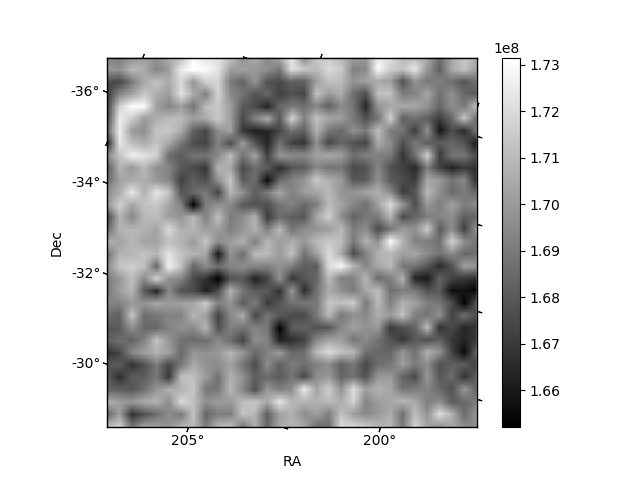
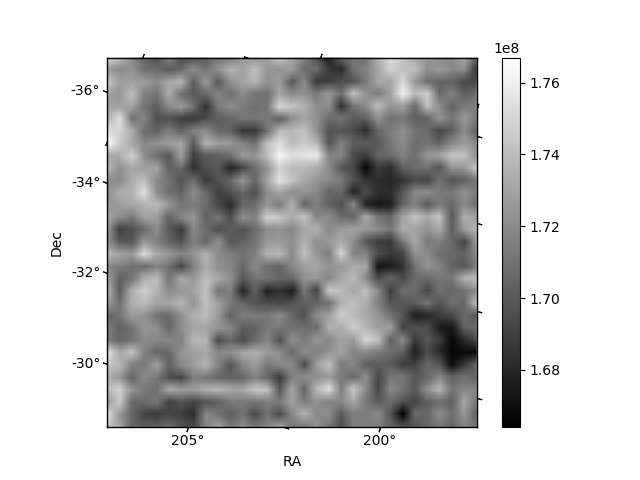
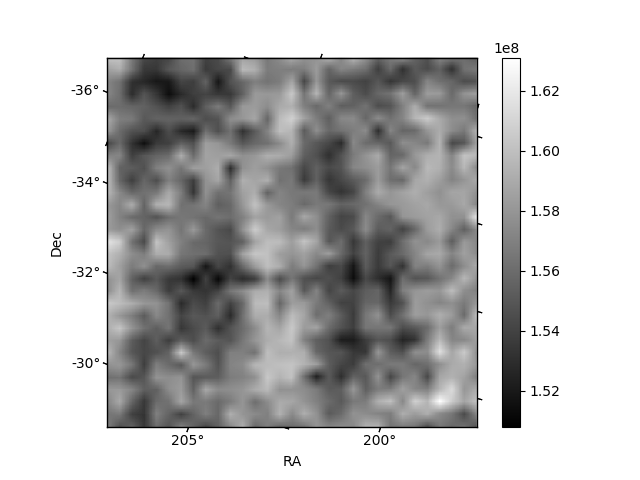
Histogram calculated using DETX and DETY for each event in the final _common_clean file
| Quadrant A | 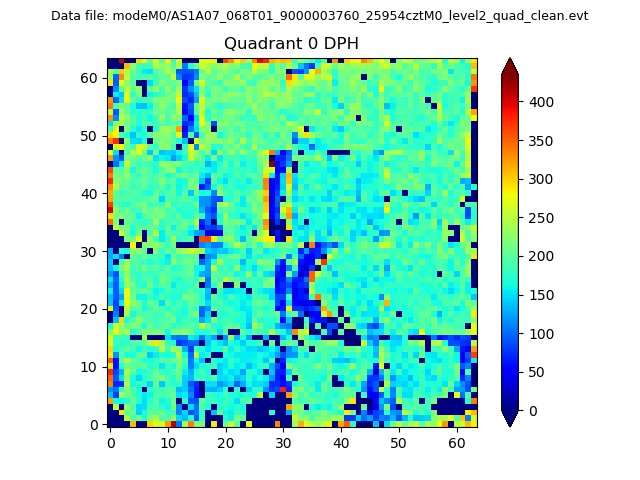 |
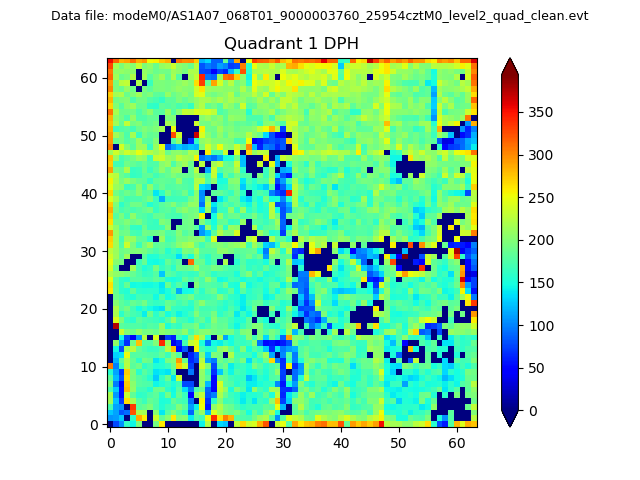 |
Quadrant B |
|---|---|---|---|
| Quadrant D | 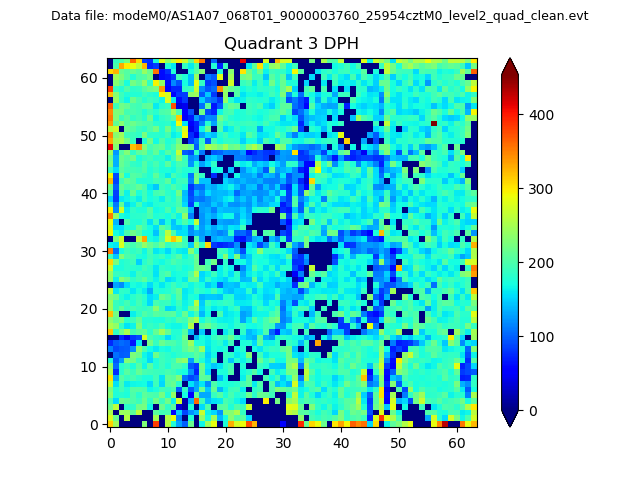 |
 |
Quadrant C |
| Plot type | Count rate plots | Images |
|---|---|---|
| Comparison with Poisson distribution Blue bars denote a histogram of data divided into 1 sec bins. Red curve is a Poisson curve with rate = median count rate of data. |
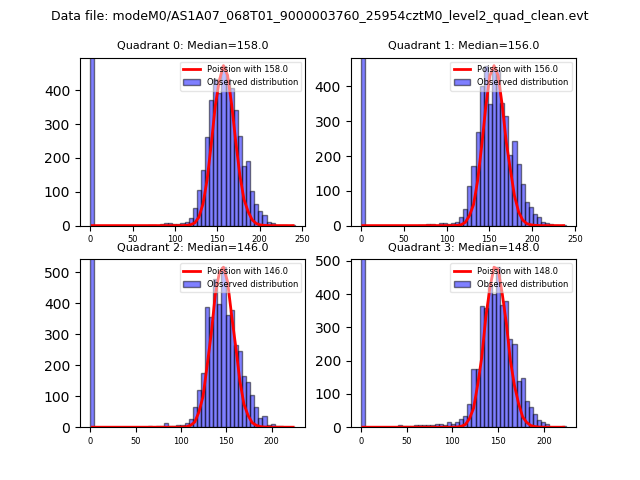 |
 |
| Quadrant-wise count rates Data is divided into 100 sec bins |
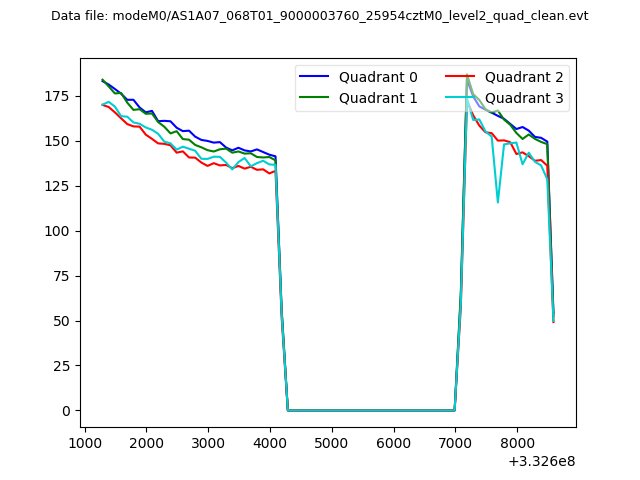 |
|
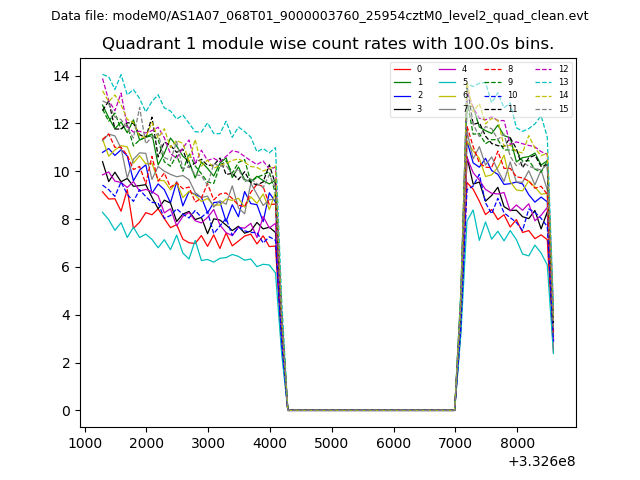
| Module-wise count rates for Quadrant A Data is divided into 100 sec bins |
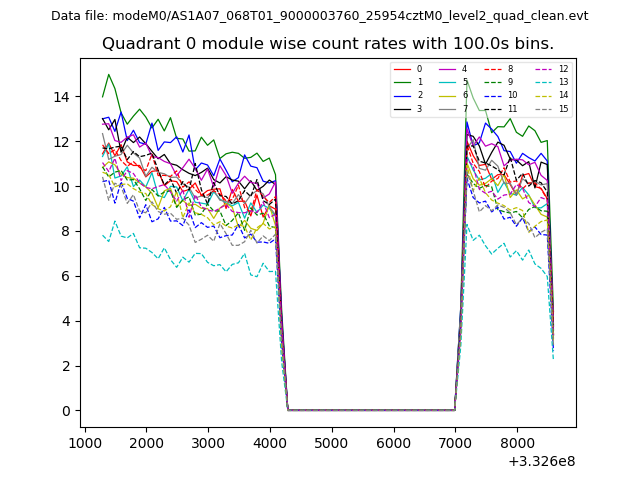 |
 |
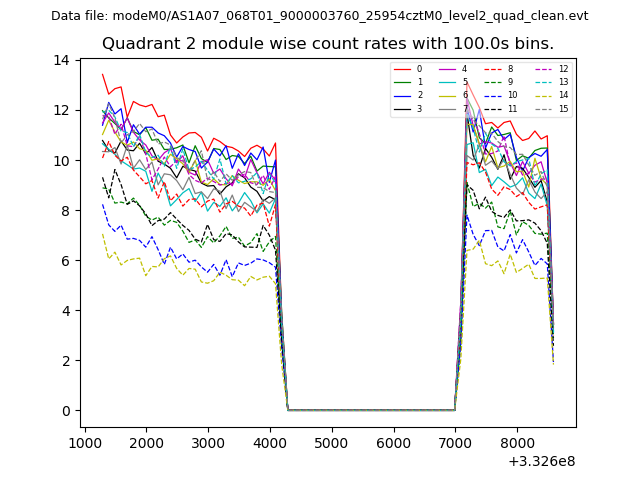
| Module-wise count rates for Quadrant B Data is divided into 100 sec bins |
 |
 |
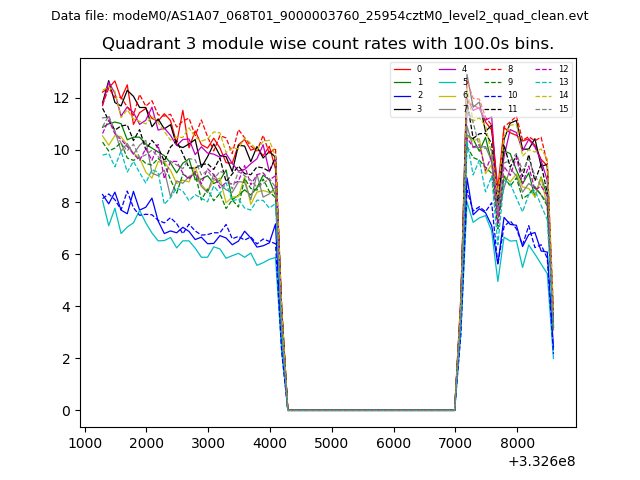
| Module-wise count rates for Quadrant C Data is divided into 100 sec bins |
 |
 |
| Module-wise count rates for Quadrant D Data is divided into 100 sec bins |
 |
 |
| Parameter | Plot |
|---|---|
| CZT HV Monitor | 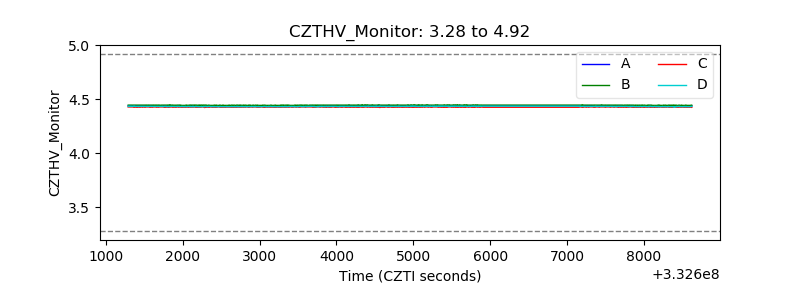 |
| D_VDD | 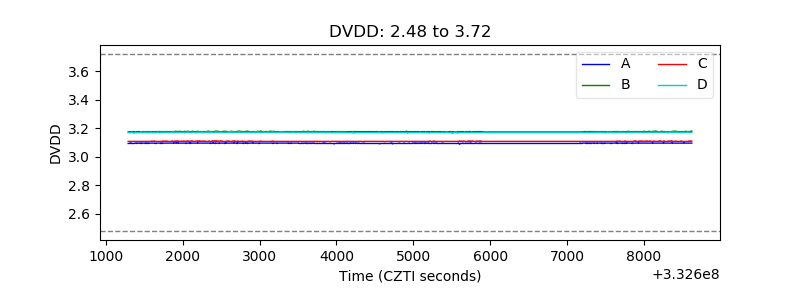 |
| Temperature 1 | 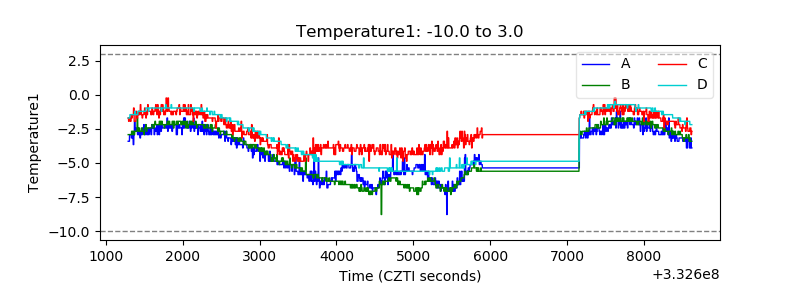 |
| Veto HV Monitor | 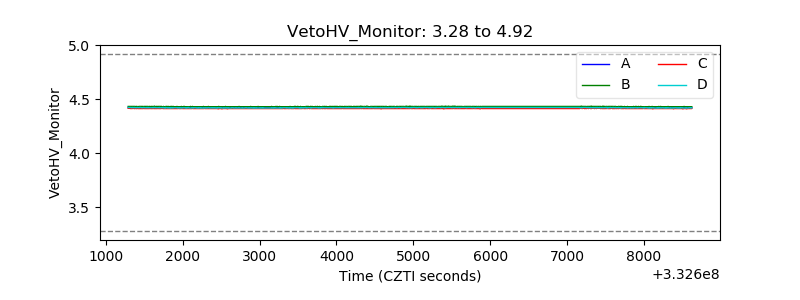 |
| Veto LLD | 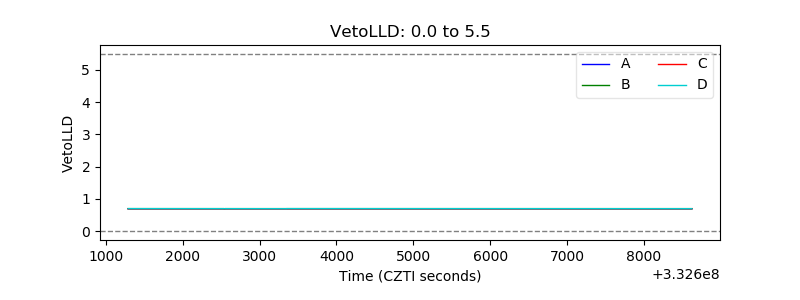 |
| Alpha Counter | 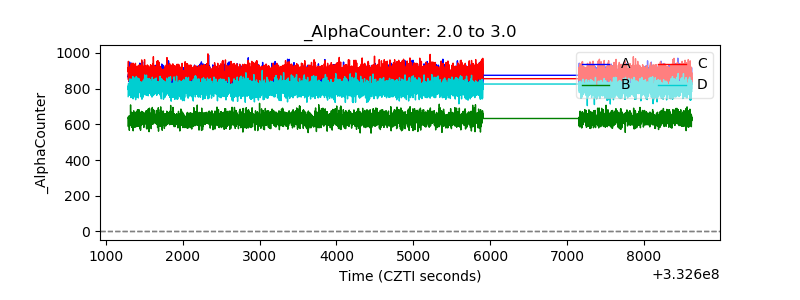 |
| _CPM_Rate | 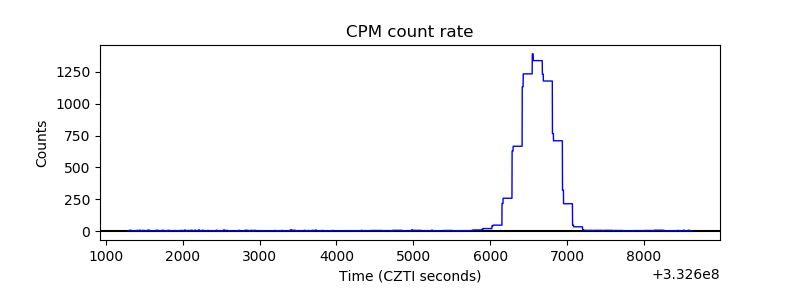 |
| CZT Counter | 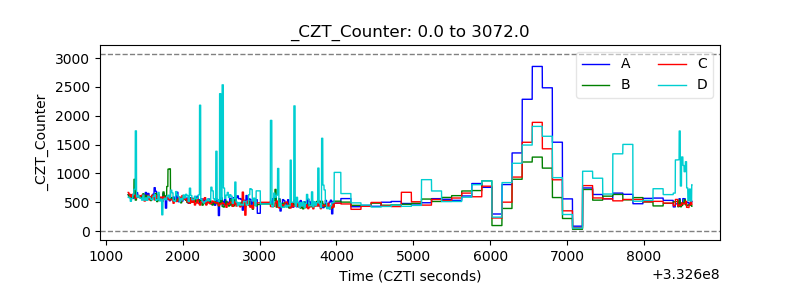 |
| +2.5 Volts monitor |  |
| +5 Volts monitor |  |
| _ROLL_ROT | 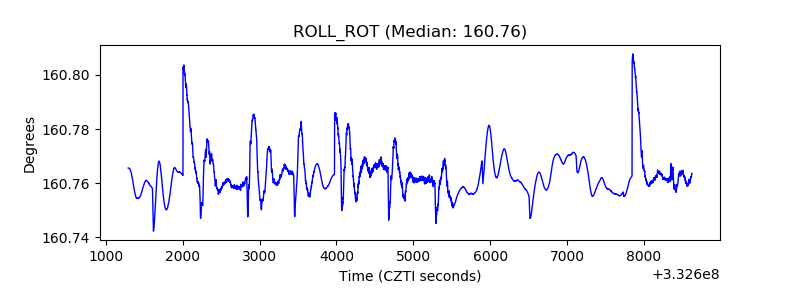 |
| _Roll_DEC | 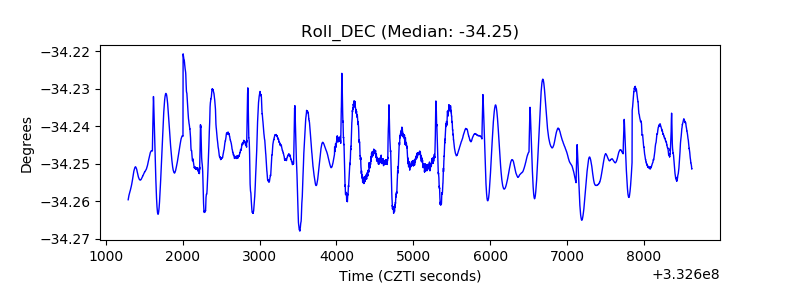 |
| _Roll_RA | 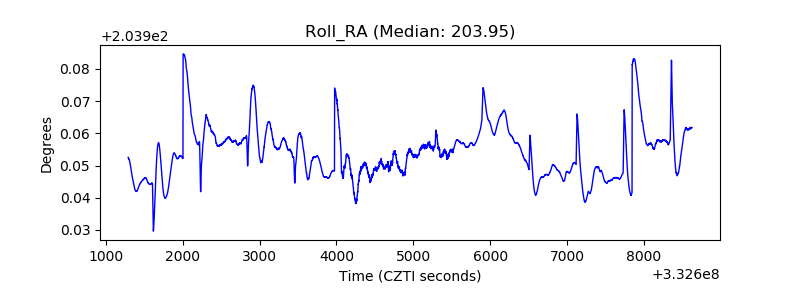 |
| Veto Counter | 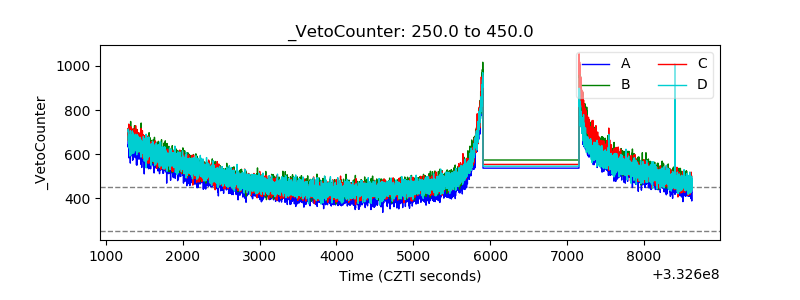 |