| Param | Original file | Final file |
|---|---|---|
| Filename | modeM0/AS1A07_068T01_9000003760_25958cztM0_level2.evt | modeM0/AS1A07_068T01_9000003760_25958cztM0_level2_quad_clean.evt |
| Size (bytes) | 535,913,280 | 106,868,160 |
| Size | 511.1 MB | 101.9 MB |
| Events in quadrant A | 3,557,895 | 701,007 |
| Events in quadrant B | 4,027,738 | 690,399 |
| Events in quadrant C | 3,529,859 | 662,622 |
| Events in quadrant D | 4,603,633 | 658,574 |
| Mode M0 | |||
|---|---|---|---|
| Quadrant | BADHDUFLAG | Total packets | Discarded packets |
| A | 0 | 15526 | 0 |
| B | 0 | 16984 | 0 |
| C | 0 | 15476 | 0 |
| D | 0 | 18891 | 0 |
| Mode M9 | |||
|---|---|---|---|
| Quadrant | BADHDUFLAG | Total packets | Discarded packets |
| A | 0 | 7 | 0 |
| B | 0 | 7 | 0 |
| C | 0 | 7 | 0 |
| D | 0 | 7 | 0 |
| Quadrant | Total seconds | Saturated seconds | Saturation percentage |
|---|---|---|---|
| A | 7529 | 66 | 0.876610% |
| B | 7529 | 264 | 3.506442% |
| C | 7530 | 90 | 1.195219% |
| D | 7530 | 231 | 3.067729% |
Noise dominated data is calculated using 1-second bins in cleaned event files. If a bin has >2000 counts, and if more than 50% of those come from <1% of pixels, then it is considered to be noise-dominated and hence unusable.
| Quadrant | # 1 sec bins | Bins with >0 counts | Bins with >2000 counts | High rate bins dominated by noise | Noise dominated (total time) | Noise dominated (detector-on time) | Marked lightcurve |
|---|---|---|---|---|---|---|---|
| A | 8244 | 7531 | 0 | 0 | 0.00% | 0.00% | 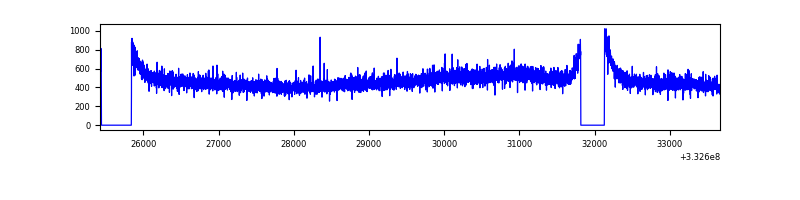 |
| B | 8244 | 7531 | 23 | 23 | 0.28% | 0.31% | 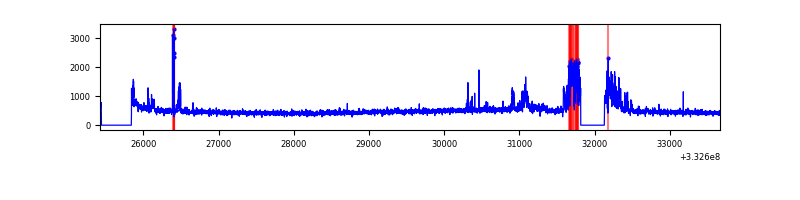 |
| C | 8245 | 7532 | 0 | 0 | 0.00% | 0.00% | 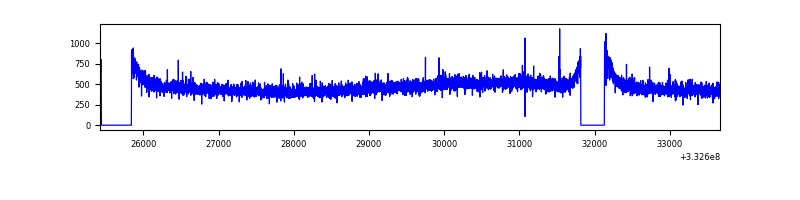 |
| D | 8245 | 7532 | 157 | 157 | 1.90% | 2.08% | 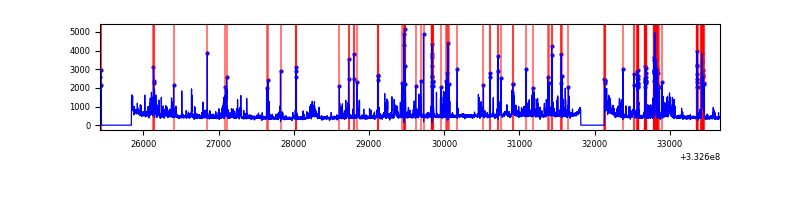 |
Top three noisy pixels from each quadrant. If the there are fewer than three noisy pixels in the level2.evt file, extra rows are filled as -1
| Pixel properties | Quadrant properties | ||||||
|---|---|---|---|---|---|---|---|
| Quadrant | DetID | PixID | Counts | Sigma | Mean | Median | Sigma |
| A | 13 | 254 | 11489 | 57.1 | 920 | 898 | 185.5 |
| A | 3 | 137 | 8830 | 42.76 | 920 | 898 | 185.5 |
| A | 0 | 226 | 7904 | 37.77 | 920 | 898 | 185.5 |
| B | 0 | 245 | 323027 | 1841.8 | 903 | 882 | 174.9 |
| B | 0 | 190 | 88943 | 503.47 | 903 | 882 | 174.9 |
| B | 0 | 219 | 41259 | 230.85 | 903 | 882 | 174.9 |
| C | 14 | 238 | 138315 | 672.64 | 865 | 867 | 204.3 |
| C | 3 | 233 | 17267 | 80.26 | 865 | 867 | 204.3 |
| C | 13 | 61 | 5948 | 24.87 | 865 | 867 | 204.3 |
| D | 1 | 52 | 1081382 | 5175.14 | 873 | 854 | 208.8 |
| D | 7 | 80 | 151943 | 723.63 | 873 | 854 | 208.8 |
| D | 2 | 234 | 29629 | 137.82 | 873 | 854 | 208.8 |
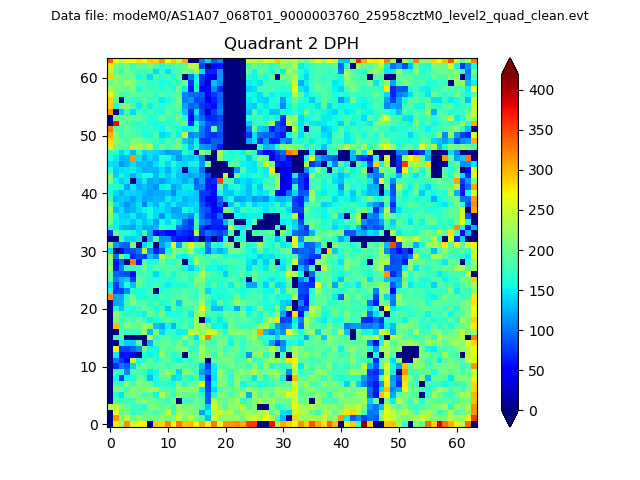
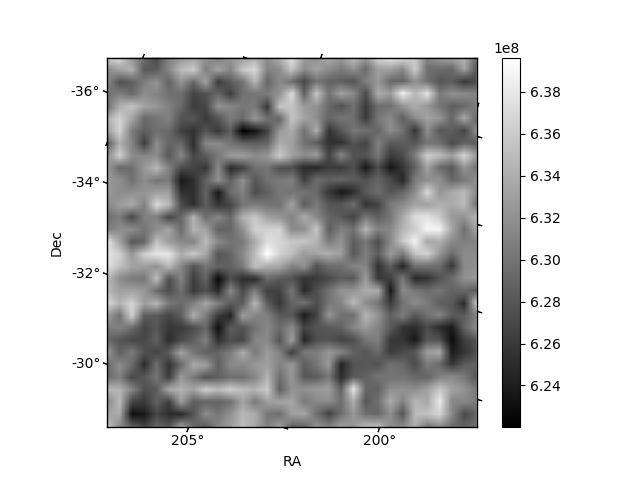
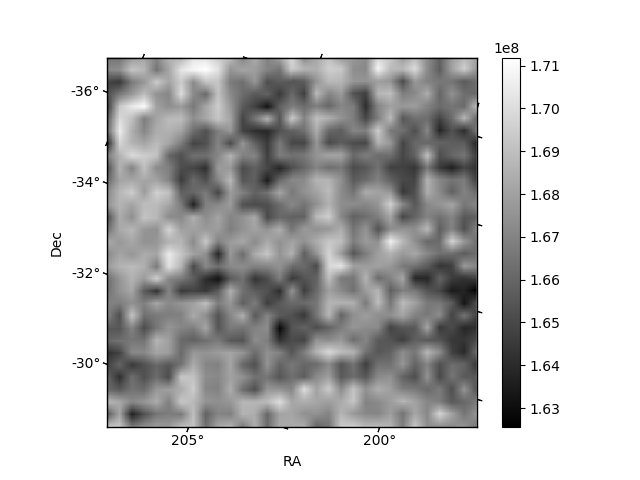
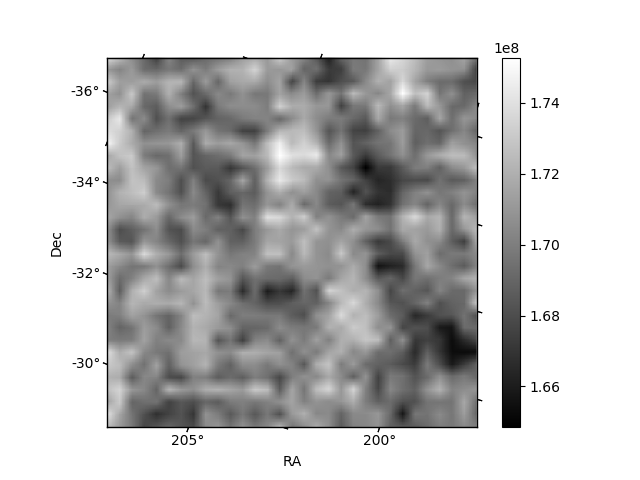
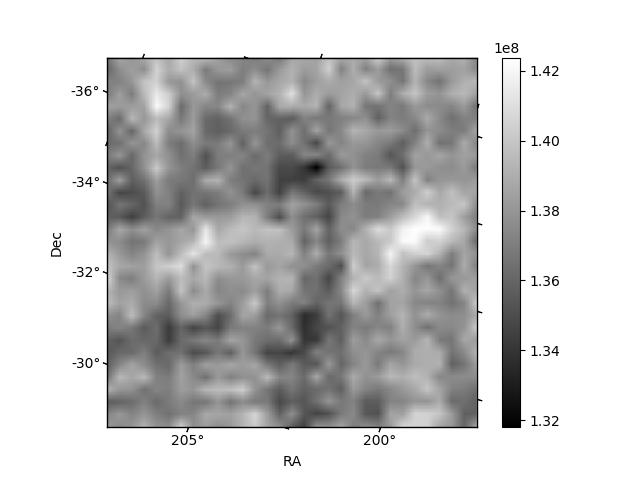
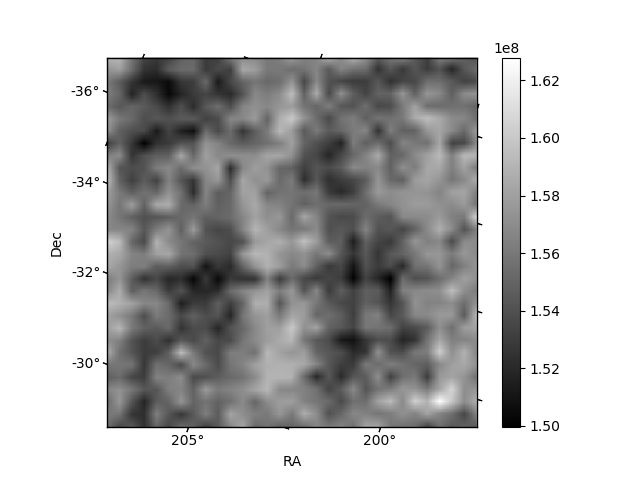
Histogram calculated using DETX and DETY for each event in the final _common_clean file
| Quadrant A | 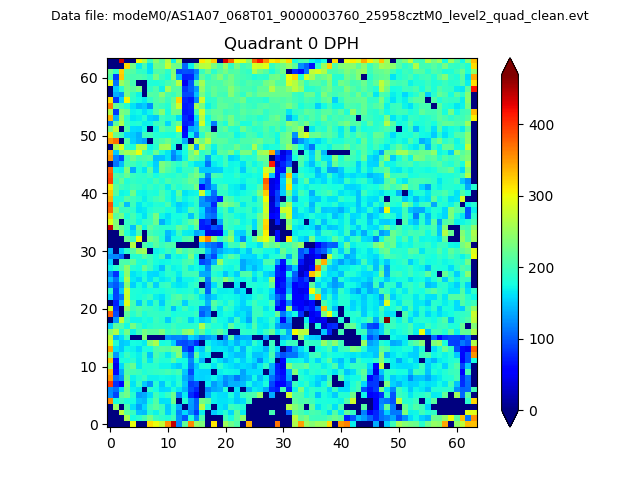 |
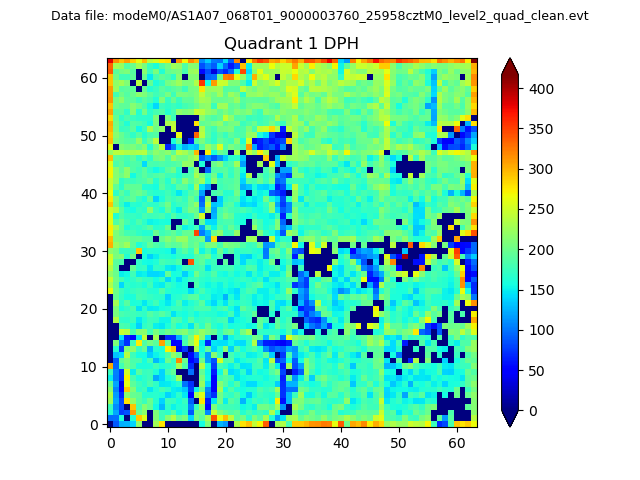 |
Quadrant B |
|---|---|---|---|
| Quadrant D | 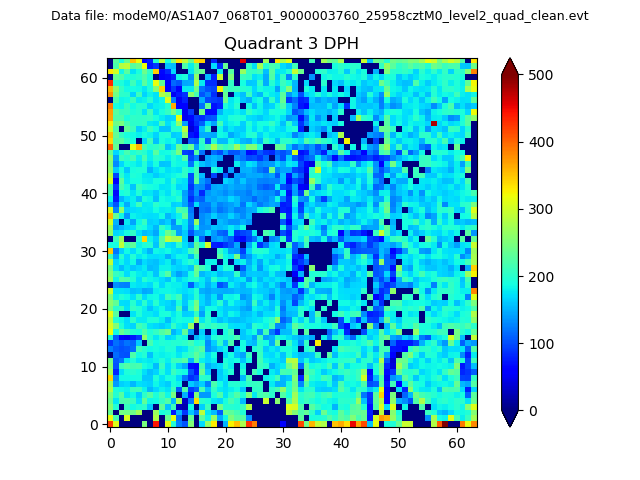 |
 |
Quadrant C |
| Plot type | Count rate plots | Images |
|---|---|---|
| Comparison with Poisson distribution Blue bars denote a histogram of data divided into 1 sec bins. Red curve is a Poisson curve with rate = median count rate of data. |
 |
 |
| Quadrant-wise count rates Data is divided into 100 sec bins |
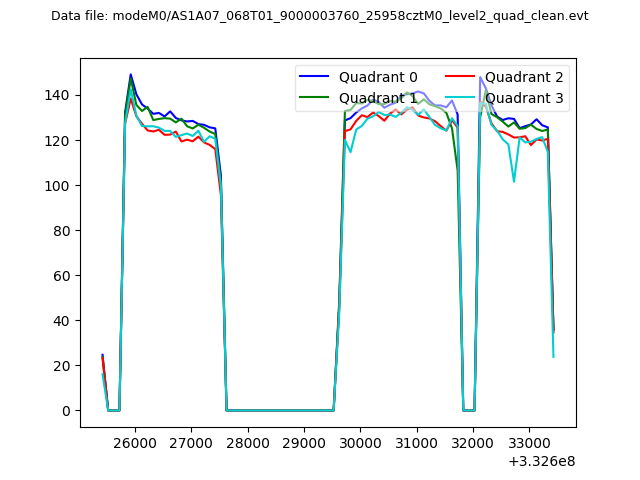 |
|
| Module-wise count rates for Quadrant A Data is divided into 100 sec bins |
 |
 |
| Module-wise count rates for Quadrant B Data is divided into 100 sec bins |
 |
 |
| Module-wise count rates for Quadrant C Data is divided into 100 sec bins |
 |
 |
| Module-wise count rates for Quadrant D Data is divided into 100 sec bins |
 |
 |
| Parameter | Plot |
|---|---|
| CZT HV Monitor |  |
| D_VDD |  |
| Temperature 1 | 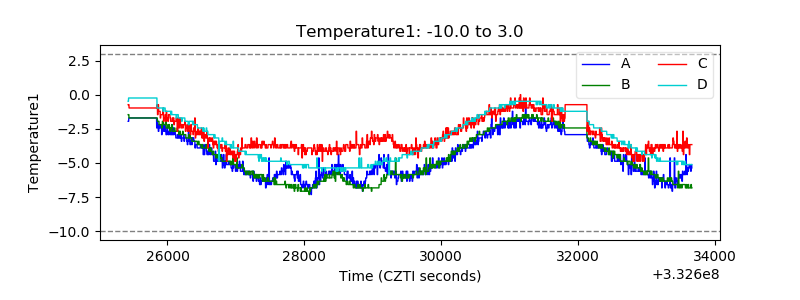 |
| Veto HV Monitor | 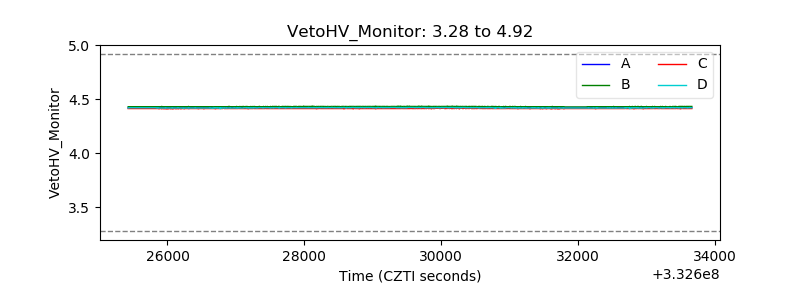 |
| Veto LLD |  |
| Alpha Counter | 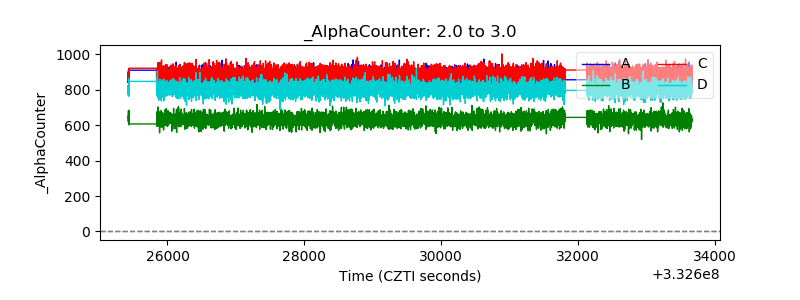 |
| _CPM_Rate | 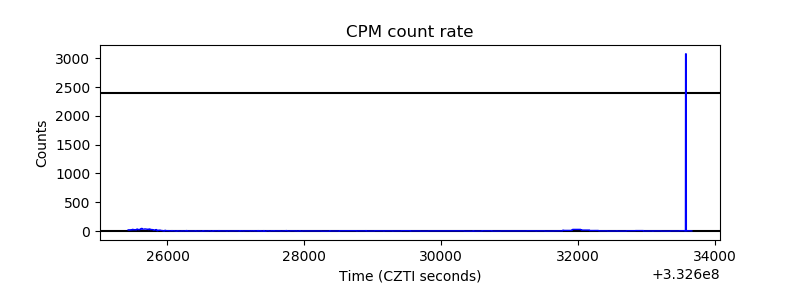 |
| CZT Counter | 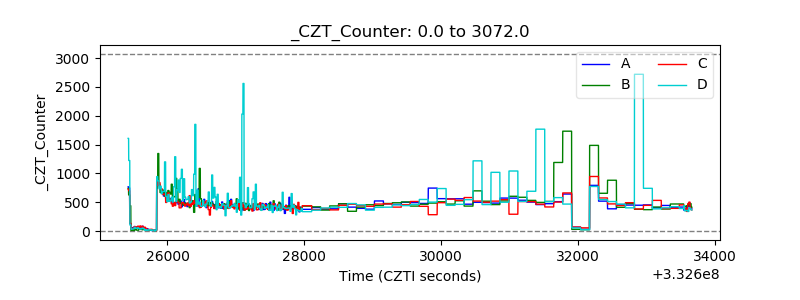 |
| +2.5 Volts monitor |  |
| +5 Volts monitor | 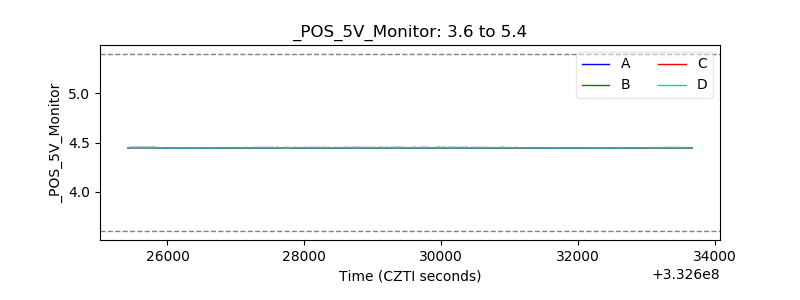 |
| _ROLL_ROT |  |
| _Roll_DEC | 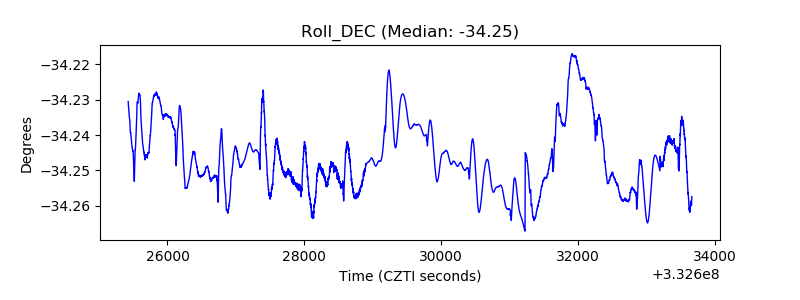 |
| _Roll_RA | 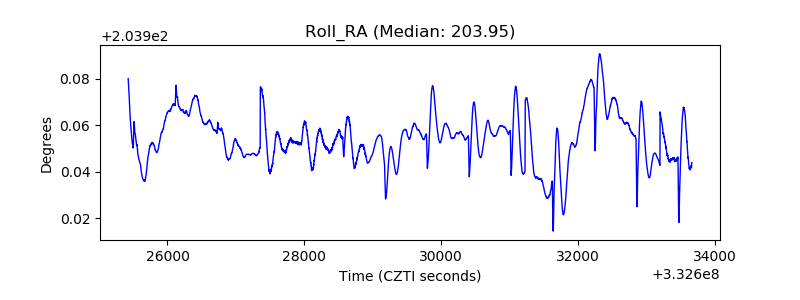 |
| Veto Counter |  |