| Param | Original file | Final file |
|---|---|---|
| Filename | modeM0/AS1A07_068T01_9000003760_25959cztM0_level2.evt | modeM0/AS1A07_068T01_9000003760_25959cztM0_level2_quad_clean.evt |
| Size (bytes) | 482,284,800 | 87,517,440 |
| Size | 459.9 MB | 83.5 MB |
| Events in quadrant A | 3,244,983 | 559,300 |
| Events in quadrant B | 3,389,511 | 554,039 |
| Events in quadrant C | 3,212,191 | 530,662 |
| Events in quadrant D | 4,286,163 | 521,308 |
| Mode M0 | |||
|---|---|---|---|
| Quadrant | BADHDUFLAG | Total packets | Discarded packets |
| A | 0 | 14278 | 0 |
| B | 0 | 14674 | 0 |
| C | 0 | 14214 | 0 |
| D | 0 | 17581 | 0 |
| Mode M9 | |||
|---|---|---|---|
| Quadrant | BADHDUFLAG | Total packets | Discarded packets |
| A | 0 | 7 | 0 |
| B | 0 | 9 | 1 |
| C | 0 | 8 | 0 |
| D | 0 | 8 | 0 |
| Quadrant | Total seconds | Saturated seconds | Saturation percentage |
|---|---|---|---|
| A | 6959 | 51 | 0.732864% |
| B | 6938 | 116 | 1.671952% |
| C | 6959 | 74 | 1.063371% |
| D | 6928 | 298 | 4.301386% |
Noise dominated data is calculated using 1-second bins in cleaned event files. If a bin has >2000 counts, and if more than 50% of those come from <1% of pixels, then it is considered to be noise-dominated and hence unusable.
| Quadrant | # 1 sec bins | Bins with >0 counts | Bins with >2000 counts | High rate bins dominated by noise | Noise dominated (total time) | Noise dominated (detector-on time) | Marked lightcurve |
|---|---|---|---|---|---|---|---|
| A | 7817 | 7019 | 0 | 0 | 0.00% | 0.00% | 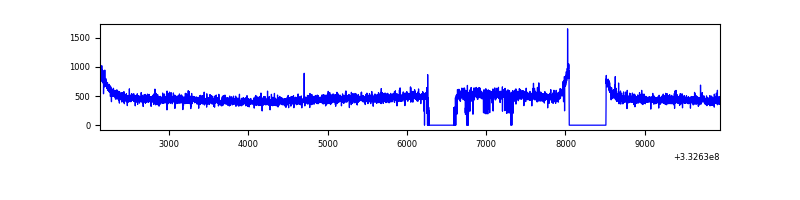 |
| B | 7817 | 7009 | 1 | 1 | 0.01% | 0.01% | 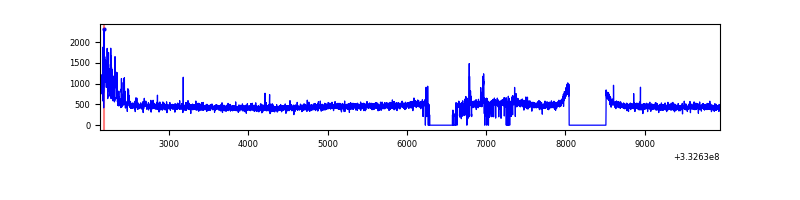 |
| C | 7817 | 7020 | 1 | 1 | 0.01% | 0.01% | 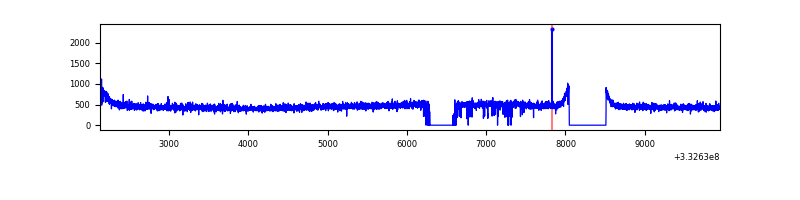 |
| D | 7816 | 6998 | 247 | 247 | 3.16% | 3.53% | 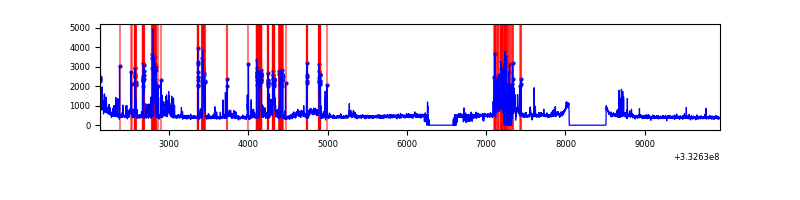 |
Top three noisy pixels from each quadrant. If the there are fewer than three noisy pixels in the level2.evt file, extra rows are filled as -1
| Pixel properties | Quadrant properties | ||||||
|---|---|---|---|---|---|---|---|
| Quadrant | DetID | PixID | Counts | Sigma | Mean | Median | Sigma |
| A | 3 | 1 | 12500 | 69.08 | 836 | 819 | 169.1 |
| A | 13 | 254 | 10636 | 58.06 | 836 | 819 | 169.1 |
| A | 3 | 137 | 7880 | 41.76 | 836 | 819 | 169.1 |
| B | 0 | 245 | 123965 | 773.17 | 822 | 800 | 159.3 |
| B | 0 | 190 | 26936 | 164.07 | 822 | 800 | 159.3 |
| B | 12 | 111 | 19688 | 118.57 | 822 | 800 | 159.3 |
| C | 14 | 238 | 124617 | 666.86 | 787 | 790 | 185.7 |
| C | 3 | 233 | 18171 | 93.6 | 787 | 790 | 185.7 |
| C | 13 | 61 | 5373 | 24.68 | 787 | 790 | 185.7 |
| D | 1 | 52 | 972832 | 5168.1 | 785 | 765 | 188.1 |
| D | 7 | 80 | 299543 | 1588.49 | 785 | 765 | 188.1 |
| D | 2 | 234 | 26555 | 137.12 | 785 | 765 | 188.1 |
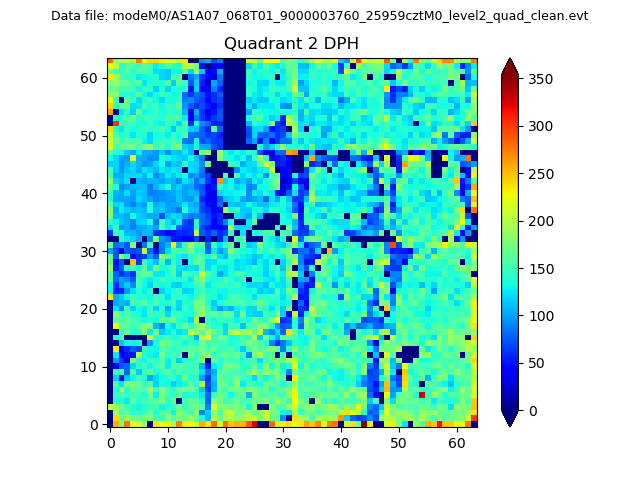
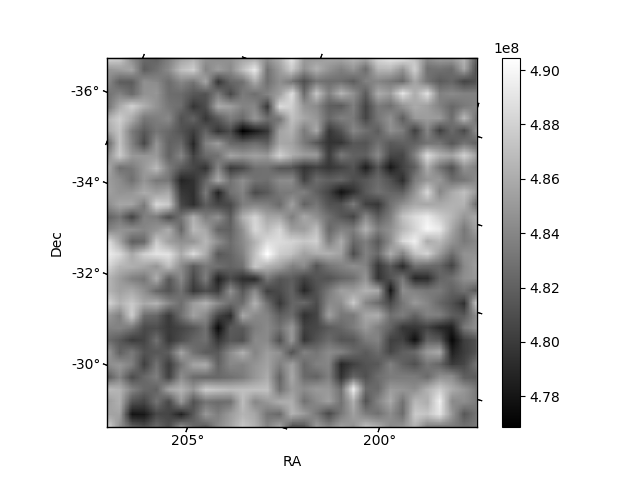
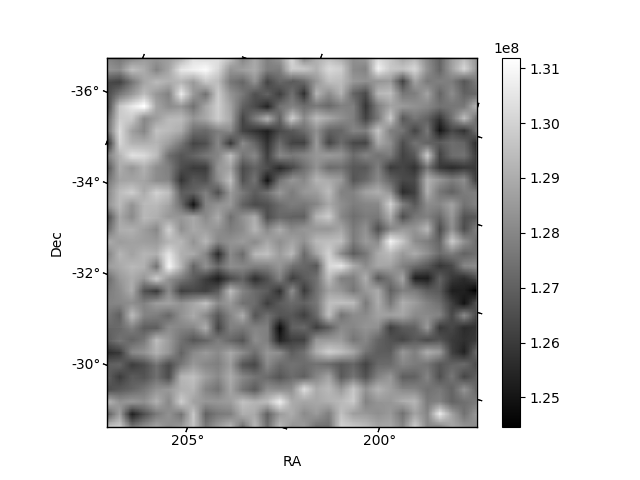
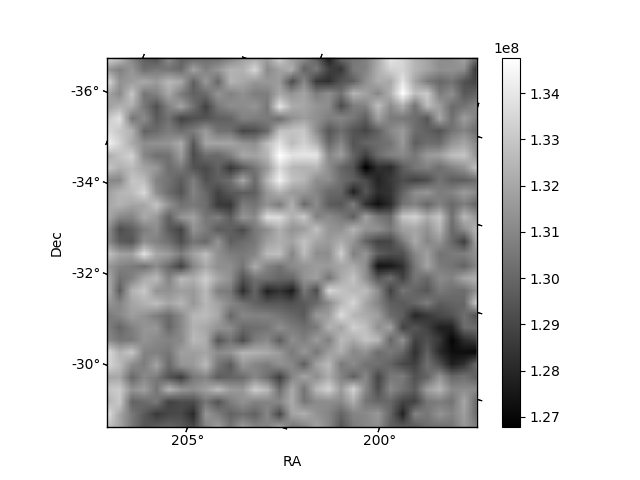
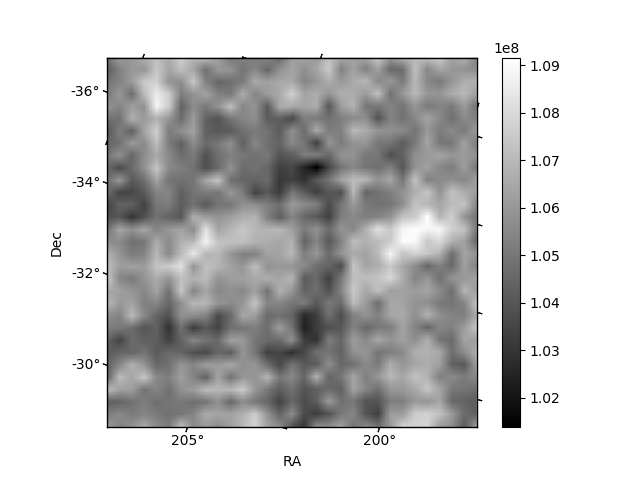
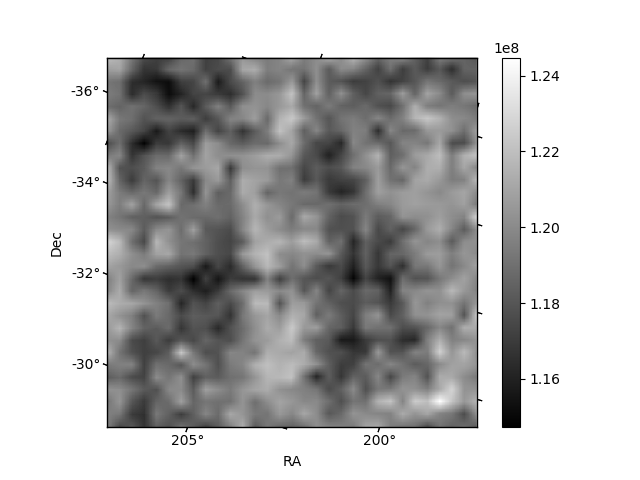
Histogram calculated using DETX and DETY for each event in the final _common_clean file
| Quadrant A | 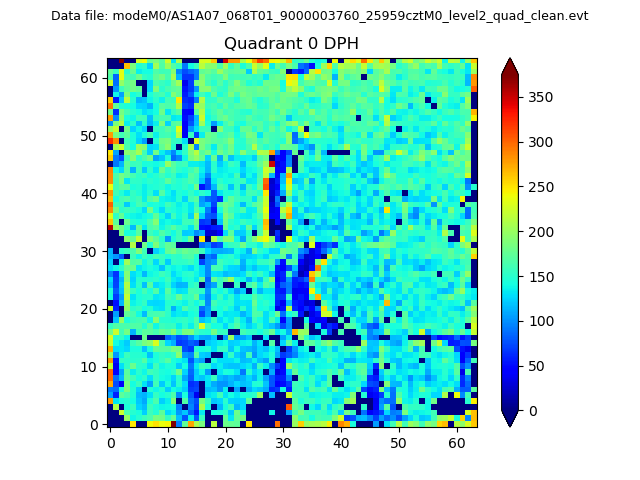 |
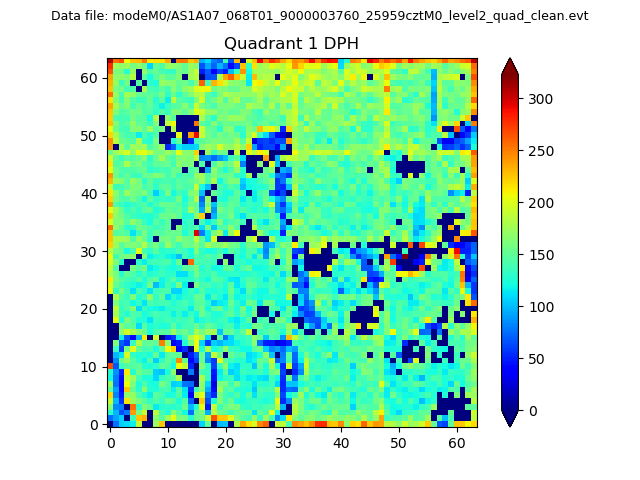 |
Quadrant B |
|---|---|---|---|
| Quadrant D | 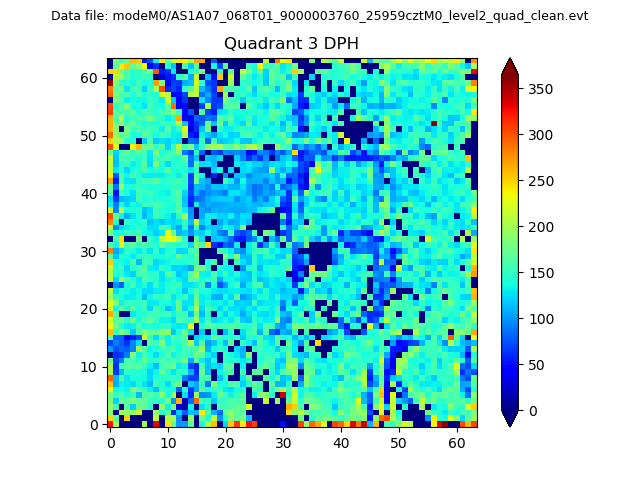 |
 |
Quadrant C |
| Plot type | Count rate plots | Images |
|---|---|---|
| Comparison with Poisson distribution Blue bars denote a histogram of data divided into 1 sec bins. Red curve is a Poisson curve with rate = median count rate of data. |
 |
 |
| Quadrant-wise count rates Data is divided into 100 sec bins |
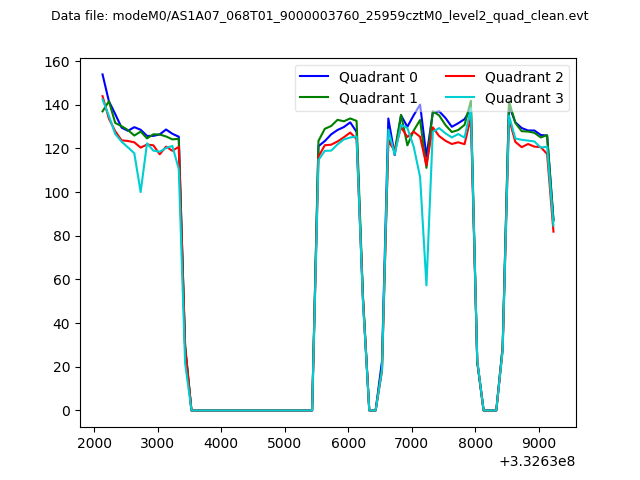 |
|
| Module-wise count rates for Quadrant A Data is divided into 100 sec bins |
 |
 |
| Module-wise count rates for Quadrant B Data is divided into 100 sec bins |
 |
 |
| Module-wise count rates for Quadrant C Data is divided into 100 sec bins |
 |
 |
| Module-wise count rates for Quadrant D Data is divided into 100 sec bins |
 |
 |
| Parameter | Plot |
|---|---|
| CZT HV Monitor | 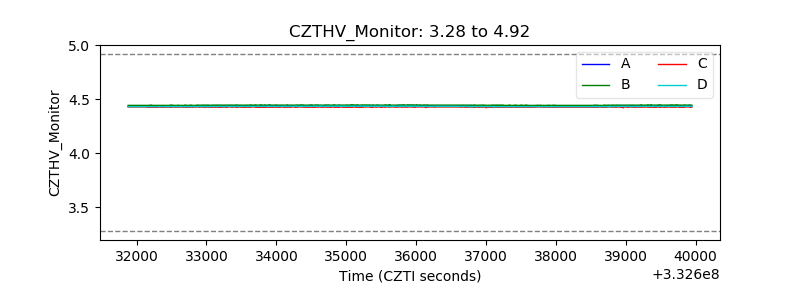 |
| D_VDD | 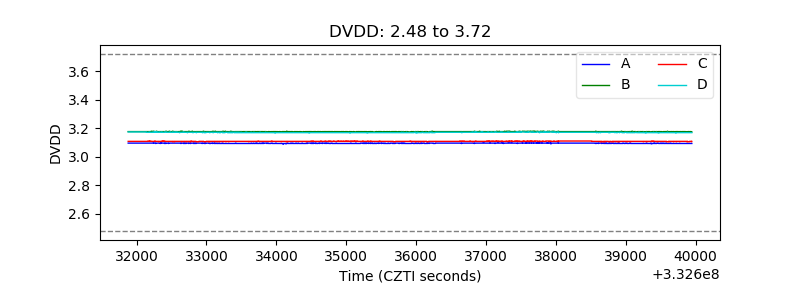 |
| Temperature 1 |  |
| Veto HV Monitor | 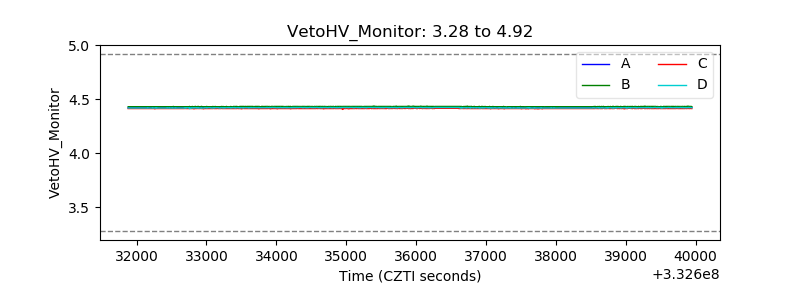 |
| Veto LLD | 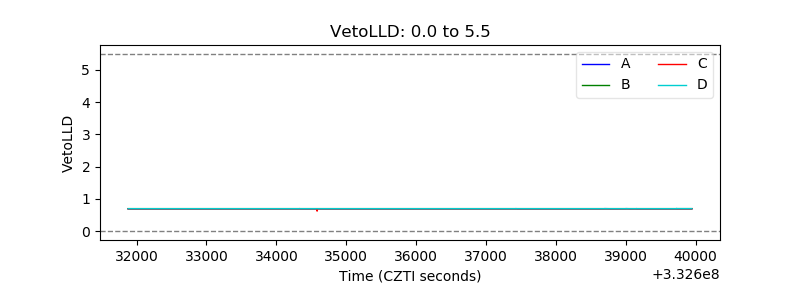 |
| Alpha Counter | 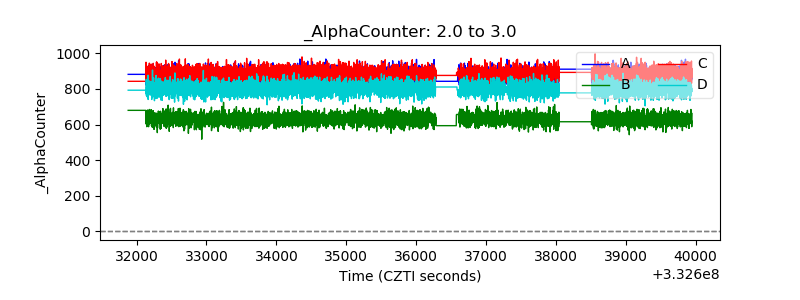 |
| _CPM_Rate | 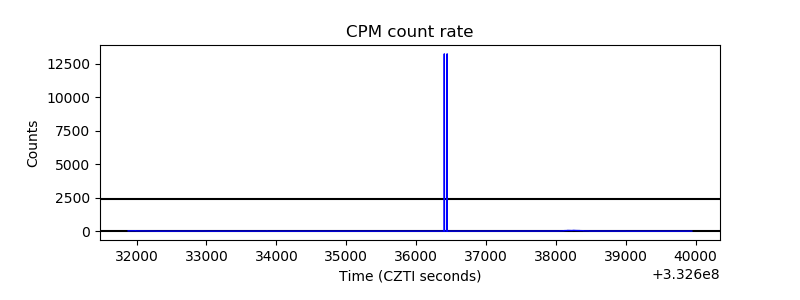 |
| CZT Counter | 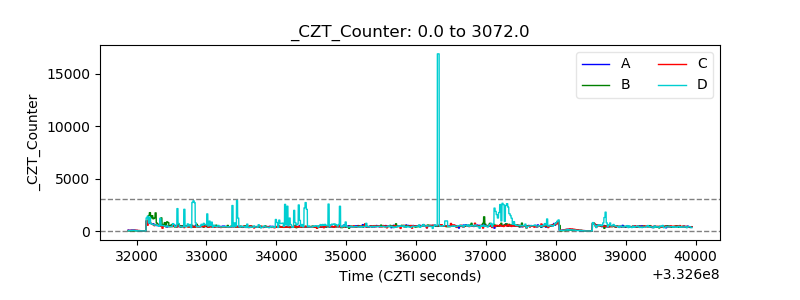 |
| +2.5 Volts monitor |  |
| +5 Volts monitor |  |
| _ROLL_ROT |  |
| _Roll_DEC |  |
| _Roll_RA | 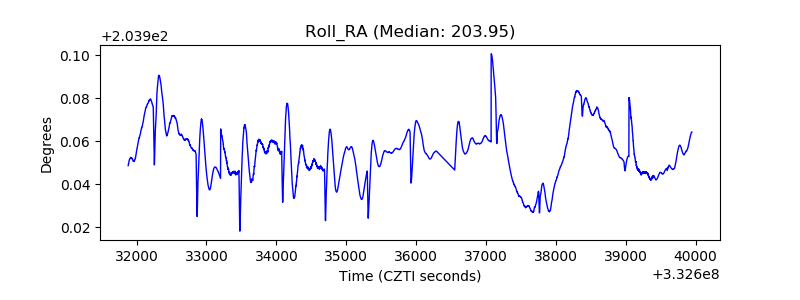 |
| Veto Counter |  |