| Param | Original file | Final file |
|---|---|---|
| Filename | modeM0/AS1A07_068T01_9000003760_25961cztM0_level2.evt | modeM0/AS1A07_068T01_9000003760_25961cztM0_level2_quad_clean.evt |
| Size (bytes) | 4,875,840 | 1,679,040 |
| Size | 4.6 MB | 1.6 MB |
| Events in quadrant A | 35,519 | 9,663 |
| Events in quadrant B | 38,638 | 10,135 |
| Events in quadrant C | 36,934 | 8,906 |
| Events in quadrant D | 22,966 | 3,025 |
| Mode M0 | |||
|---|---|---|---|
| Quadrant | BADHDUFLAG | Total packets | Discarded packets |
| A | 0 | 158 | 0 |
| B | 0 | 170 | 0 |
| C | 0 | 162 | 0 |
| D | 0 | 86 | 0 |
| Mode M9 | |||
|---|---|---|---|
| Quadrant | BADHDUFLAG | Total packets | Discarded packets |
| A | 1 | 140242598517544 | 46 |
| B | 1 | -1 | -1 |
| C | 1 | -1 | -1 |
| D | 1 | -1 | -1 |
| Quadrant | Total seconds | Saturated seconds | Saturation percentage |
|---|---|---|---|
| A | 79 | 0 | 0.000000% |
| B | 85 | 0 | 0.000000% |
| C | 81 | 0 | 0.000000% |
| D | 28 | 4 | 14.285714% |
Noise dominated data is calculated using 1-second bins in cleaned event files. If a bin has >2000 counts, and if more than 50% of those come from <1% of pixels, then it is considered to be noise-dominated and hence unusable.
| Quadrant | # 1 sec bins | Bins with >0 counts | Bins with >2000 counts | High rate bins dominated by noise | Noise dominated (total time) | Noise dominated (detector-on time) | Marked lightcurve |
|---|---|---|---|---|---|---|---|
| A | 1845 | 116 | 0 | 0 | 0.00% | 0.00% | 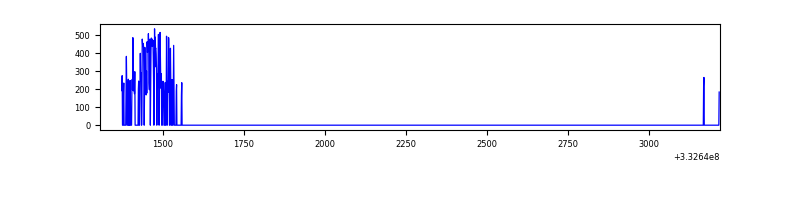 |
| B | 1871 | 132 | 0 | 0 | 0.00% | 0.00% | 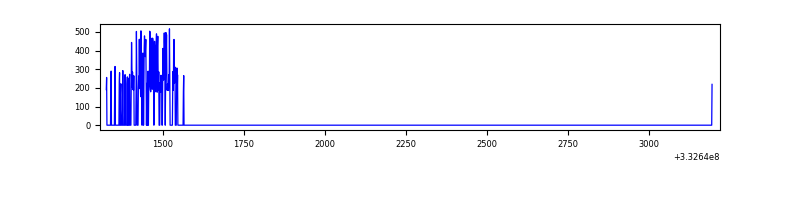 |
| C | 1914 | 120 | 0 | 0 | 0.00% | 0.00% |  |
| D | 139 | 49 | 1 | 1 | 0.72% | 2.04% | 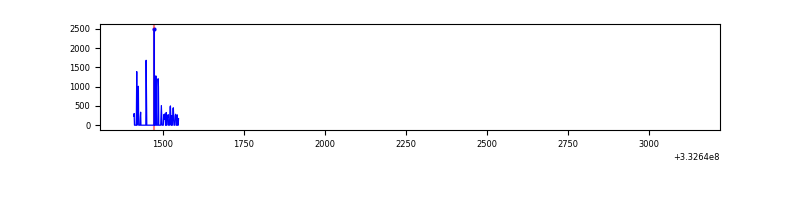 |
Top three noisy pixels from each quadrant. If the there are fewer than three noisy pixels in the level2.evt file, extra rows are filled as -1
| Pixel properties | Quadrant properties | ||||||
|---|---|---|---|---|---|---|---|
| Quadrant | DetID | PixID | Counts | Sigma | Mean | Median | Sigma |
| A | 13 | 254 | 85 | 21.46 | 9 | 8 | 3.6 |
| A | 3 | 137 | 83 | 20.9 | 9 | 8 | 3.6 |
| A | 0 | 226 | 69 | 16.97 | 9 | 8 | 3.6 |
| B | 12 | 111 | 226 | 60.63 | 9 | 9 | 3.6 |
| B | 11 | 111 | 213 | 57.0 | 9 | 9 | 3.6 |
| B | 14 | 111 | 191 | 50.85 | 9 | 9 | 3.6 |
| C | 14 | 238 | 1529 | 423.02 | 8 | 8 | 3.6 |
| C | 3 | 233 | 559 | 153.24 | 8 | 8 | 3.6 |
| C | 13 | 61 | 59 | 14.18 | 8 | 8 | 3.6 |
| D | 7 | 80 | 11302 | 6640.85 | 3 | 2 | 1.7 |
| D | 13 | 104 | 129 | 74.64 | 3 | 2 | 1.7 |
| D | 2 | 234 | 94 | 54.07 | 3 | 2 | 1.7 |
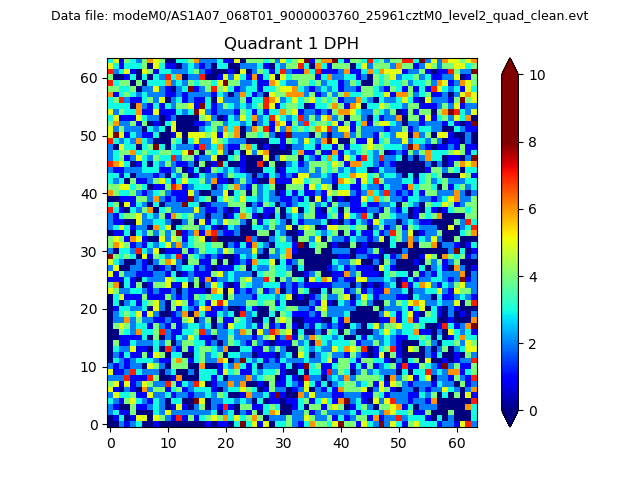
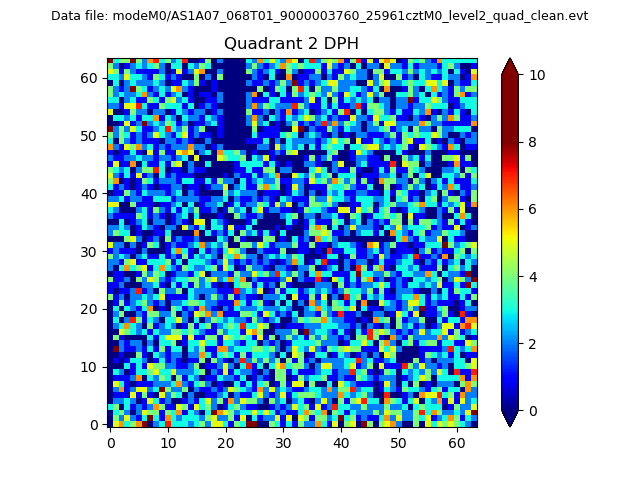
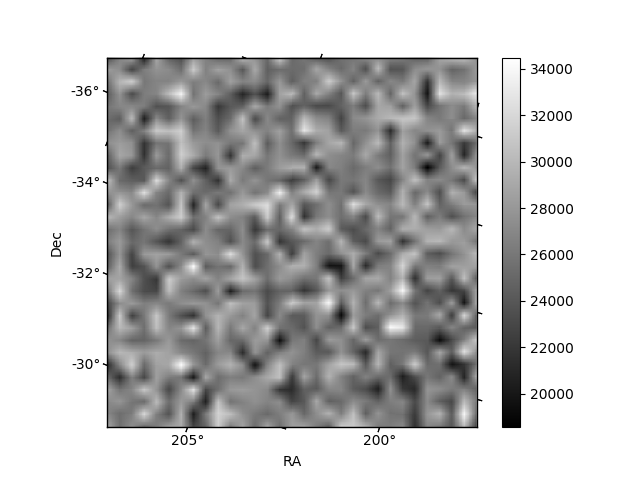
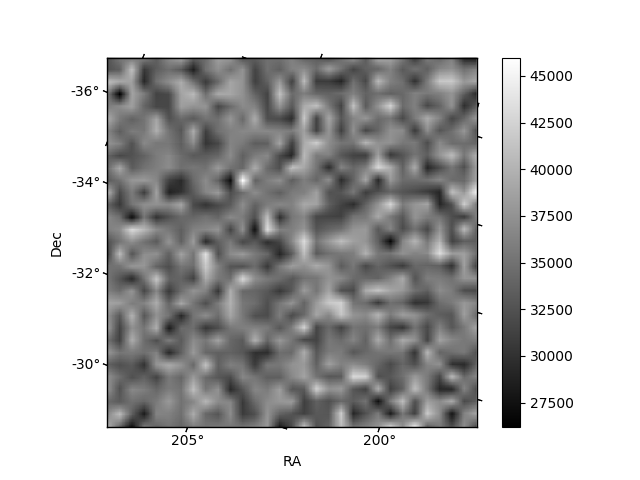
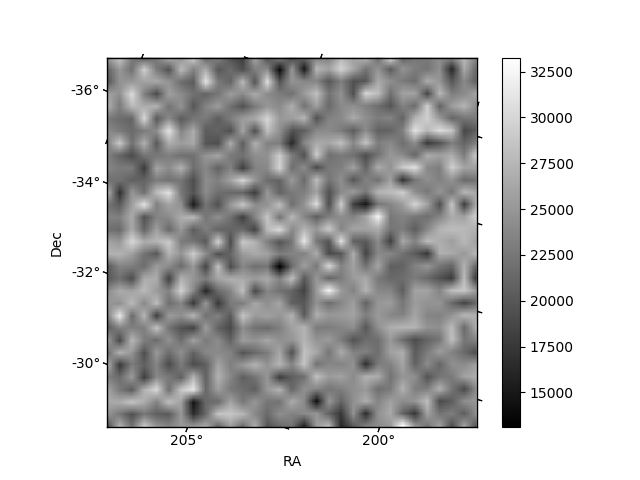
Histogram calculated using DETX and DETY for each event in the final _common_clean file
| Quadrant A | 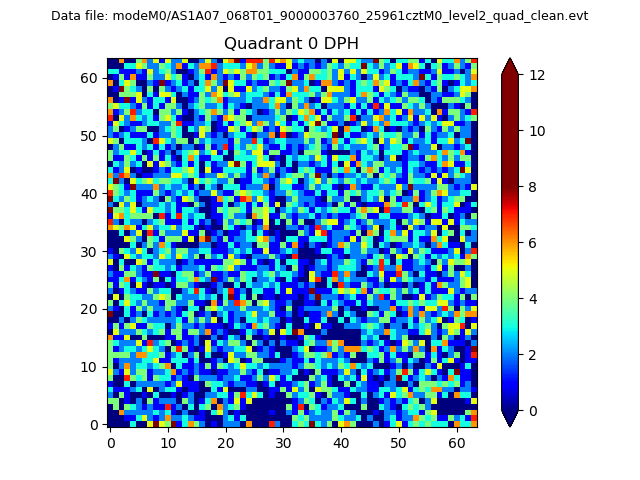 |
 |
Quadrant B |
|---|---|---|---|
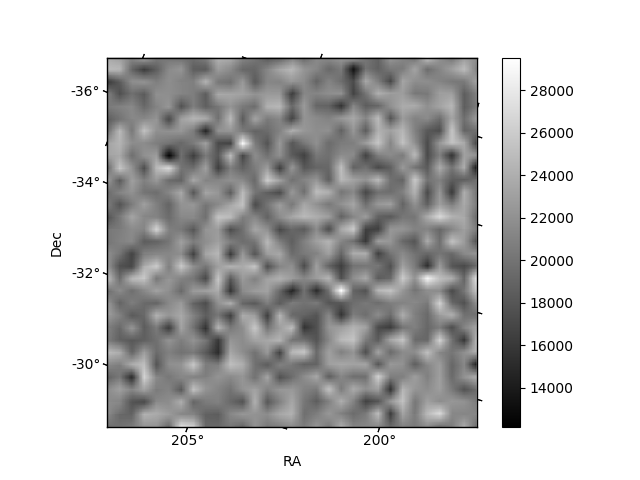
| Quadrant D |  |
 |
Quadrant C |
| Plot type | Count rate plots | Images |
|---|---|---|
| Comparison with Poisson distribution Blue bars denote a histogram of data divided into 1 sec bins. Red curve is a Poisson curve with rate = median count rate of data. |
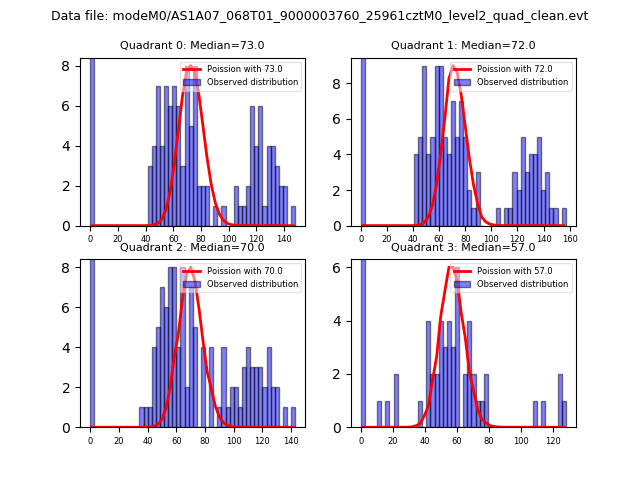 |
 |
| Quadrant-wise count rates Data is divided into 100 sec bins |
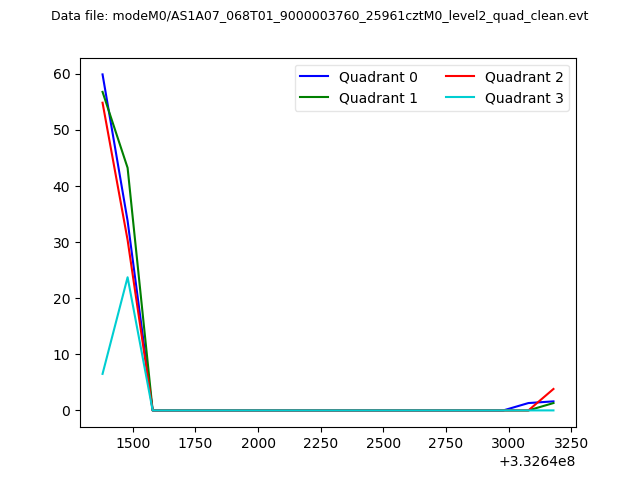 |
|
| Module-wise count rates for Quadrant A Data is divided into 100 sec bins |
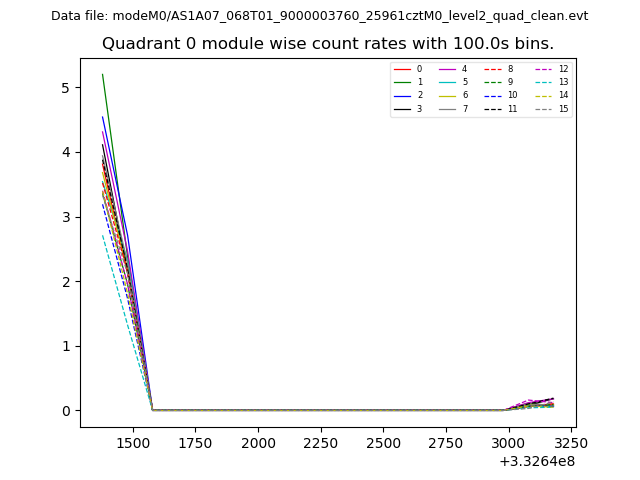 |
 |
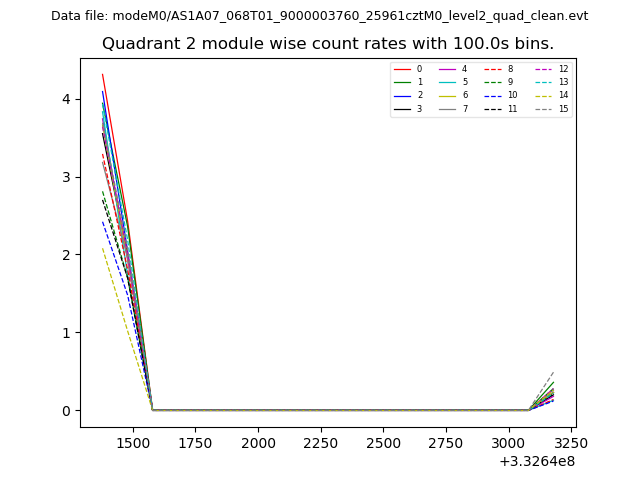
| Module-wise count rates for Quadrant B Data is divided into 100 sec bins |
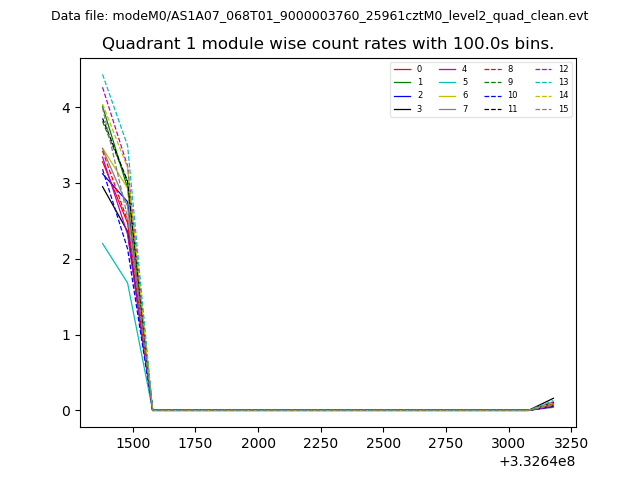 |
 |
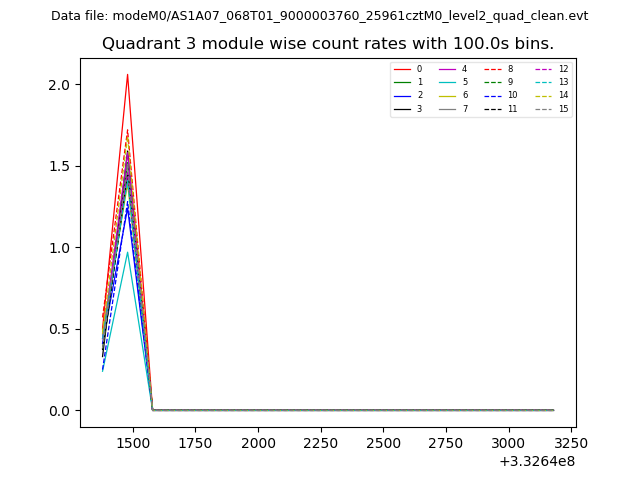
| Module-wise count rates for Quadrant C Data is divided into 100 sec bins |
 |
 |
| Module-wise count rates for Quadrant D Data is divided into 100 sec bins |
 |
 |
| Parameter | Plot |
|---|---|
| CZT HV Monitor | 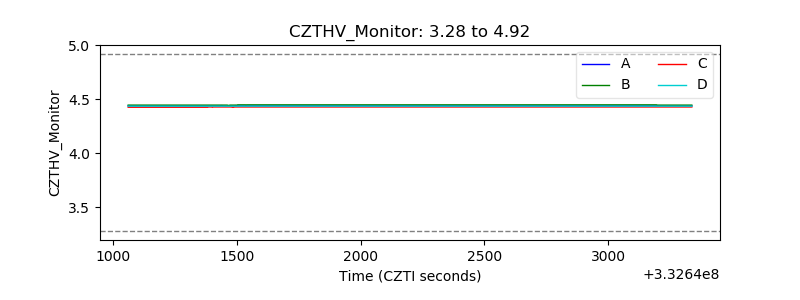 |
| D_VDD | 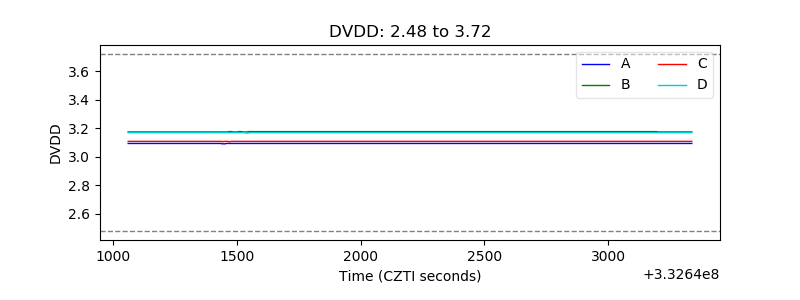 |
| Temperature 1 | 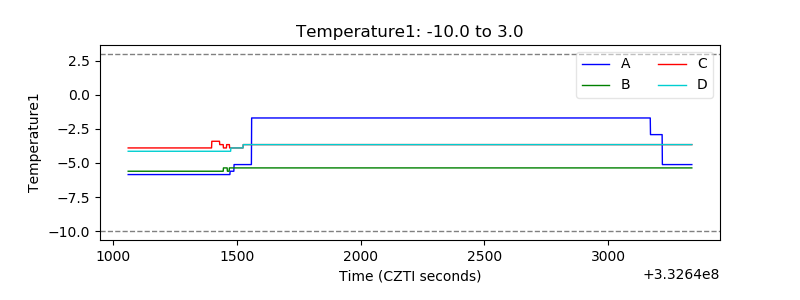 |
| Veto HV Monitor | 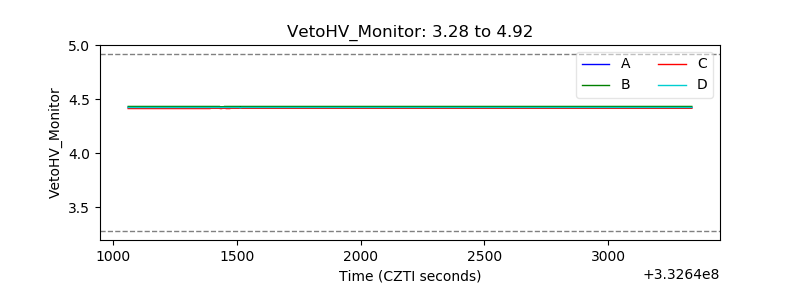 |
| Veto LLD | 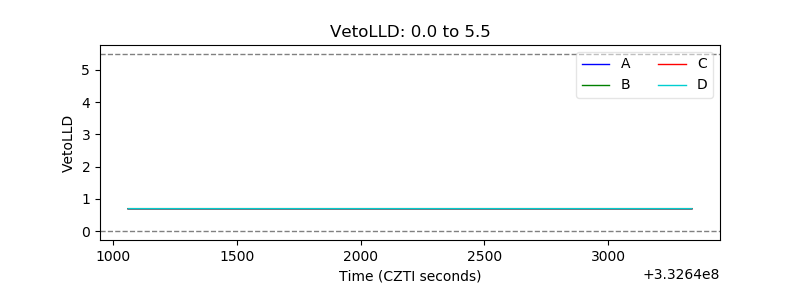 |
| Alpha Counter | 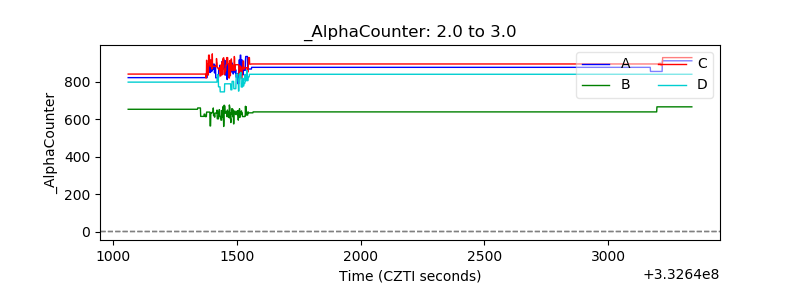 |
| _CPM_Rate | 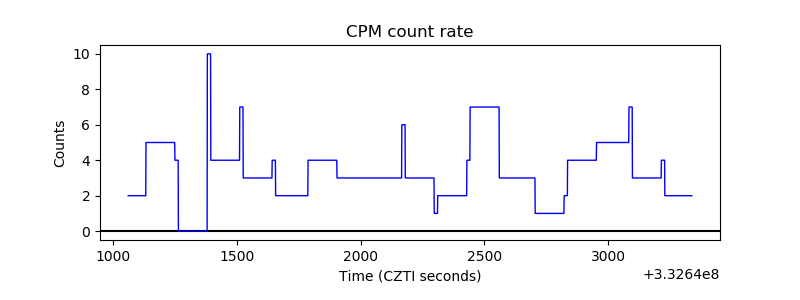 |
| CZT Counter | 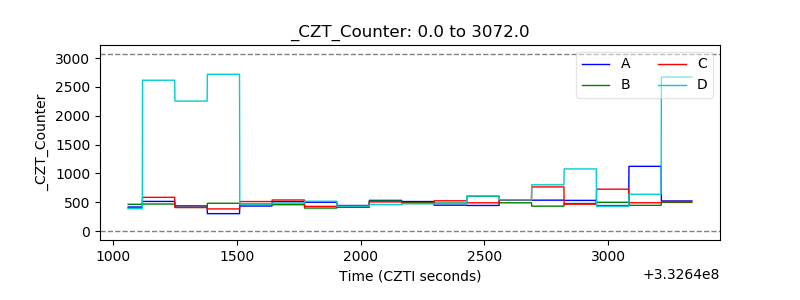 |
| +2.5 Volts monitor |  |
| +5 Volts monitor |  |
| _ROLL_ROT | 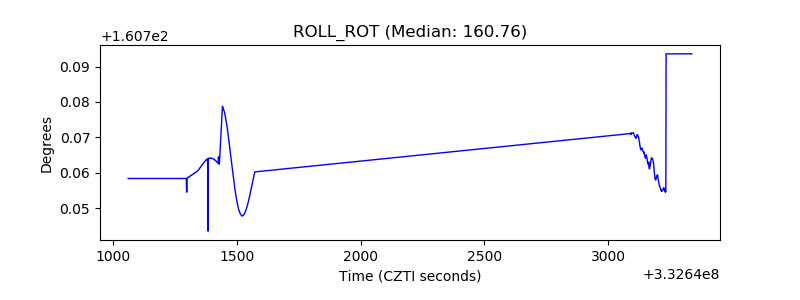 |
| _Roll_DEC | 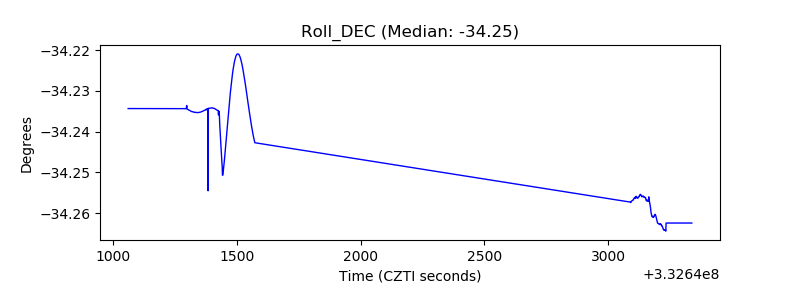 |
| _Roll_RA | 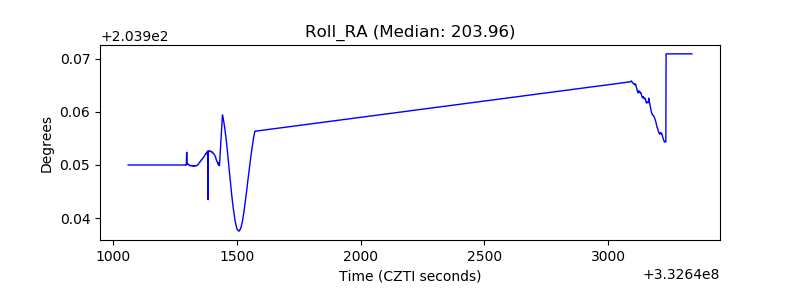 |
| Veto Counter | 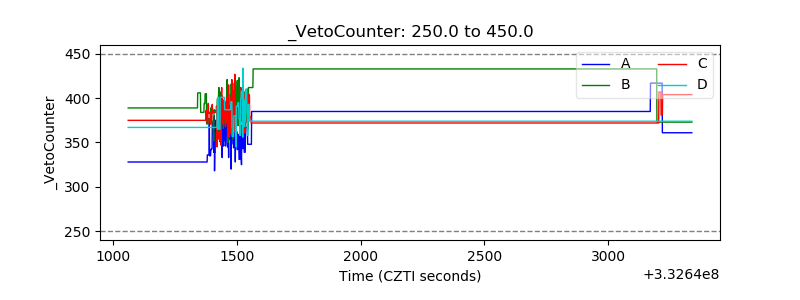 |