| Param | Original file | Final file |
|---|---|---|
| Filename | modeM0/AS1A07_068T01_9000003760_25962cztM0_level2.evt | modeM0/AS1A07_068T01_9000003760_25962cztM0_level2_quad_clean.evt |
| Size (bytes) | 641,410,560 | 126,201,600 |
| Size | 611.7 MB | 120.4 MB |
| Events in quadrant A | 4,623,287 | 804,911 |
| Events in quadrant B | 4,752,120 | 803,830 |
| Events in quadrant C | 4,701,631 | 767,547 |
| Events in quadrant D | 4,692,392 | 775,620 |
| Mode M0 | |||
|---|---|---|---|
| Quadrant | BADHDUFLAG | Total packets | Discarded packets |
| A | 0 | 19716 | 0 |
| B | 0 | 20008 | 0 |
| C | 0 | 19868 | 0 |
| D | 0 | 20480 | 0 |
| Mode M9 | |||
|---|---|---|---|
| Quadrant | BADHDUFLAG | Total packets | Discarded packets |
| A | 0 | 17 | 0 |
| B | 0 | 17 | 0 |
| C | 0 | 17 | 0 |
| D | 0 | 17 | 0 |
| Quadrant | Total seconds | Saturated seconds | Saturation percentage |
|---|---|---|---|
| A | 9674 | 65 | 0.671904% |
| B | 9673 | 86 | 0.889073% |
| C | 9674 | 125 | 1.292123% |
| D | 9674 | 75 | 0.775274% |
Noise dominated data is calculated using 1-second bins in cleaned event files. If a bin has >2000 counts, and if more than 50% of those come from <1% of pixels, then it is considered to be noise-dominated and hence unusable.
| Quadrant | # 1 sec bins | Bins with >0 counts | Bins with >2000 counts | High rate bins dominated by noise | Noise dominated (total time) | Noise dominated (detector-on time) | Marked lightcurve |
|---|---|---|---|---|---|---|---|
| A | 11324 | 9676 | 0 | 0 | 0.00% | 0.00% | 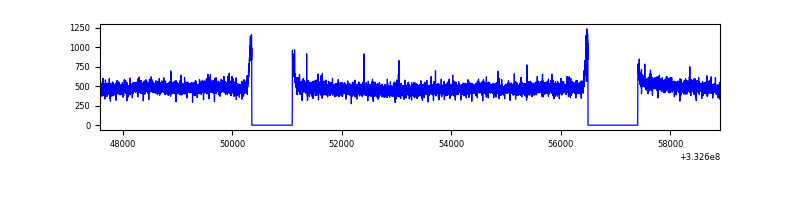 |
| B | 11324 | 9676 | 0 | 0 | 0.00% | 0.00% | 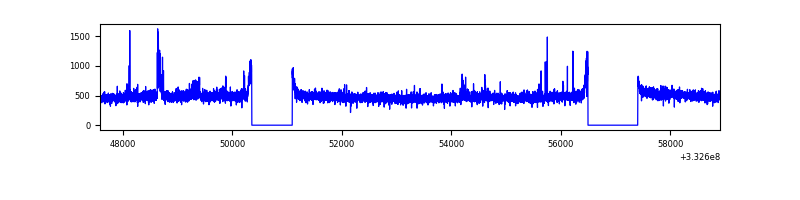 |
| C | 11324 | 9676 | 0 | 0 | 0.00% | 0.00% | 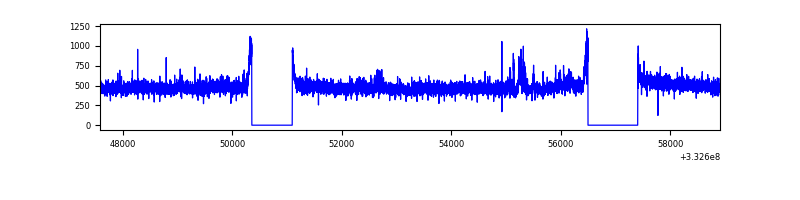 |
| D | 11324 | 9676 | 16 | 16 | 0.14% | 0.17% | 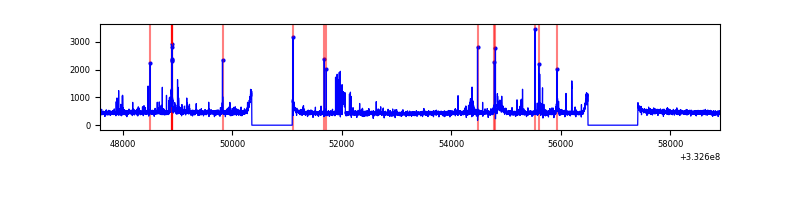 |
Top three noisy pixels from each quadrant. If the there are fewer than three noisy pixels in the level2.evt file, extra rows are filled as -1
| Pixel properties | Quadrant properties | ||||||
|---|---|---|---|---|---|---|---|
| Quadrant | DetID | PixID | Counts | Sigma | Mean | Median | Sigma |
| A | 13 | 254 | 13664 | 51.29 | 1197 | 1174 | 243.5 |
| A | 3 | 137 | 11432 | 42.12 | 1197 | 1174 | 243.5 |
| A | 0 | 226 | 10170 | 36.94 | 1197 | 1174 | 243.5 |
| B | 0 | 190 | 78827 | 341.8 | 1182 | 1153 | 227.2 |
| B | 12 | 111 | 28303 | 119.47 | 1182 | 1153 | 227.2 |
| B | 11 | 111 | 25558 | 107.39 | 1182 | 1153 | 227.2 |
| C | 14 | 238 | 181069 | 676.0 | 1136 | 1143 | 266.2 |
| C | 3 | 233 | 98046 | 364.07 | 1136 | 1143 | 266.2 |
| C | 13 | 61 | 7824 | 25.1 | 1136 | 1143 | 266.2 |
| D | 7 | 80 | 118094 | 425.81 | 1154 | 1124 | 274.7 |
| D | 13 | 168 | 66962 | 239.67 | 1154 | 1124 | 274.7 |
| D | 1 | 52 | 66004 | 236.18 | 1154 | 1124 | 274.7 |
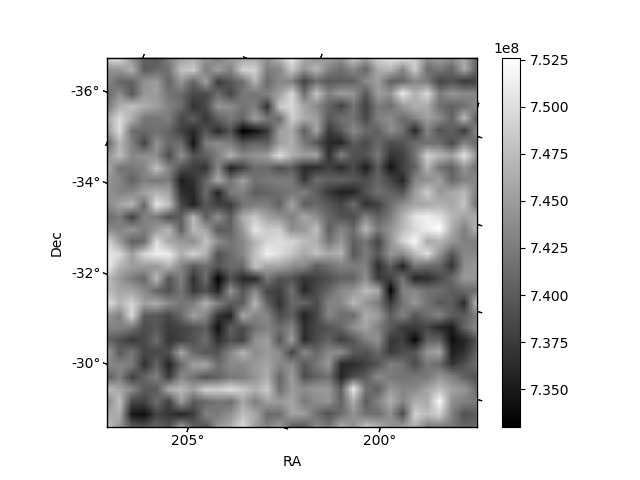
Histogram calculated using DETX and DETY for each event in the final _common_clean file
| Quadrant A |  |
 |
Quadrant B |
|---|---|---|---|
| Quadrant D |  |
 |
Quadrant C |
| Plot type | Count rate plots | Images |
|---|---|---|
| Comparison with Poisson distribution Blue bars denote a histogram of data divided into 1 sec bins. Red curve is a Poisson curve with rate = median count rate of data. |
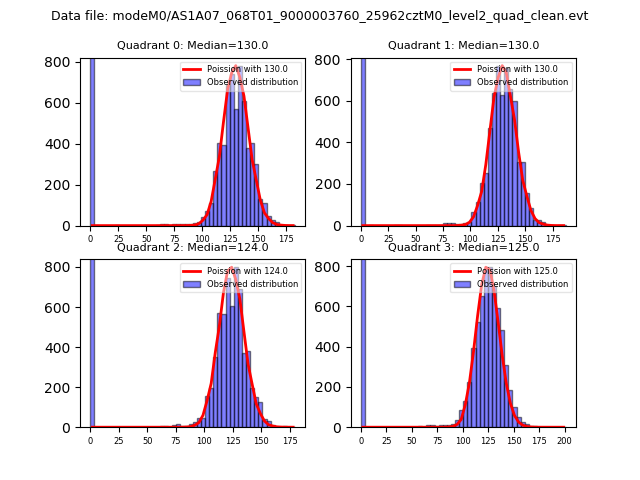 |
 |
| Quadrant-wise count rates Data is divided into 100 sec bins |
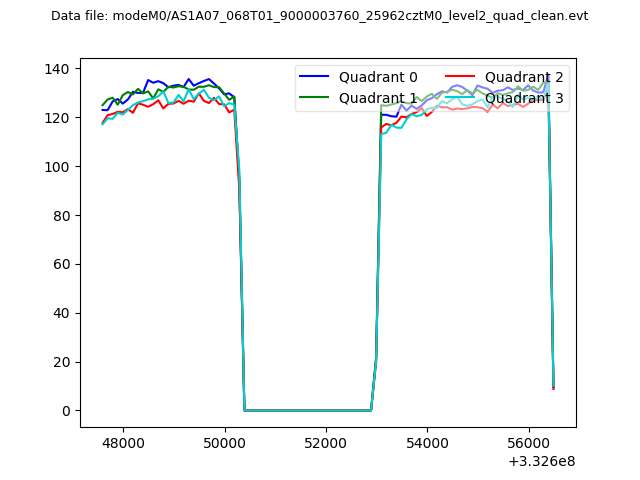 |
|
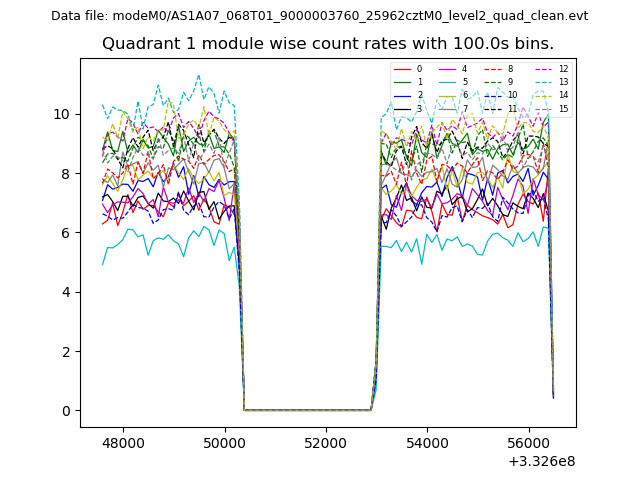
| Module-wise count rates for Quadrant A Data is divided into 100 sec bins |
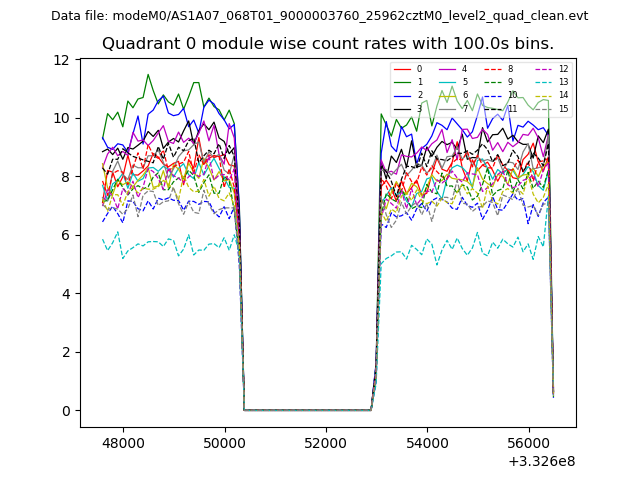 |
 |
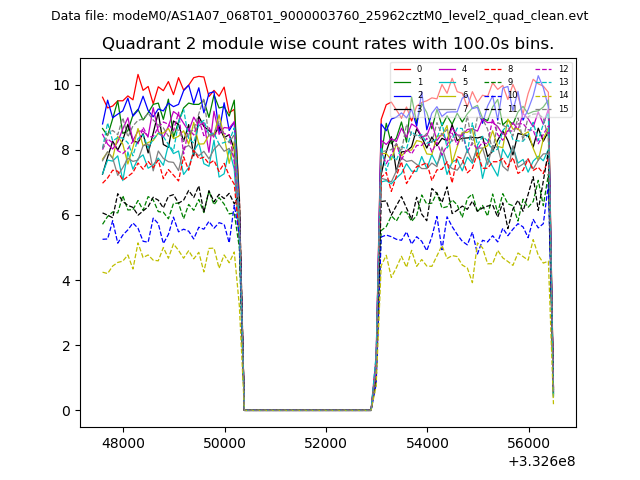
| Module-wise count rates for Quadrant B Data is divided into 100 sec bins |
 |
 |
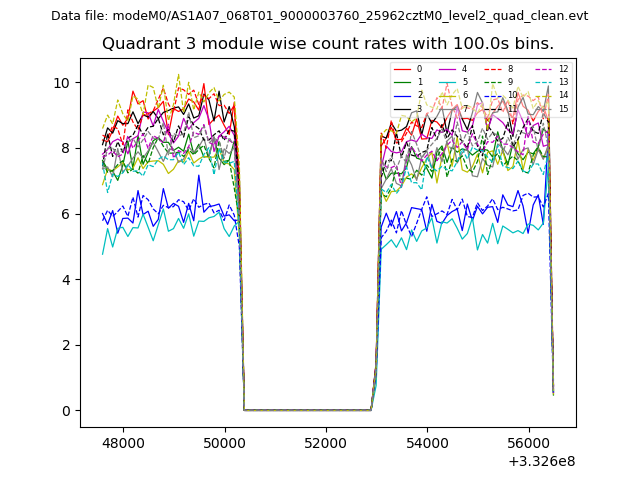
| Module-wise count rates for Quadrant C Data is divided into 100 sec bins |
 |
 |
| Module-wise count rates for Quadrant D Data is divided into 100 sec bins |
 |
 |
| Parameter | Plot |
|---|---|
| CZT HV Monitor | 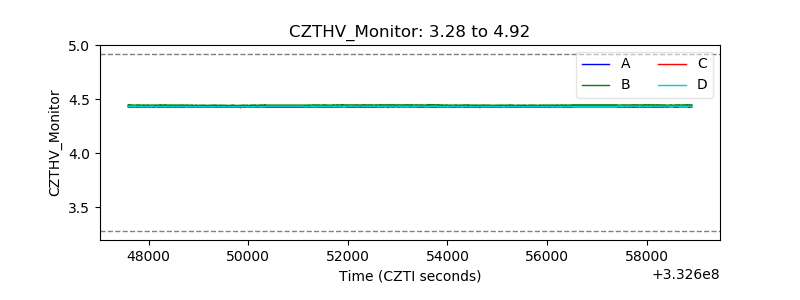 |
| D_VDD | 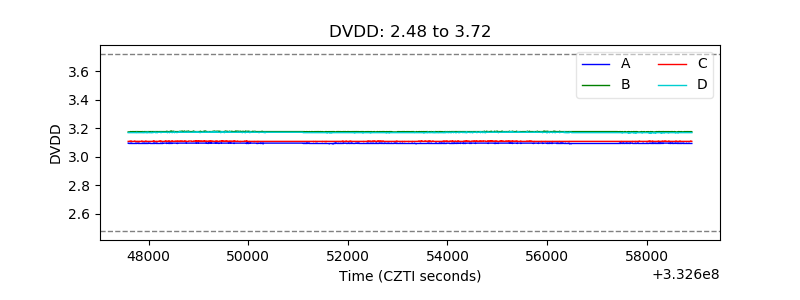 |
| Temperature 1 | 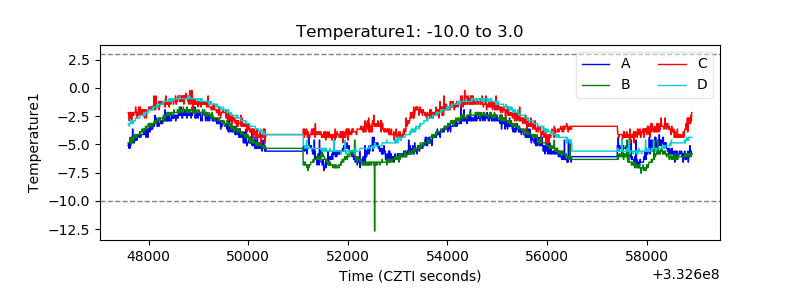 |
| Veto HV Monitor | 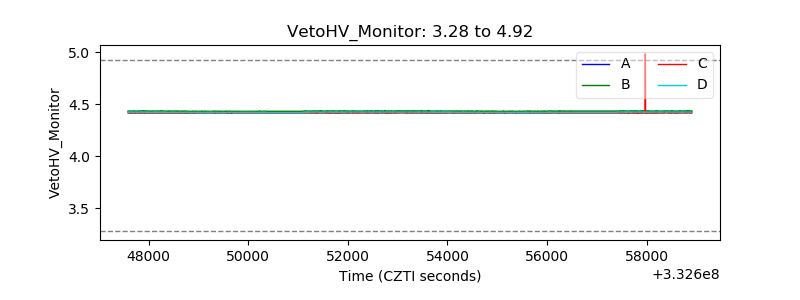 |
| Veto LLD | 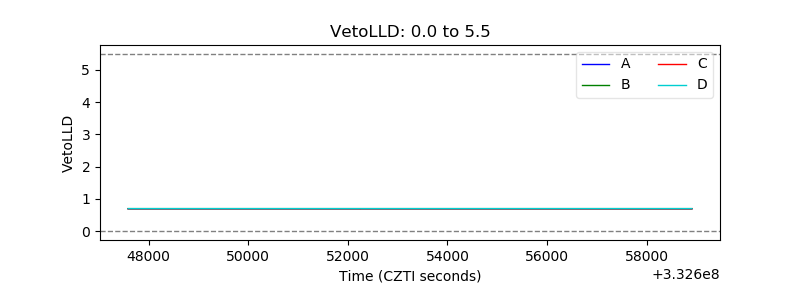 |
| Alpha Counter | 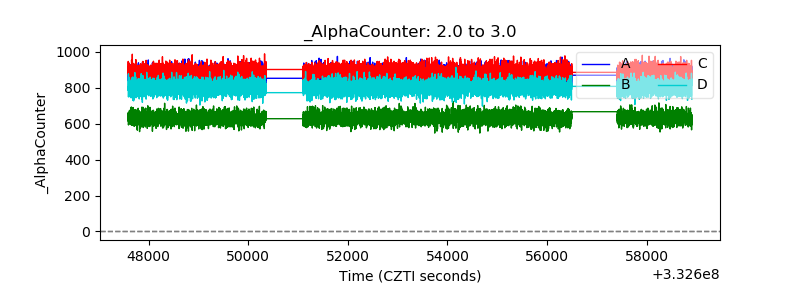 |
| _CPM_Rate | 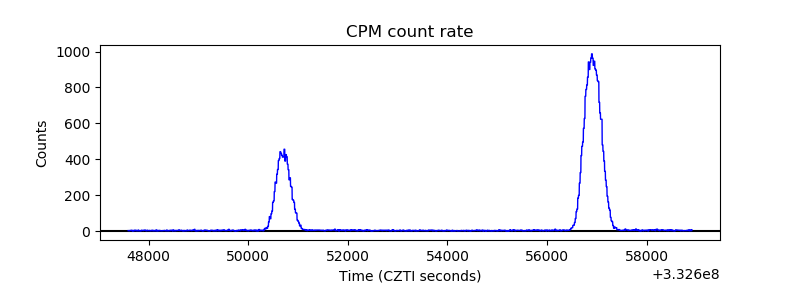 |
| CZT Counter |  |
| +2.5 Volts monitor |  |
| +5 Volts monitor |  |
| _ROLL_ROT | 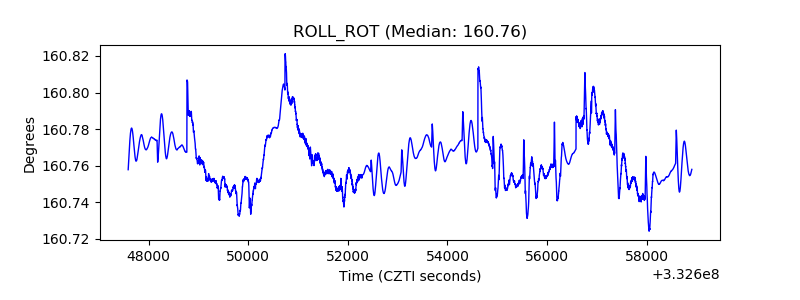 |
| _Roll_DEC | 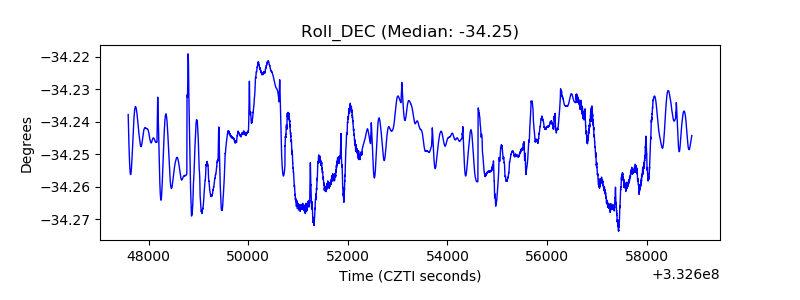 |
| _Roll_RA | 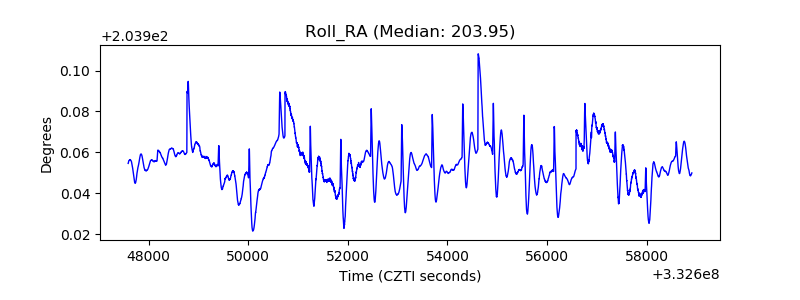 |
| Veto Counter | 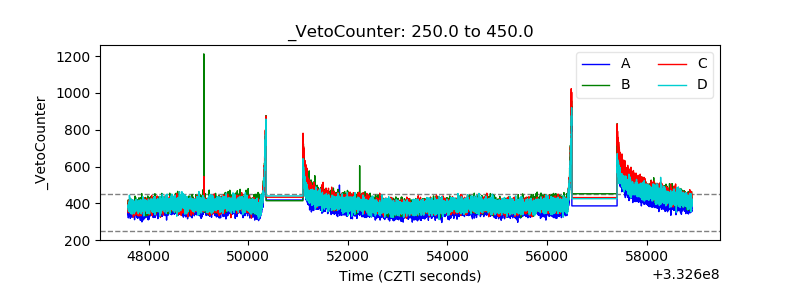 |