| Param | Original file | Final file |
|---|---|---|
| Filename | modeM0/AS1A07_068T01_9000003760_25965cztM0_level2.evt | modeM0/AS1A07_068T01_9000003760_25965cztM0_level2_quad_clean.evt |
| Size (bytes) | 478,025,280 | 96,114,240 |
| Size | 455.9 MB | 91.7 MB |
| Events in quadrant A | 3,342,002 | 629,543 |
| Events in quadrant B | 3,350,246 | 633,213 |
| Events in quadrant C | 3,367,877 | 601,817 |
| Events in quadrant D | 3,982,343 | 599,704 |
| Mode M0 | |||
|---|---|---|---|
| Quadrant | BADHDUFLAG | Total packets | Discarded packets |
| A | 0 | 13948 | 0 |
| B | 0 | 13958 | 0 |
| C | 0 | 14178 | 0 |
| D | 0 | 16173 | 0 |
| Mode M9 | |||
|---|---|---|---|
| Quadrant | BADHDUFLAG | Total packets | Discarded packets |
| A | 0 | 11 | 0 |
| B | 0 | 11 | 0 |
| C | 0 | 12 | 0 |
| D | 0 | 12 | 0 |
| Quadrant | Total seconds | Saturated seconds | Saturation percentage |
|---|---|---|---|
| A | 6400 | 40 | 0.625000% |
| B | 6401 | 52 | 0.812373% |
| C | 6401 | 109 | 1.702859% |
| D | 6401 | 138 | 2.155913% |
Noise dominated data is calculated using 1-second bins in cleaned event files. If a bin has >2000 counts, and if more than 50% of those come from <1% of pixels, then it is considered to be noise-dominated and hence unusable.
| Quadrant | # 1 sec bins | Bins with >0 counts | Bins with >2000 counts | High rate bins dominated by noise | Noise dominated (total time) | Noise dominated (detector-on time) | Marked lightcurve |
|---|---|---|---|---|---|---|---|
| A | 7566 | 6402 | 0 | 0 | 0.00% | 0.00% | 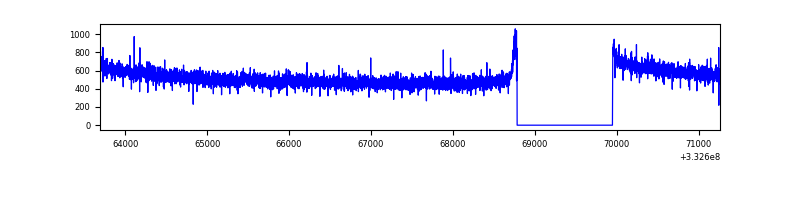 |
| B | 7566 | 6402 | 0 | 0 | 0.00% | 0.00% | 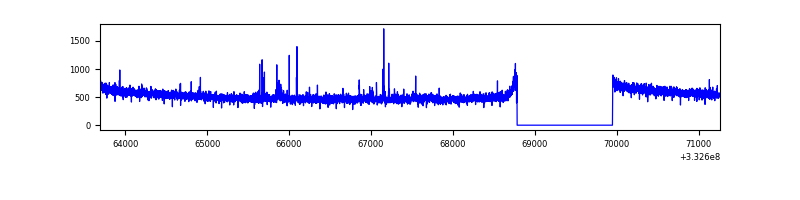 |
| C | 7566 | 6401 | 2 | 2 | 0.03% | 0.03% | 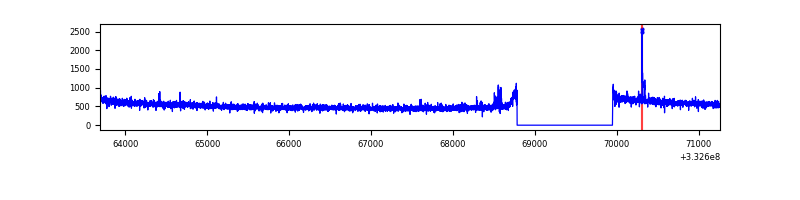 |
| D | 7566 | 6402 | 99 | 99 | 1.31% | 1.55% | 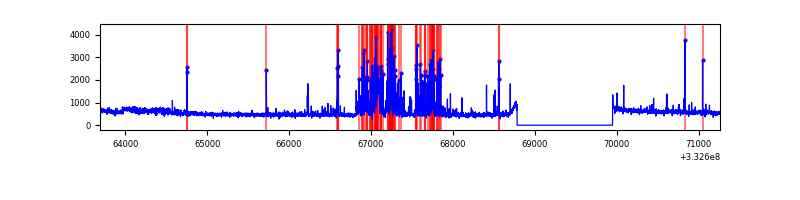 |
Top three noisy pixels from each quadrant. If the there are fewer than three noisy pixels in the level2.evt file, extra rows are filled as -1
| Pixel properties | Quadrant properties | ||||||
|---|---|---|---|---|---|---|---|
| Quadrant | DetID | PixID | Counts | Sigma | Mean | Median | Sigma |
| A | 6 | 16 | 12230 | 66.62 | 864 | 849 | 170.8 |
| A | 13 | 254 | 8649 | 45.66 | 864 | 849 | 170.8 |
| A | 3 | 137 | 7459 | 38.69 | 864 | 849 | 170.8 |
| B | 12 | 111 | 19209 | 114.85 | 846 | 826 | 160.1 |
| B | 11 | 111 | 17439 | 103.79 | 846 | 826 | 160.1 |
| B | 0 | 245 | 17178 | 102.16 | 846 | 826 | 160.1 |
| C | 14 | 238 | 133110 | 697.5 | 820 | 826 | 189.7 |
| C | 3 | 233 | 20577 | 104.14 | 820 | 826 | 189.7 |
| C | 7 | 238 | 18069 | 90.92 | 820 | 826 | 189.7 |
| D | 1 | 52 | 734068 | 3775.0 | 831 | 814 | 194.2 |
| D | 12 | 233 | 77873 | 396.72 | 831 | 814 | 194.2 |
| D | 2 | 234 | 23518 | 116.89 | 831 | 814 | 194.2 |
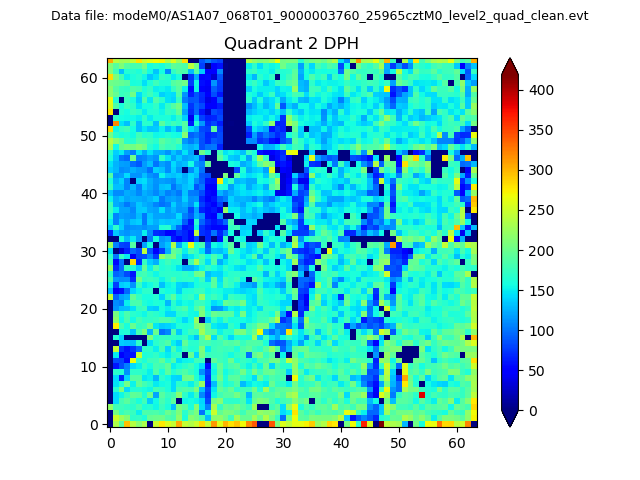
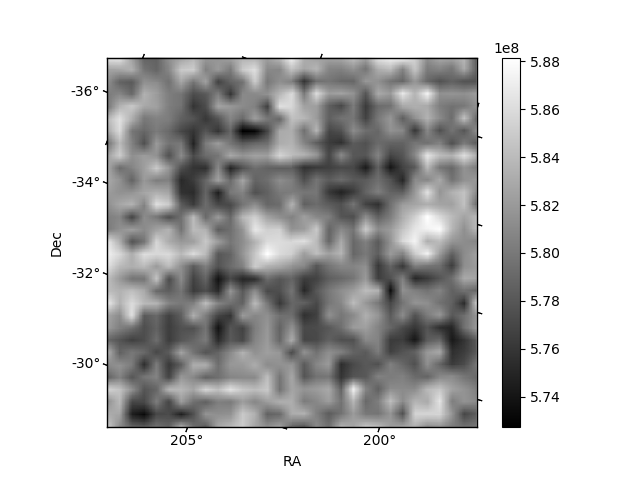
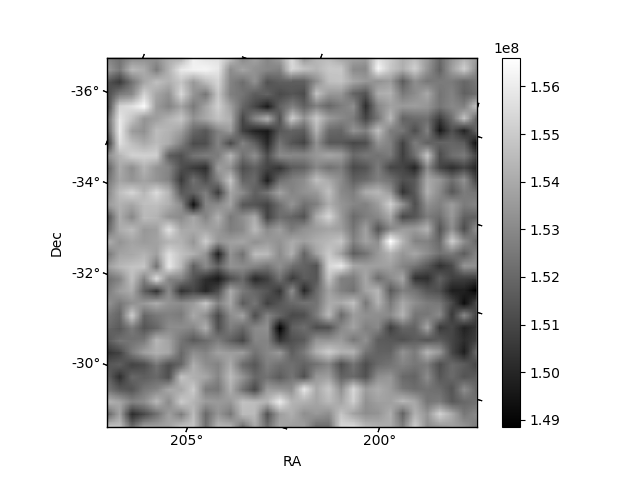
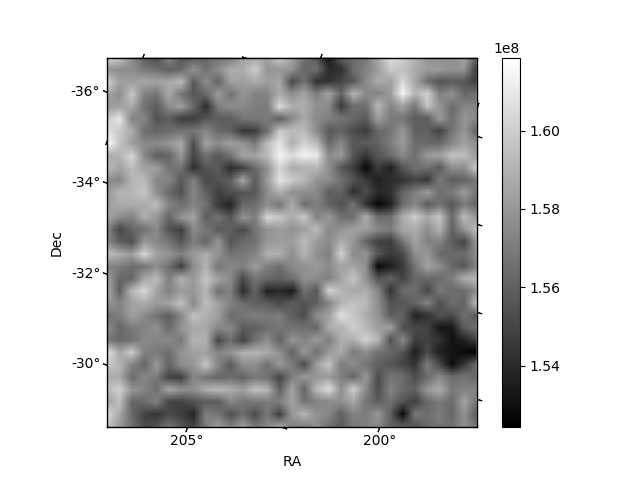
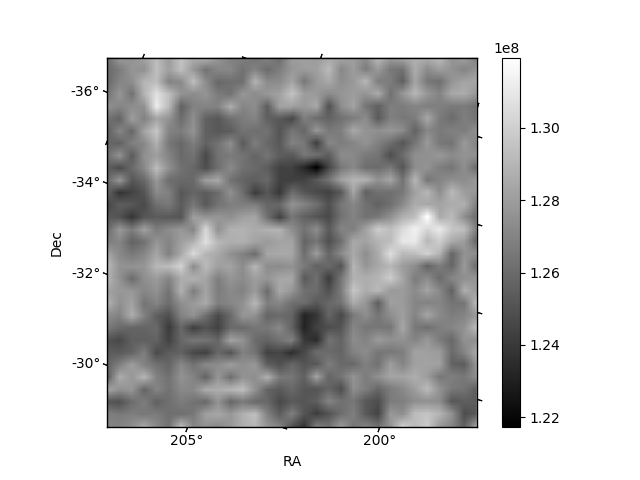
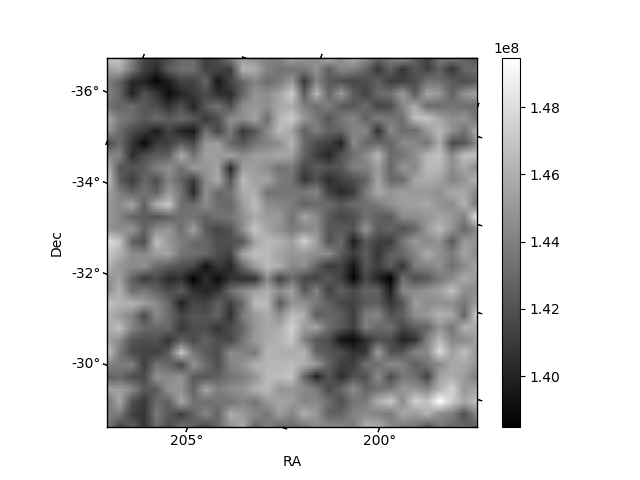
Histogram calculated using DETX and DETY for each event in the final _common_clean file
| Quadrant A | 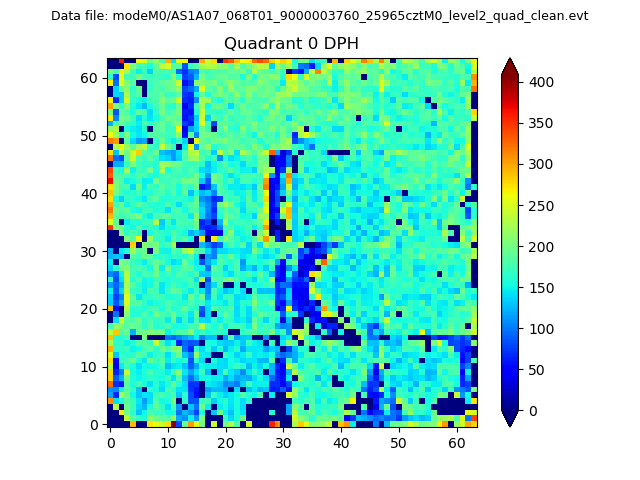 |
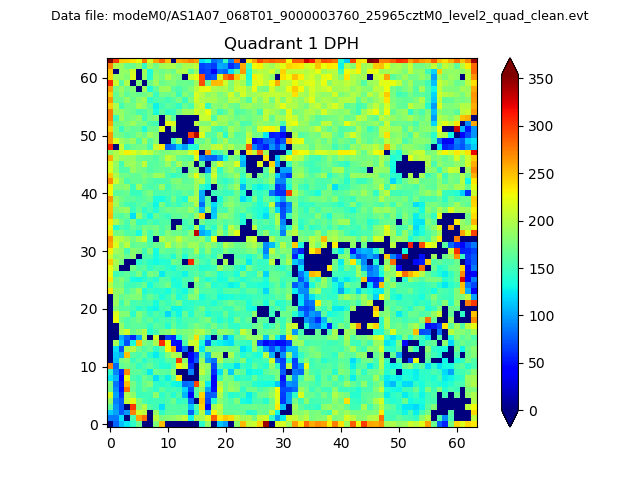 |
Quadrant B |
|---|---|---|---|
| Quadrant D | 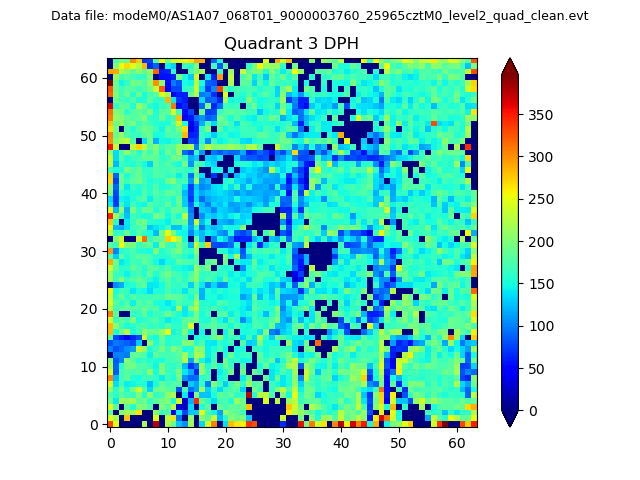 |
 |
Quadrant C |
| Plot type | Count rate plots | Images |
|---|---|---|
| Comparison with Poisson distribution Blue bars denote a histogram of data divided into 1 sec bins. Red curve is a Poisson curve with rate = median count rate of data. |
 |
 |
| Quadrant-wise count rates Data is divided into 100 sec bins |
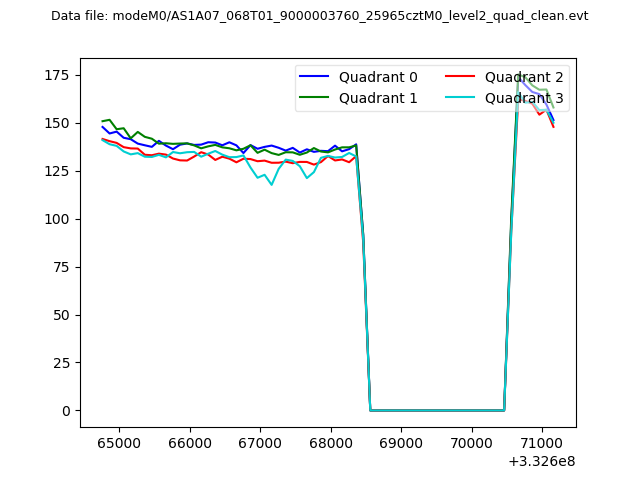 |
|
| Module-wise count rates for Quadrant A Data is divided into 100 sec bins |
 |
 |
| Module-wise count rates for Quadrant B Data is divided into 100 sec bins |
 |
 |
| Module-wise count rates for Quadrant C Data is divided into 100 sec bins |
 |
 |
| Module-wise count rates for Quadrant D Data is divided into 100 sec bins |
 |
 |
| Parameter | Plot |
|---|---|
| CZT HV Monitor |  |
| D_VDD | 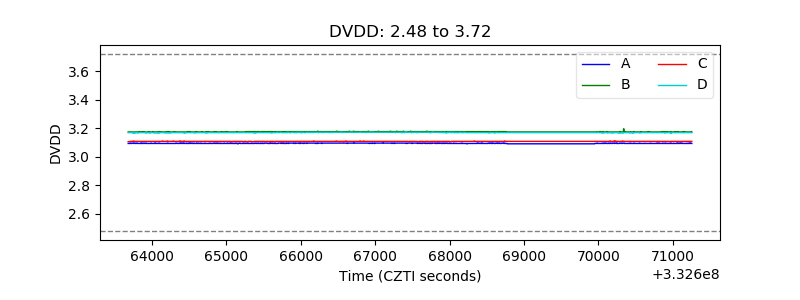 |
| Temperature 1 | 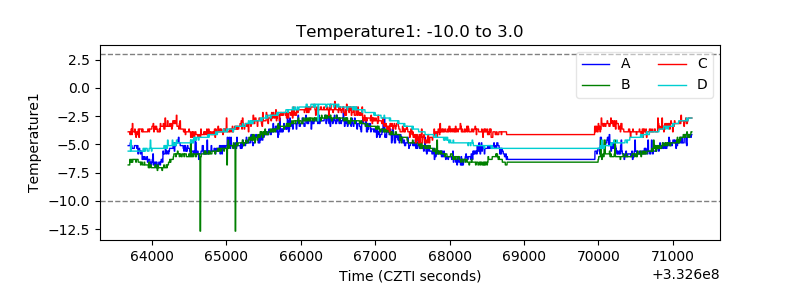 |
| Veto HV Monitor | 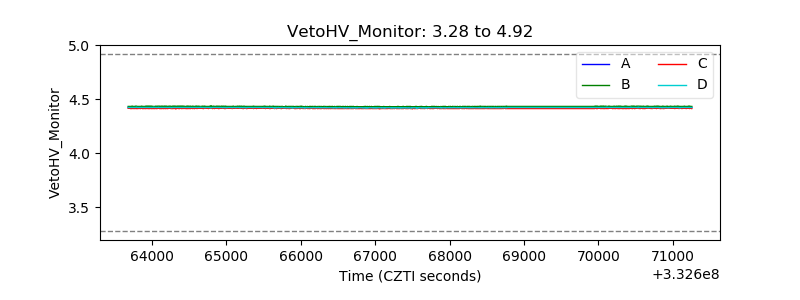 |
| Veto LLD | 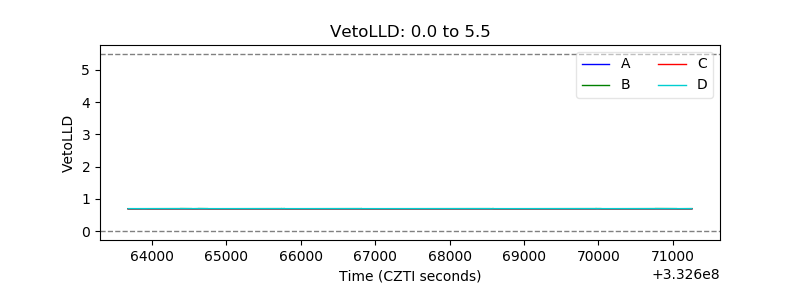 |
| Alpha Counter | 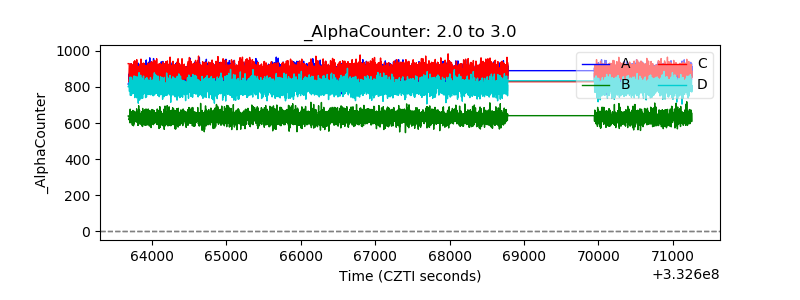 |
| _CPM_Rate |  |
| CZT Counter | 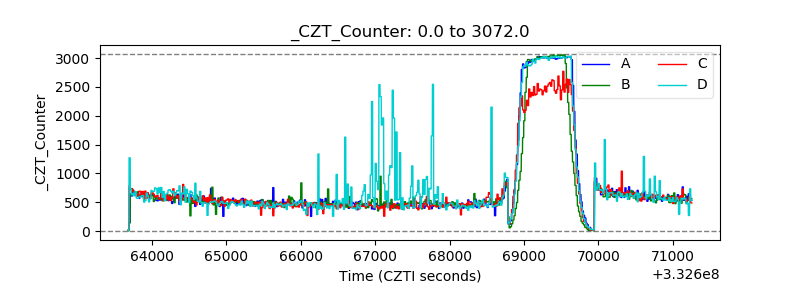 |
| +2.5 Volts monitor |  |
| +5 Volts monitor | 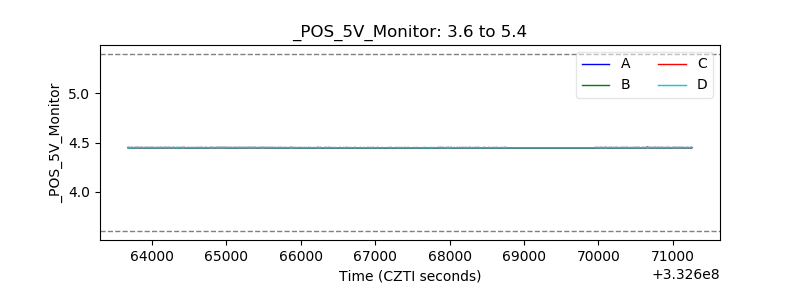 |
| _ROLL_ROT | 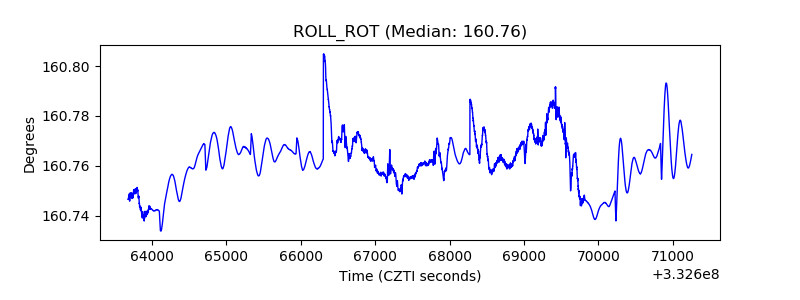 |
| _Roll_DEC | 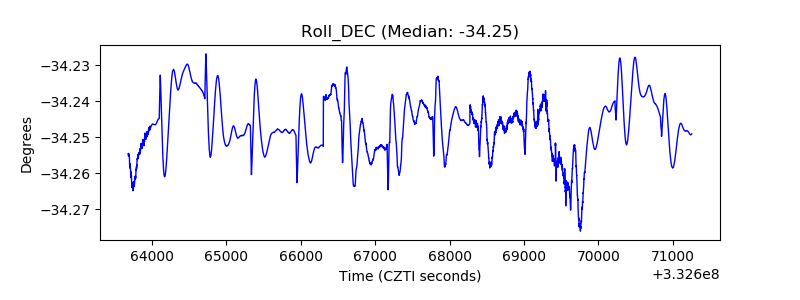 |
| _Roll_RA | 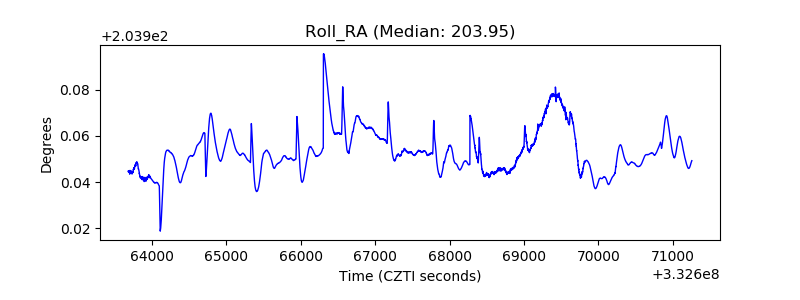 |
| Veto Counter |  |