| Param | Original file | Final file |
|---|---|---|
| Filename | modeM0/AS1A07_068T01_9000003760_25966cztM0_level2.evt | modeM0/AS1A07_068T01_9000003760_25966cztM0_level2_quad_clean.evt |
| Size (bytes) | 491,875,200 | 112,939,200 |
| Size | 469.1 MB | 107.7 MB |
| Events in quadrant A | 3,456,536 | 766,254 |
| Events in quadrant B | 3,468,783 | 765,735 |
| Events in quadrant C | 3,465,416 | 723,711 |
| Events in quadrant D | 4,077,766 | 724,758 |
| Mode M0 | |||
|---|---|---|---|
| Quadrant | BADHDUFLAG | Total packets | Discarded packets |
| A | 0 | 14346 | 0 |
| B | 0 | 14416 | 0 |
| C | 0 | 14535 | 0 |
| D | 0 | 16334 | 0 |
| Mode M9 | |||
|---|---|---|---|
| Quadrant | BADHDUFLAG | Total packets | Discarded packets |
| A | 0 | 14 | 0 |
| B | 0 | 15 | 0 |
| C | 0 | 15 | 0 |
| D | 0 | 15 | 0 |
| Quadrant | Total seconds | Saturated seconds | Saturation percentage |
|---|---|---|---|
| A | 6308 | 58 | 0.919467% |
| B | 6308 | 66 | 1.046290% |
| C | 6308 | 132 | 2.092581% |
| D | 6308 | 169 | 2.679138% |
Noise dominated data is calculated using 1-second bins in cleaned event files. If a bin has >2000 counts, and if more than 50% of those come from <1% of pixels, then it is considered to be noise-dominated and hence unusable.
| Quadrant | # 1 sec bins | Bins with >0 counts | Bins with >2000 counts | High rate bins dominated by noise | Noise dominated (total time) | Noise dominated (detector-on time) | Marked lightcurve |
|---|---|---|---|---|---|---|---|
| A | 7578 | 6309 | 0 | 0 | 0.00% | 0.00% | 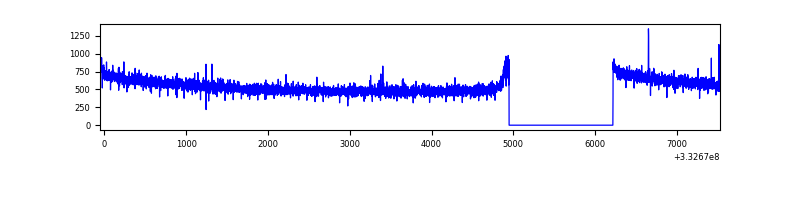 |
| B | 7578 | 6309 | 2 | 2 | 0.03% | 0.03% | 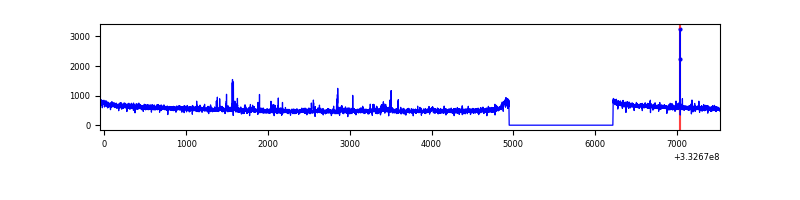 |
| C | 7578 | 6309 | 2 | 2 | 0.03% | 0.03% | 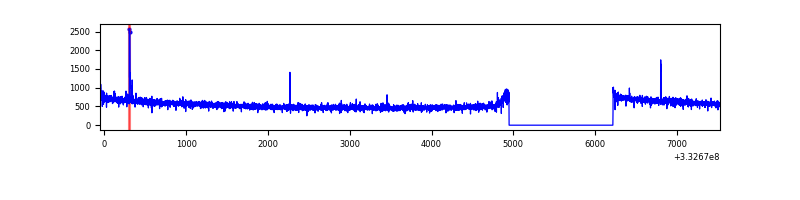 |
| D | 7578 | 6309 | 95 | 95 | 1.25% | 1.51% |  |
Top three noisy pixels from each quadrant. If the there are fewer than three noisy pixels in the level2.evt file, extra rows are filled as -1
| Pixel properties | Quadrant properties | ||||||
|---|---|---|---|---|---|---|---|
| Quadrant | DetID | PixID | Counts | Sigma | Mean | Median | Sigma |
| A | 13 | 254 | 9165 | 47.17 | 895 | 881 | 175.6 |
| A | 6 | 16 | 7932 | 40.15 | 895 | 881 | 175.6 |
| A | 0 | 226 | 7633 | 38.45 | 895 | 881 | 175.6 |
| B | 0 | 245 | 34314 | 206.59 | 868 | 848 | 162.0 |
| B | 0 | 230 | 24516 | 146.11 | 868 | 848 | 162.0 |
| B | 12 | 111 | 19092 | 112.62 | 868 | 848 | 162.0 |
| C | 14 | 238 | 137775 | 707.32 | 842 | 849 | 193.6 |
| C | 3 | 233 | 33276 | 167.51 | 842 | 849 | 193.6 |
| C | 7 | 238 | 15897 | 77.73 | 842 | 849 | 193.6 |
| D | 1 | 52 | 684911 | 3379.91 | 861 | 844 | 202.4 |
| D | 7 | 80 | 93364 | 457.13 | 861 | 844 | 202.4 |
| D | 2 | 234 | 23749 | 113.17 | 861 | 844 | 202.4 |
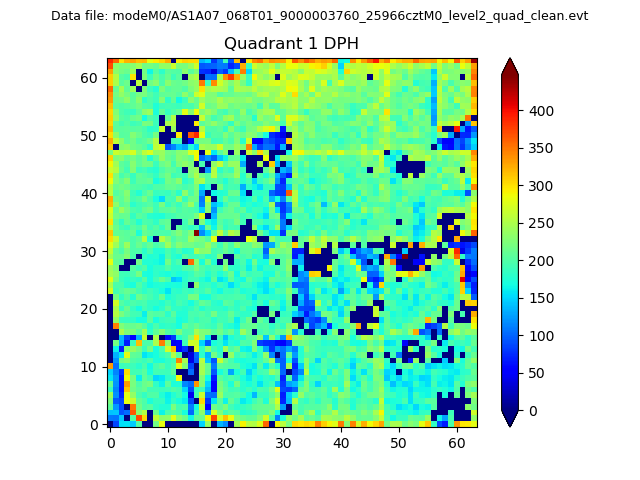
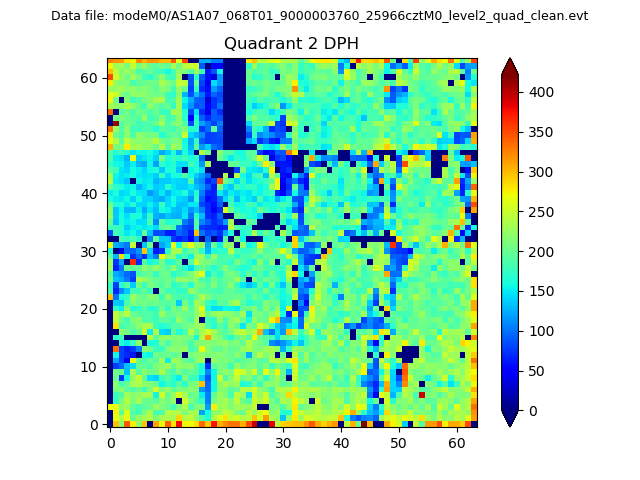
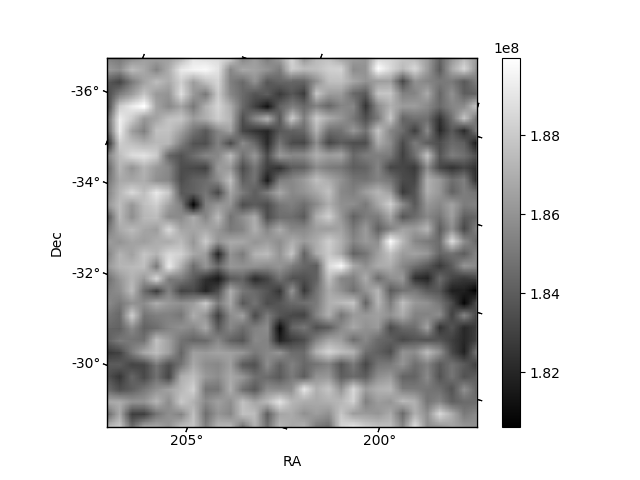
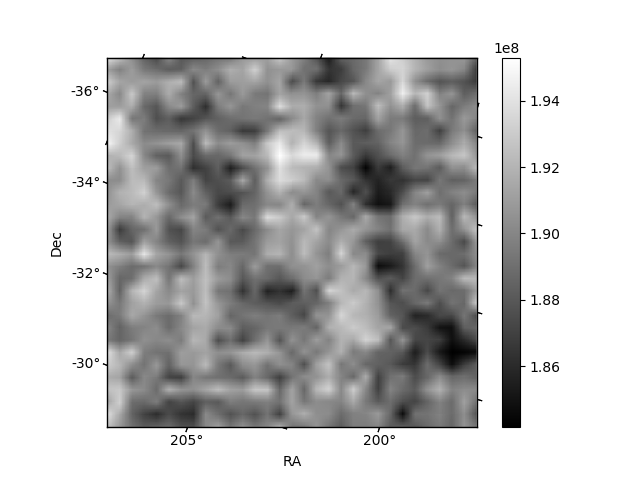
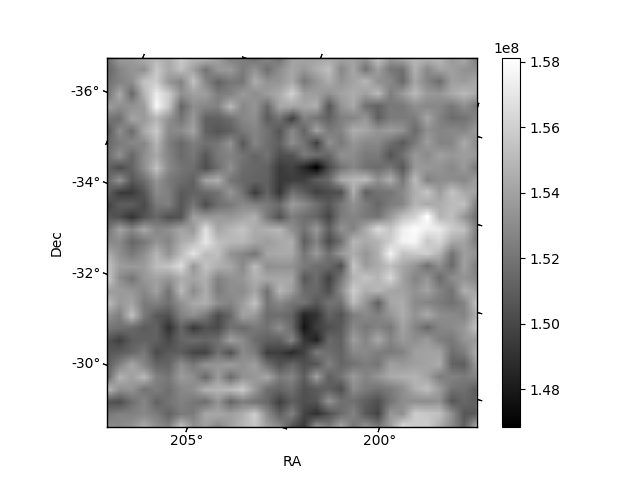
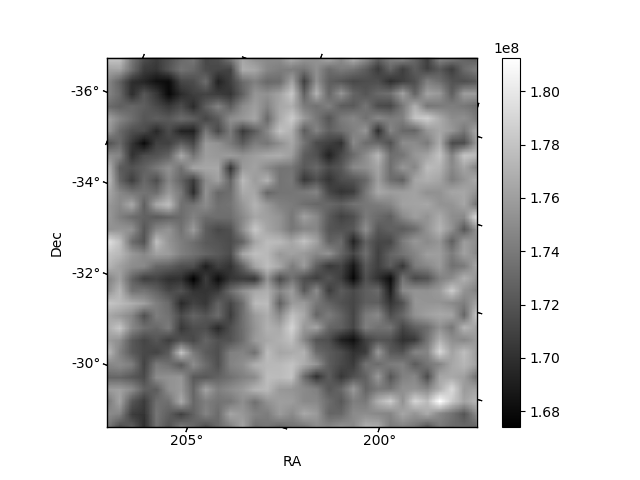
Histogram calculated using DETX and DETY for each event in the final _common_clean file
| Quadrant A | 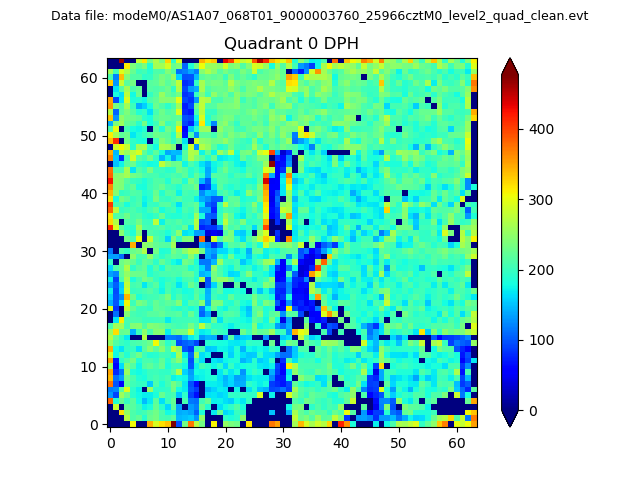 |
 |
Quadrant B |
|---|---|---|---|
| Quadrant D | 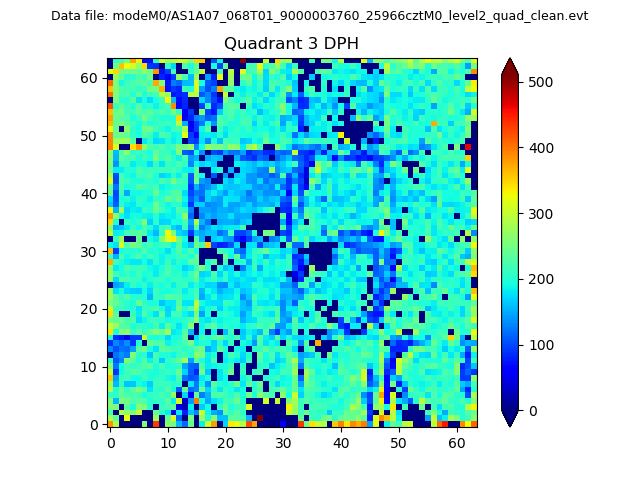 |
 |
Quadrant C |
| Plot type | Count rate plots | Images |
|---|---|---|
| Comparison with Poisson distribution Blue bars denote a histogram of data divided into 1 sec bins. Red curve is a Poisson curve with rate = median count rate of data. |
 |
 |
| Quadrant-wise count rates Data is divided into 100 sec bins |
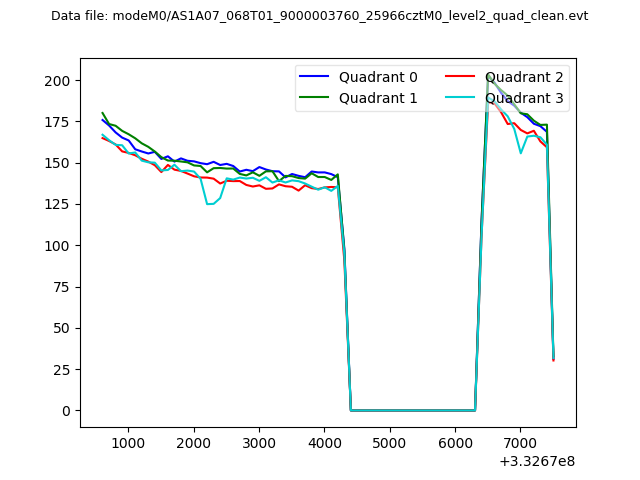 |
|
| Module-wise count rates for Quadrant A Data is divided into 100 sec bins |
 |
 |
| Module-wise count rates for Quadrant B Data is divided into 100 sec bins |
 |
 |
| Module-wise count rates for Quadrant C Data is divided into 100 sec bins |
 |
 |
| Module-wise count rates for Quadrant D Data is divided into 100 sec bins |
 |
 |
| Parameter | Plot |
|---|---|
| CZT HV Monitor |  |
| D_VDD | 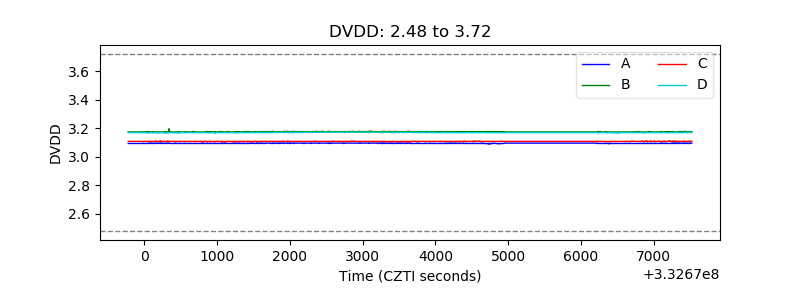 |
| Temperature 1 |  |
| Veto HV Monitor | 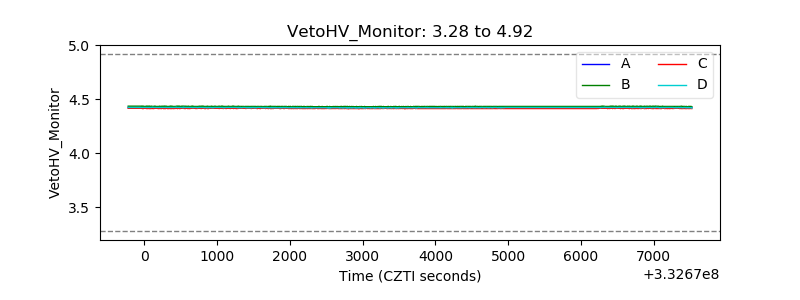 |
| Veto LLD |  |
| Alpha Counter | 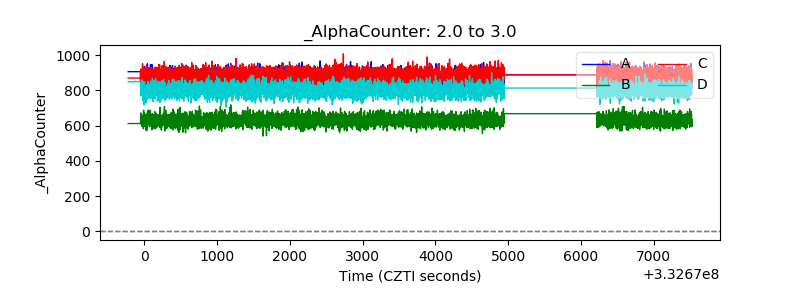 |
| _CPM_Rate | 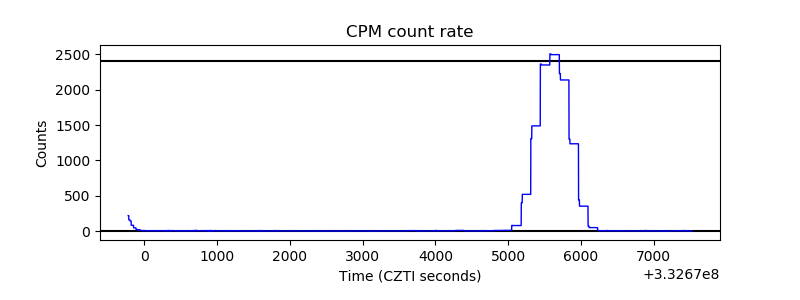 |
| CZT Counter | 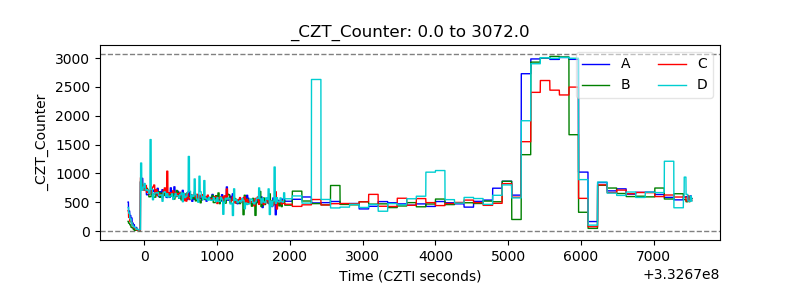 |
| +2.5 Volts monitor |  |
| +5 Volts monitor | 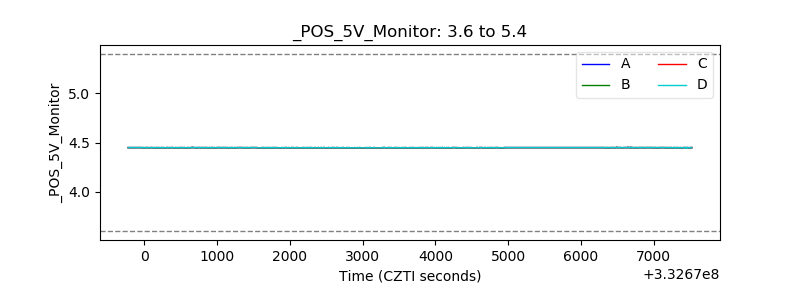 |
| _ROLL_ROT |  |
| _Roll_DEC | 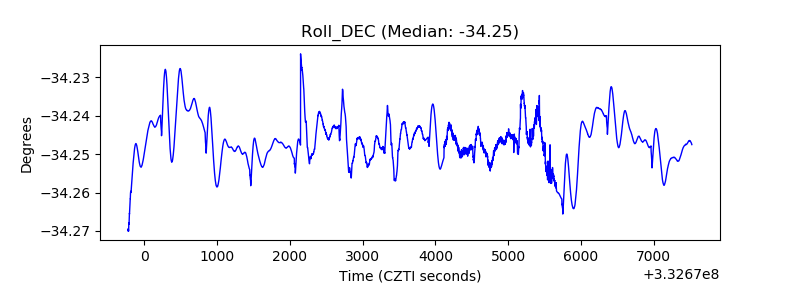 |
| _Roll_RA | 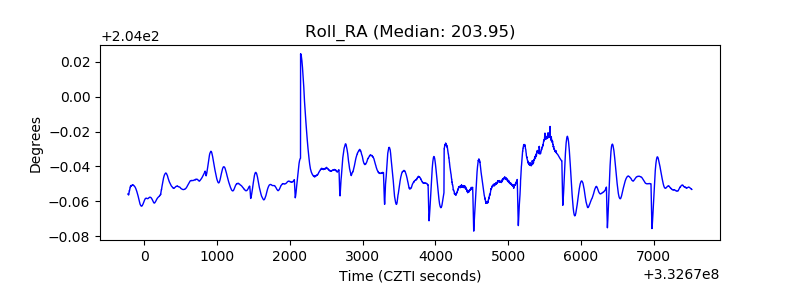 |
| Veto Counter |  |