| Param | Original file | Final file |
|---|---|---|
| Filename | modeM0/AS1A07_068T01_9000003760_25967cztM0_level2.evt | modeM0/AS1A07_068T01_9000003760_25967cztM0_level2_quad_clean.evt |
| Size (bytes) | 514,823,040 | 128,704,320 |
| Size | 491.0 MB | 122.7 MB |
| Events in quadrant A | 3,457,054 | 898,020 |
| Events in quadrant B | 3,418,323 | 891,357 |
| Events in quadrant C | 3,465,175 | 838,212 |
| Events in quadrant D | 4,826,150 | 833,560 |
| Mode M0 | |||
|---|---|---|---|
| Quadrant | BADHDUFLAG | Total packets | Discarded packets |
| A | 0 | 14292 | 0 |
| B | 0 | 14114 | 0 |
| C | 0 | 14367 | 0 |
| D | 0 | 18662 | 0 |
| Mode M9 | |||
|---|---|---|---|
| Quadrant | BADHDUFLAG | Total packets | Discarded packets |
| A | 0 | 13 | 0 |
| B | 0 | 13 | 0 |
| C | 0 | 13 | 0 |
| D | 0 | 13 | 0 |
| Quadrant | Total seconds | Saturated seconds | Saturation percentage |
|---|---|---|---|
| A | 6268 | 95 | 1.515635% |
| B | 6267 | 111 | 1.771182% |
| C | 6268 | 149 | 2.377154% |
| D | 6268 | 328 | 5.232929% |
Noise dominated data is calculated using 1-second bins in cleaned event files. If a bin has >2000 counts, and if more than 50% of those come from <1% of pixels, then it is considered to be noise-dominated and hence unusable.
| Quadrant | # 1 sec bins | Bins with >0 counts | Bins with >2000 counts | High rate bins dominated by noise | Noise dominated (total time) | Noise dominated (detector-on time) | Marked lightcurve |
|---|---|---|---|---|---|---|---|
| A | 7543 | 6269 | 0 | 0 | 0.00% | 0.00% | 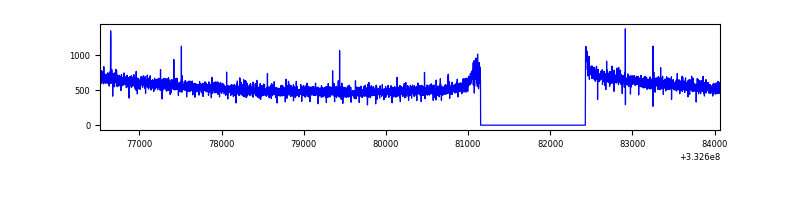 |
| B | 7542 | 6268 | 2 | 2 | 0.03% | 0.03% | 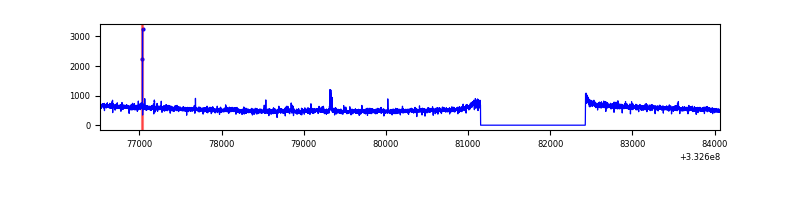 |
| C | 7543 | 6269 | 0 | 0 | 0.00% | 0.00% | 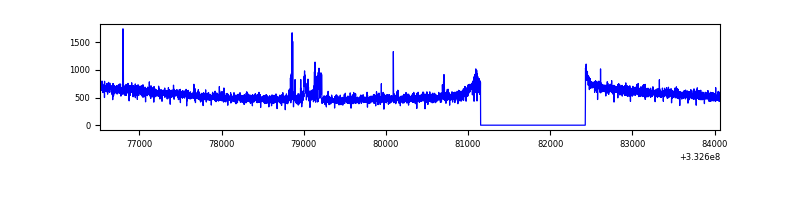 |
| D | 7543 | 6269 | 255 | 255 | 3.38% | 4.07% | 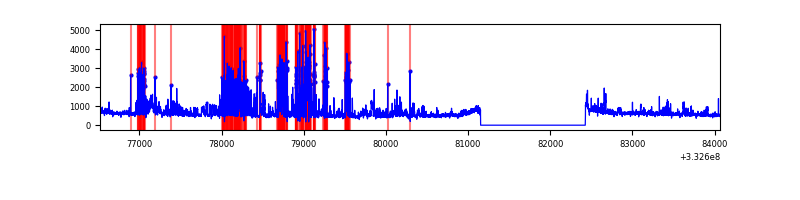 |
Top three noisy pixels from each quadrant. If the there are fewer than three noisy pixels in the level2.evt file, extra rows are filled as -1
| Pixel properties | Quadrant properties | ||||||
|---|---|---|---|---|---|---|---|
| Quadrant | DetID | PixID | Counts | Sigma | Mean | Median | Sigma |
| A | 6 | 16 | 10875 | 56.84 | 893 | 879 | 175.9 |
| A | 13 | 254 | 9561 | 49.37 | 893 | 879 | 175.9 |
| A | 0 | 226 | 7768 | 39.17 | 893 | 879 | 175.9 |
| B | 0 | 230 | 19586 | 117.22 | 862 | 843 | 159.9 |
| B | 12 | 111 | 18768 | 112.1 | 862 | 843 | 159.9 |
| B | 11 | 111 | 17133 | 101.88 | 862 | 843 | 159.9 |
| C | 14 | 238 | 137952 | 716.94 | 831 | 837 | 191.2 |
| C | 7 | 238 | 60079 | 309.76 | 831 | 837 | 191.2 |
| C | 3 | 233 | 31203 | 158.78 | 831 | 837 | 191.2 |
| D | 1 | 52 | 1577709 | 7832.52 | 854 | 836 | 201.3 |
| D | 2 | 234 | 24820 | 119.13 | 854 | 836 | 201.3 |
| D | 2 | 120 | 8602 | 38.57 | 854 | 836 | 201.3 |
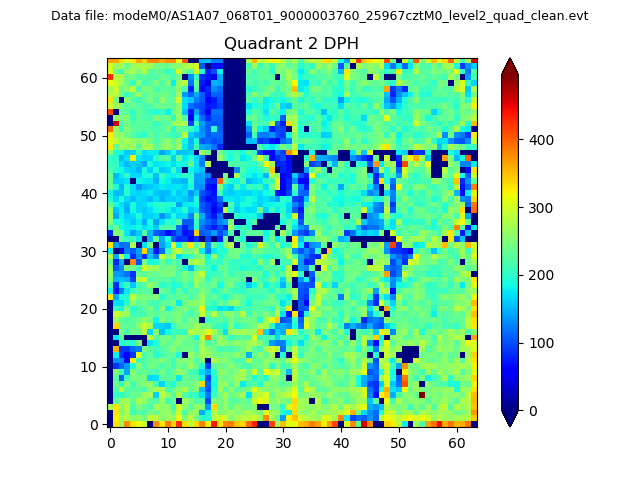
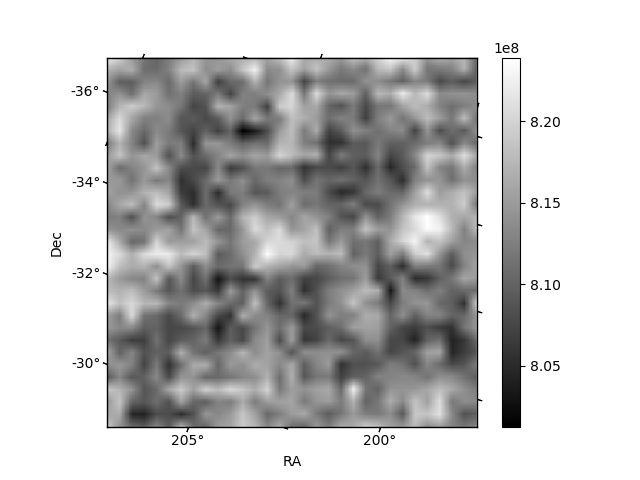
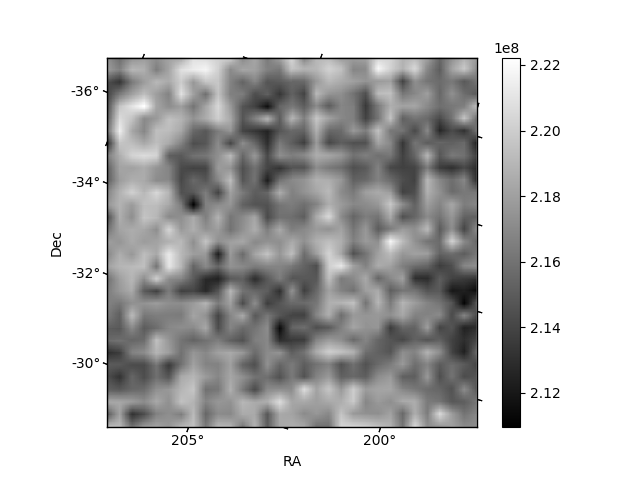
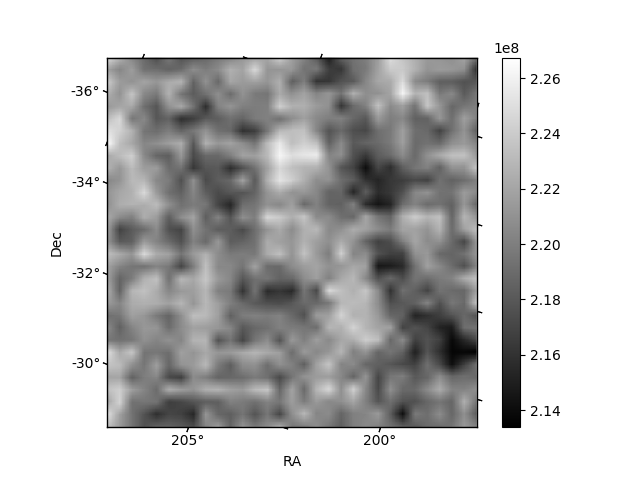
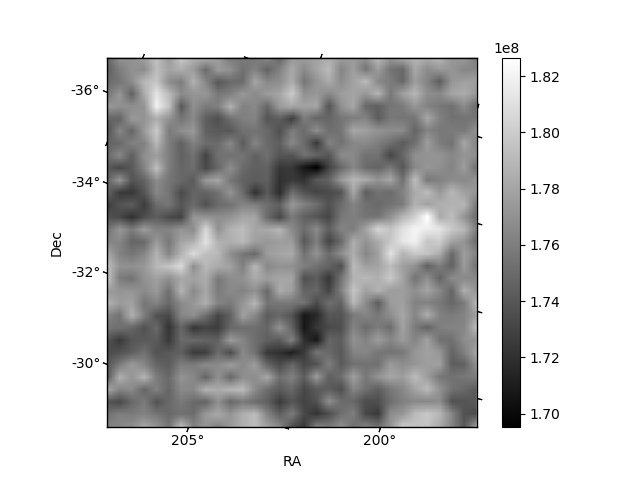
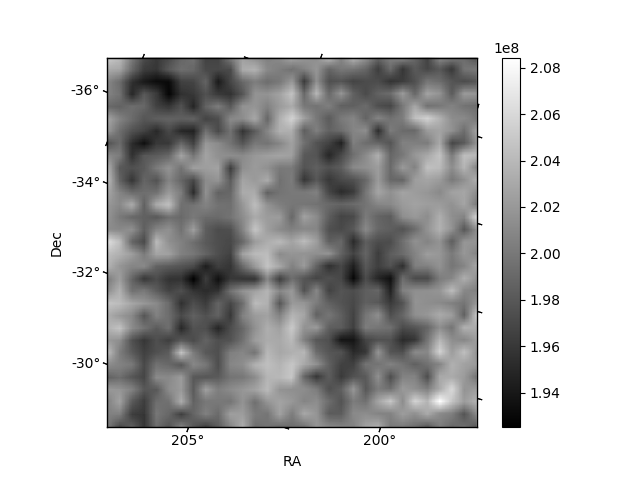
Histogram calculated using DETX and DETY for each event in the final _common_clean file
| Quadrant A | 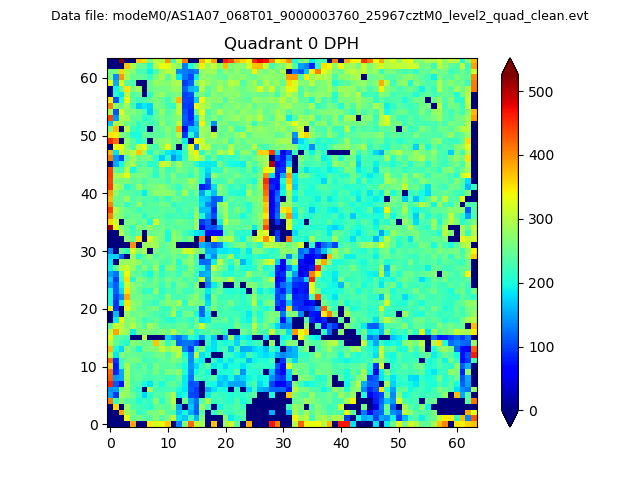 |
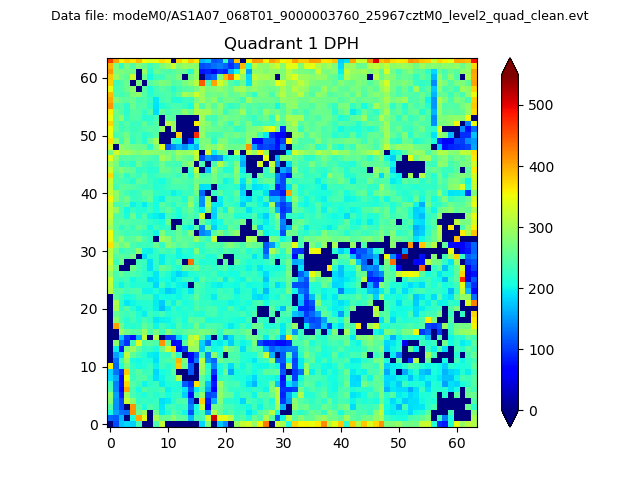 |
Quadrant B |
|---|---|---|---|
| Quadrant D | 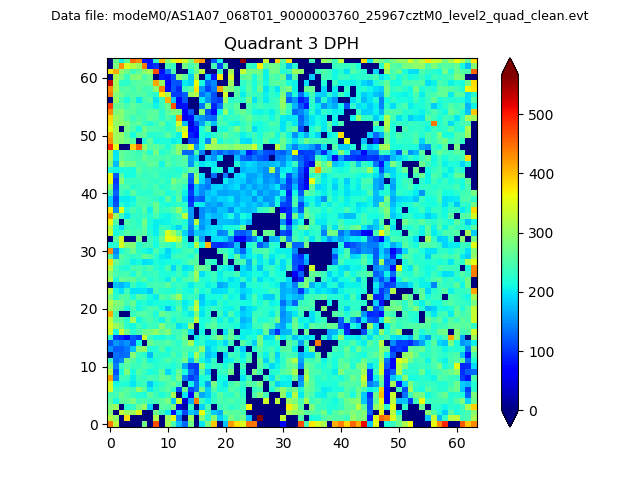 |
 |
Quadrant C |
| Plot type | Count rate plots | Images |
|---|---|---|
| Comparison with Poisson distribution Blue bars denote a histogram of data divided into 1 sec bins. Red curve is a Poisson curve with rate = median count rate of data. |
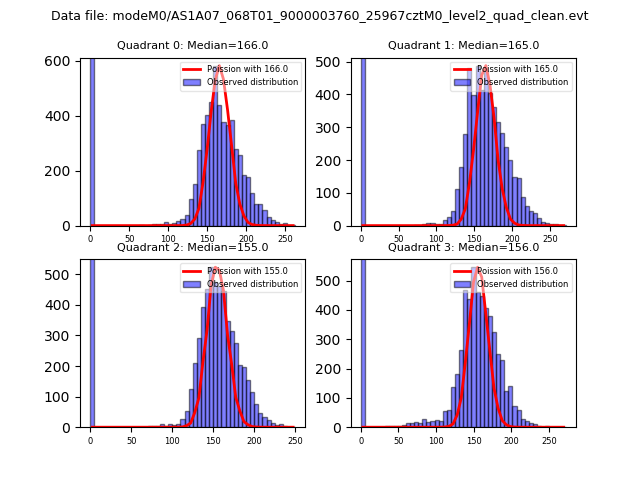 |
 |
| Quadrant-wise count rates Data is divided into 100 sec bins |
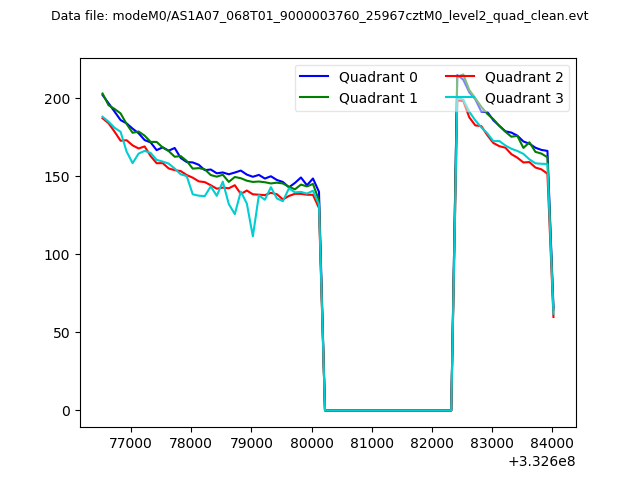 |
|
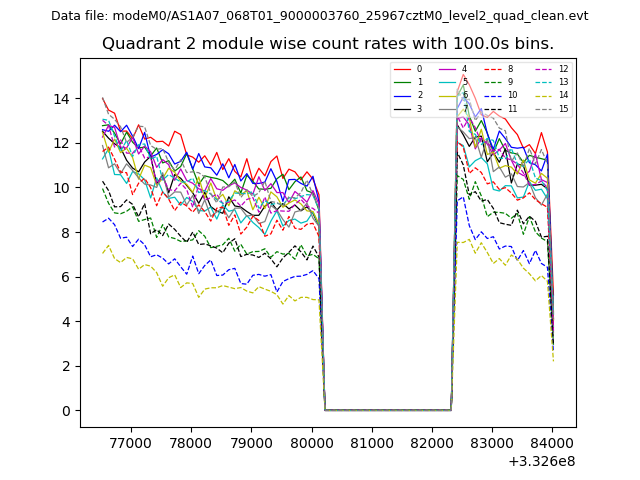
| Module-wise count rates for Quadrant A Data is divided into 100 sec bins |
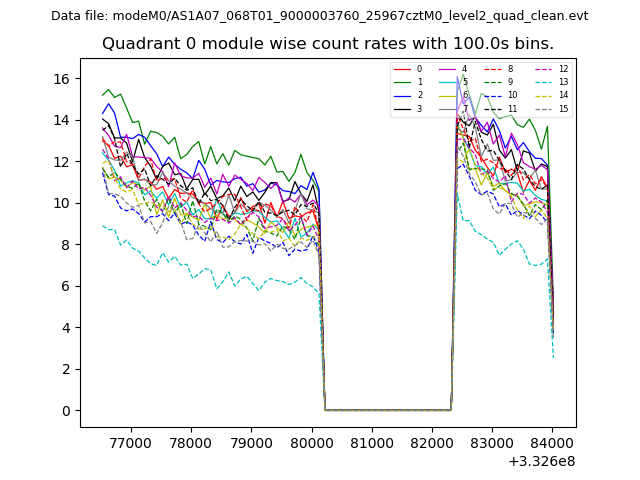 |
 |
| Module-wise count rates for Quadrant B Data is divided into 100 sec bins |
 |
 |
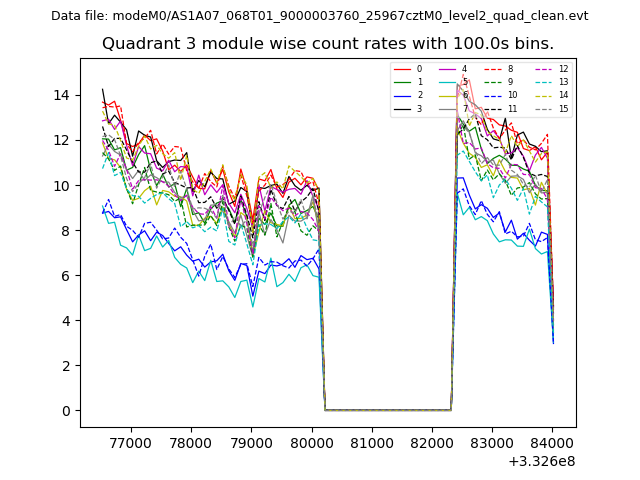
| Module-wise count rates for Quadrant C Data is divided into 100 sec bins |
 |
 |
| Module-wise count rates for Quadrant D Data is divided into 100 sec bins |
 |
 |
| Parameter | Plot |
|---|---|
| CZT HV Monitor | 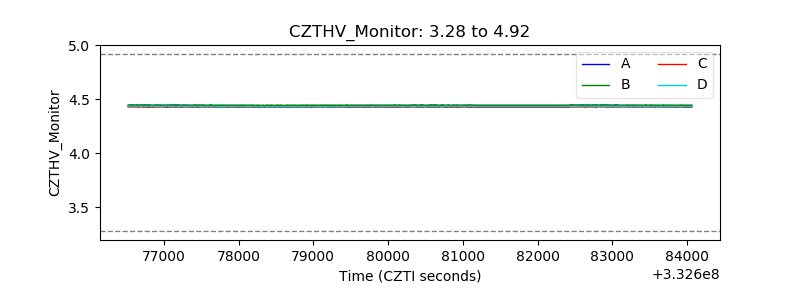 |
| D_VDD | 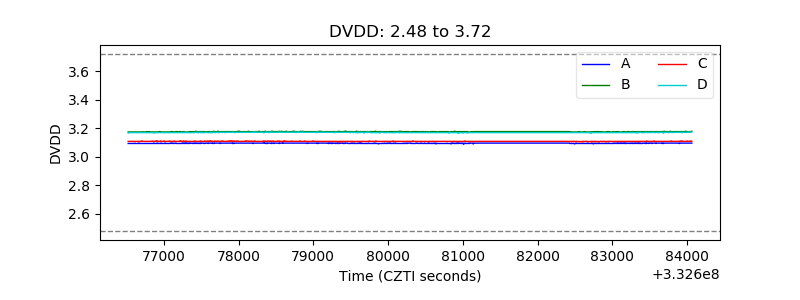 |
| Temperature 1 | 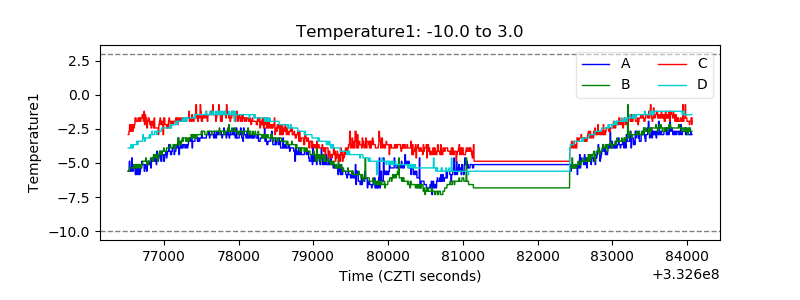 |
| Veto HV Monitor | 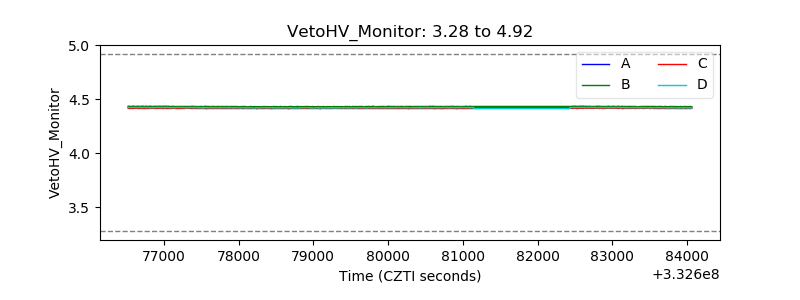 |
| Veto LLD | 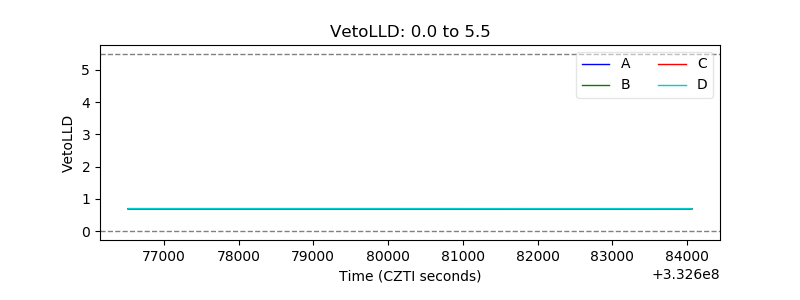 |
| Alpha Counter | 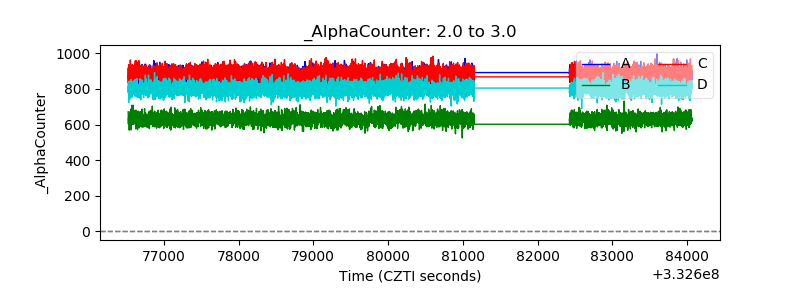 |
| _CPM_Rate | 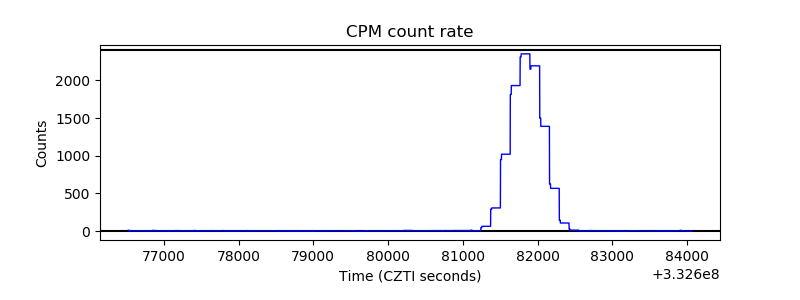 |
| CZT Counter | 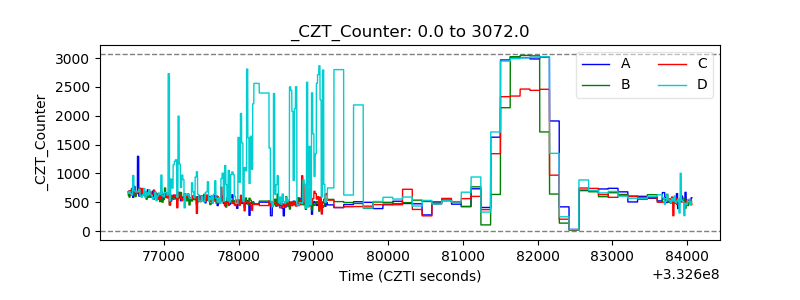 |
| +2.5 Volts monitor |  |
| +5 Volts monitor |  |
| _ROLL_ROT | 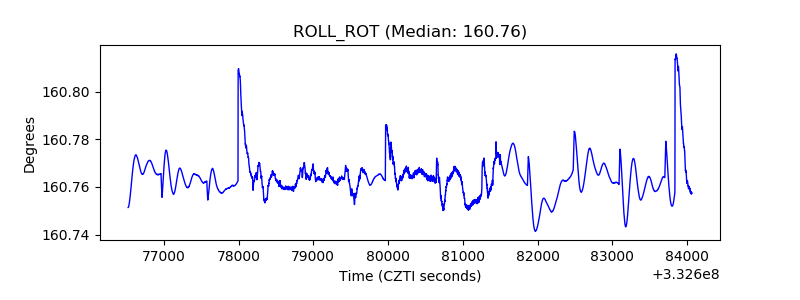 |
| _Roll_DEC | 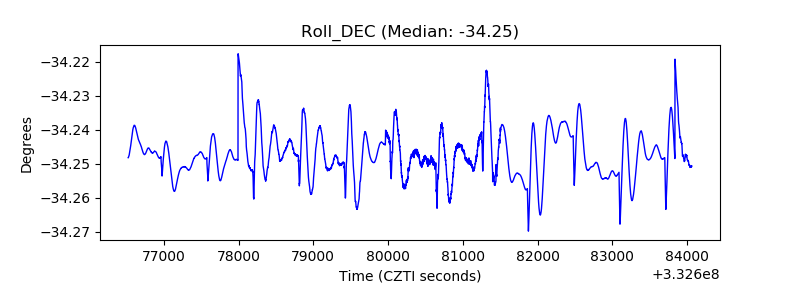 |
| _Roll_RA | 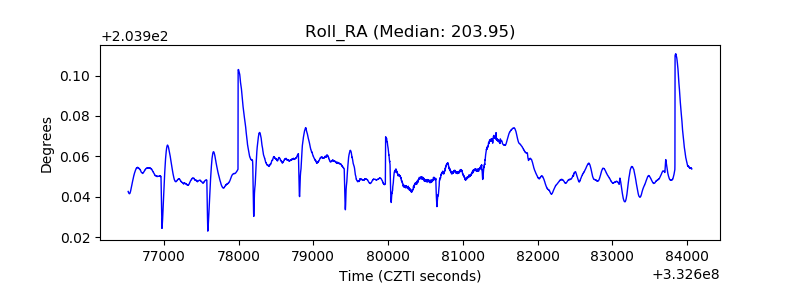 |
| Veto Counter | 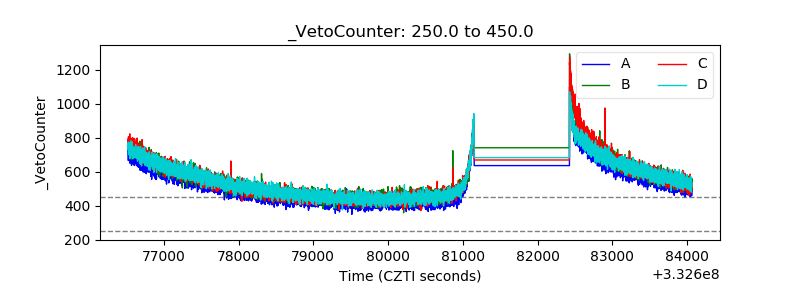 |