| Param | Original file | Final file |
|---|---|---|
| Filename | modeM0/AS1A07_068T01_9000003760_25968cztM0_level2.evt | modeM0/AS1A07_068T01_9000003760_25968cztM0_level2_quad_clean.evt |
| Size (bytes) | 511,997,760 | 112,893,120 |
| Size | 488.3 MB | 107.7 MB |
| Events in quadrant A | 4,162,163 | 771,355 |
| Events in quadrant B | 3,275,867 | 767,373 |
| Events in quadrant C | 3,365,656 | 719,703 |
| Events in quadrant D | 4,288,936 | 735,198 |
| Mode M0 | |||
|---|---|---|---|
| Quadrant | BADHDUFLAG | Total packets | Discarded packets |
| A | 0 | 16253 | 0 |
| B | 0 | 13499 | 0 |
| C | 0 | 13816 | 0 |
| D | 0 | 16776 | 0 |
| Mode M9 | |||
|---|---|---|---|
| Quadrant | BADHDUFLAG | Total packets | Discarded packets |
| A | 0 | 12 | 0 |
| B | 0 | 12 | 0 |
| C | 0 | 12 | 0 |
| D | 0 | 12 | 0 |
| Quadrant | Total seconds | Saturated seconds | Saturation percentage |
|---|---|---|---|
| A | 6095 | 201 | 3.297785% |
| B | 6096 | 135 | 2.214567% |
| C | 6096 | 181 | 2.969160% |
| D | 6096 | 298 | 4.888451% |
Noise dominated data is calculated using 1-second bins in cleaned event files. If a bin has >2000 counts, and if more than 50% of those come from <1% of pixels, then it is considered to be noise-dominated and hence unusable.
| Quadrant | # 1 sec bins | Bins with >0 counts | Bins with >2000 counts | High rate bins dominated by noise | Noise dominated (total time) | Noise dominated (detector-on time) | Marked lightcurve |
|---|---|---|---|---|---|---|---|
| A | 7365 | 6096 | 0 | 0 | 0.00% | 0.00% | 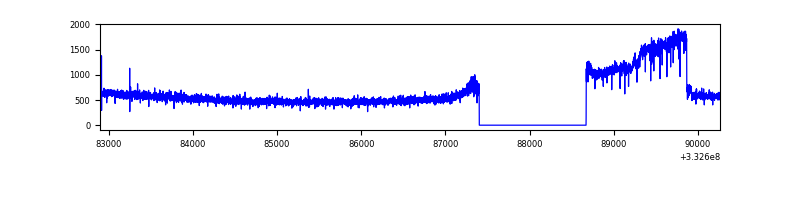 |
| B | 7366 | 6097 | 0 | 0 | 0.00% | 0.00% | 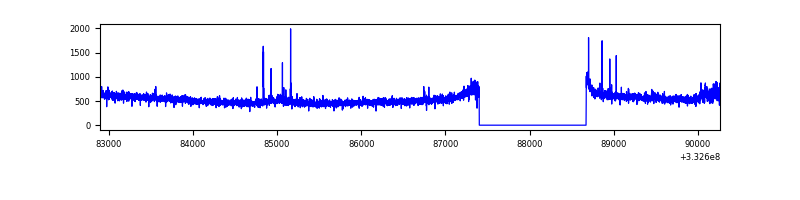 |
| C | 7366 | 6096 | 8 | 8 | 0.11% | 0.13% | 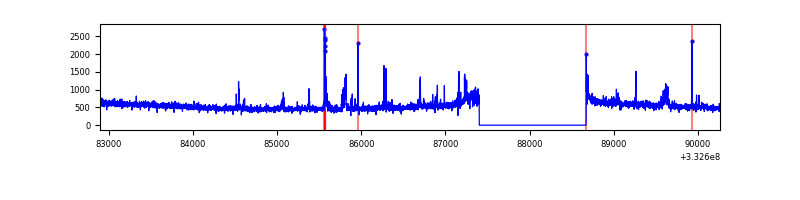 |
| D | 7366 | 6096 | 121 | 121 | 1.64% | 1.98% | 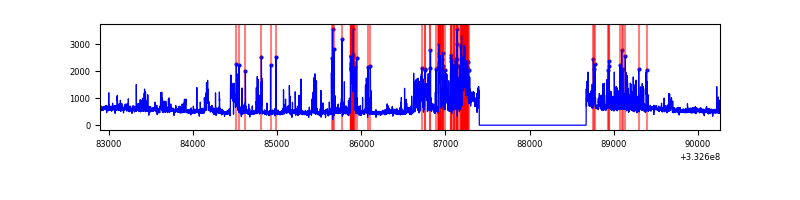 |
Top three noisy pixels from each quadrant. If the there are fewer than three noisy pixels in the level2.evt file, extra rows are filled as -1
| Pixel properties | Quadrant properties | ||||||
|---|---|---|---|---|---|---|---|
| Quadrant | DetID | PixID | Counts | Sigma | Mean | Median | Sigma |
| A | 15 | 169 | 911523 | 5426.71 | 844 | 830 | 167.8 |
| A | 13 | 254 | 9202 | 49.89 | 844 | 830 | 167.8 |
| A | 0 | 226 | 7499 | 39.74 | 844 | 830 | 167.8 |
| B | 0 | 190 | 44074 | 281.48 | 818 | 800 | 153.7 |
| B | 12 | 111 | 17903 | 111.25 | 818 | 800 | 153.7 |
| B | 0 | 230 | 16379 | 101.33 | 818 | 800 | 153.7 |
| C | 3 | 233 | 187529 | 1042.34 | 780 | 784 | 179.2 |
| C | 14 | 238 | 128757 | 714.3 | 780 | 784 | 179.2 |
| C | 7 | 238 | 6463 | 31.7 | 780 | 784 | 179.2 |
| D | 1 | 52 | 1209187 | 6311.85 | 806 | 785 | 191.4 |
| D | 2 | 234 | 23523 | 118.77 | 806 | 785 | 191.4 |
| D | 2 | 120 | 14720 | 72.79 | 806 | 785 | 191.4 |
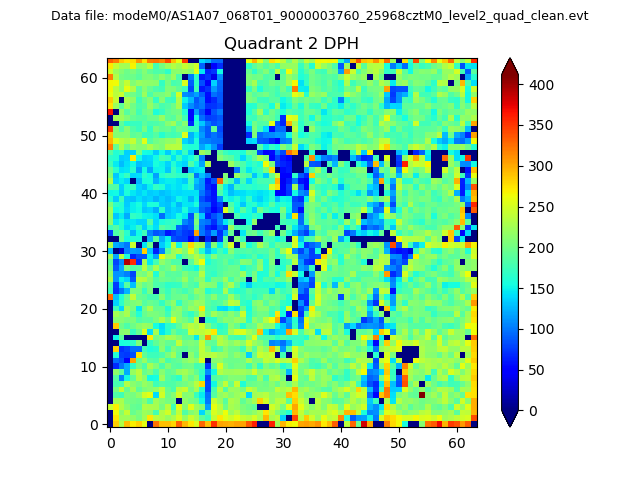
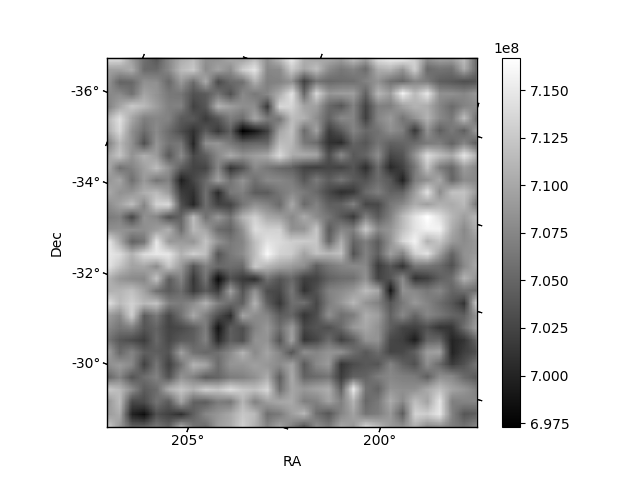
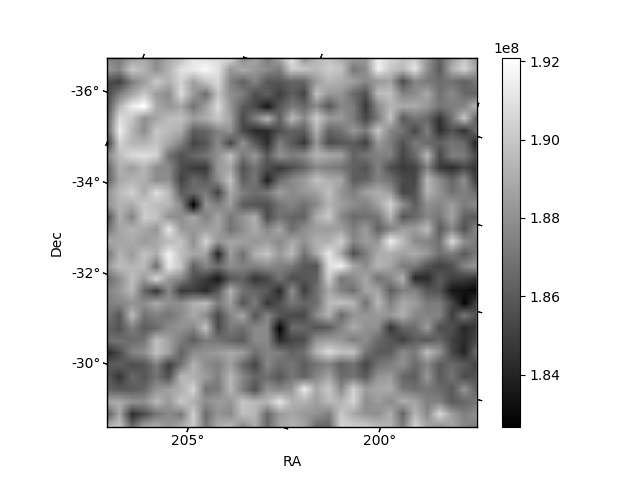
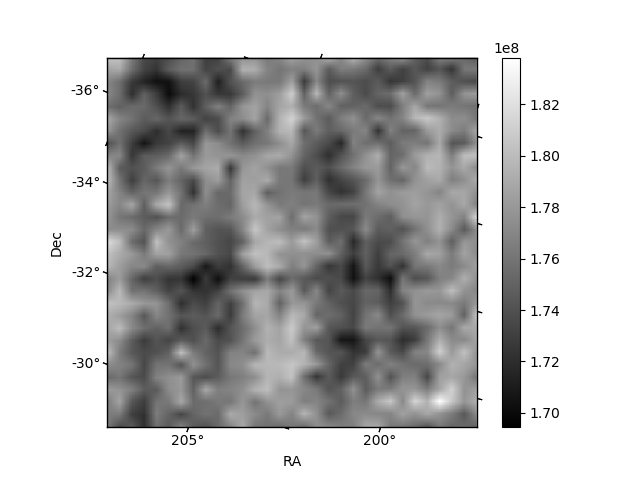
Histogram calculated using DETX and DETY for each event in the final _common_clean file
| Quadrant A | 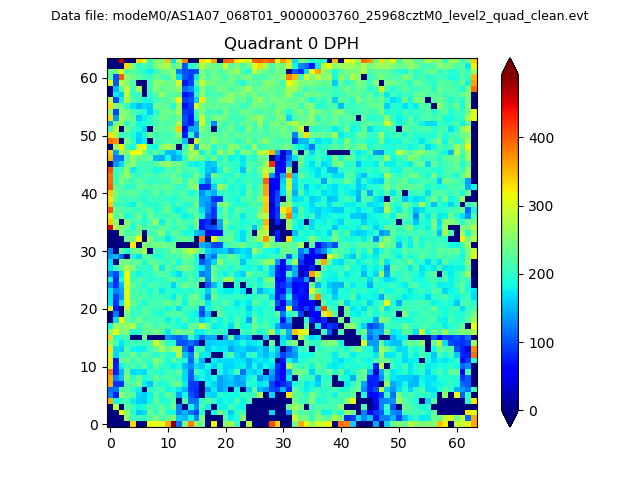 |
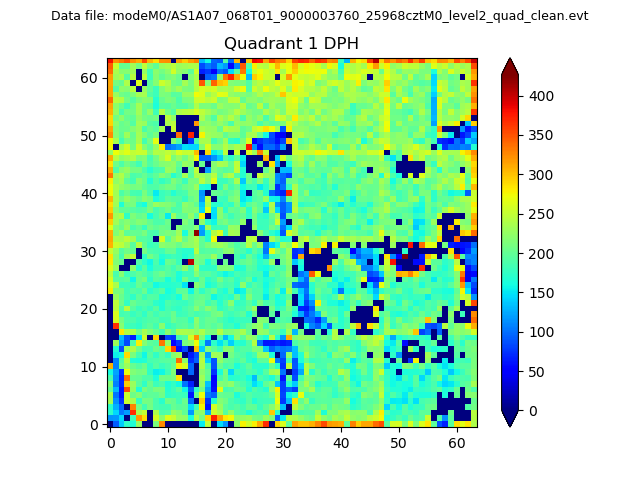 |
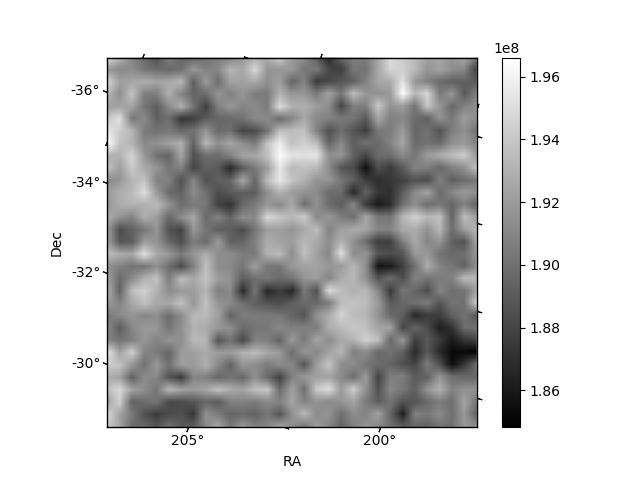
Quadrant B |
|---|---|---|---|
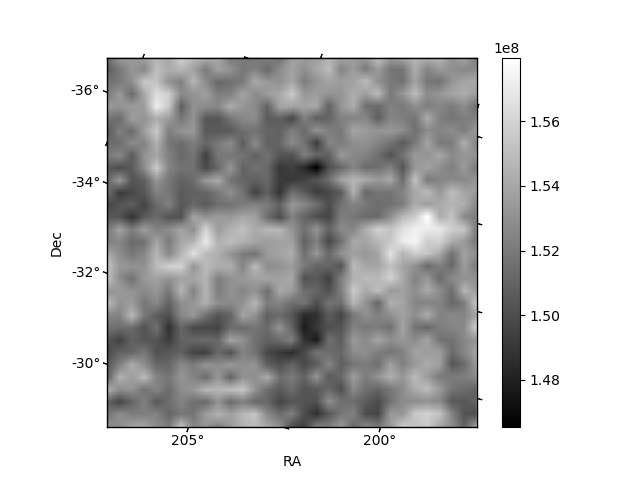
| Quadrant D | 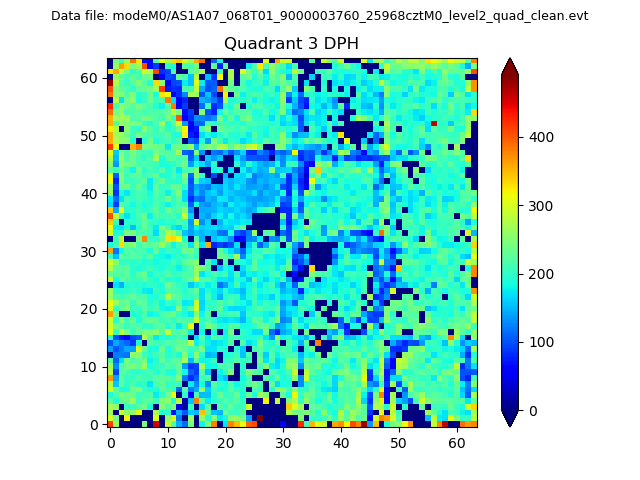 |
 |
Quadrant C |
| Plot type | Count rate plots | Images |
|---|---|---|
| Comparison with Poisson distribution Blue bars denote a histogram of data divided into 1 sec bins. Red curve is a Poisson curve with rate = median count rate of data. |
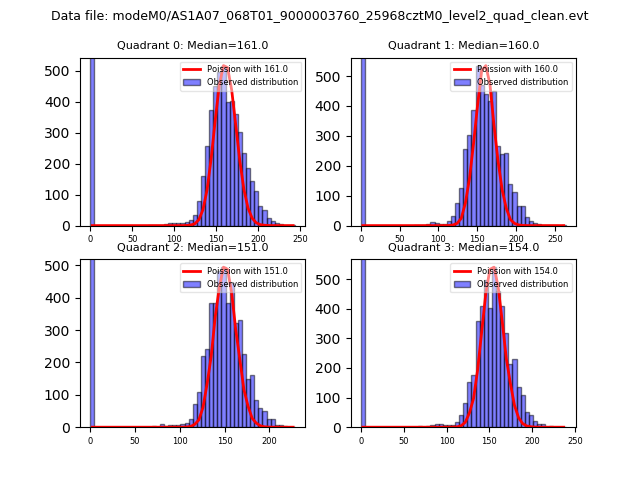 |
 |
| Quadrant-wise count rates Data is divided into 100 sec bins |
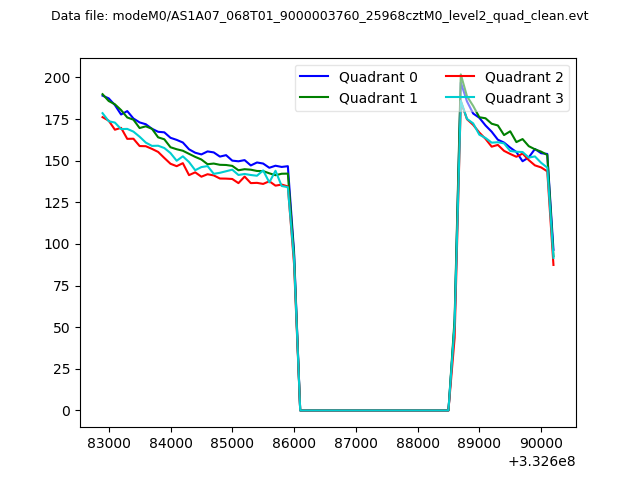 |
|
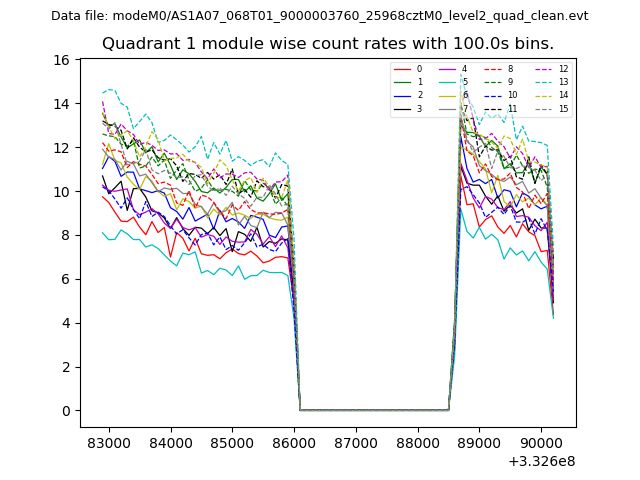
| Module-wise count rates for Quadrant A Data is divided into 100 sec bins |
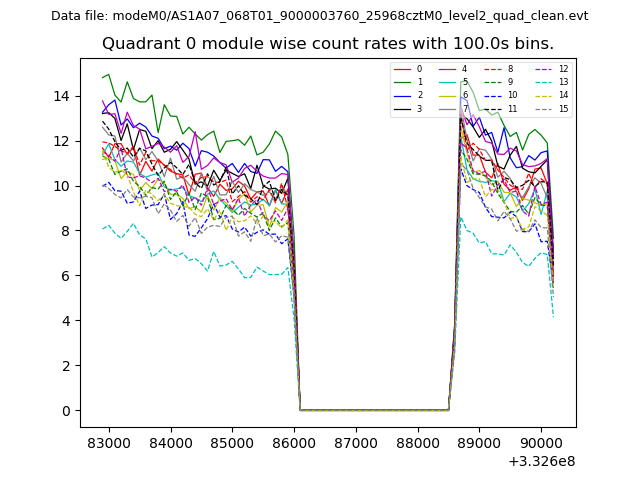 |
 |
| Module-wise count rates for Quadrant B Data is divided into 100 sec bins |
 |
 |
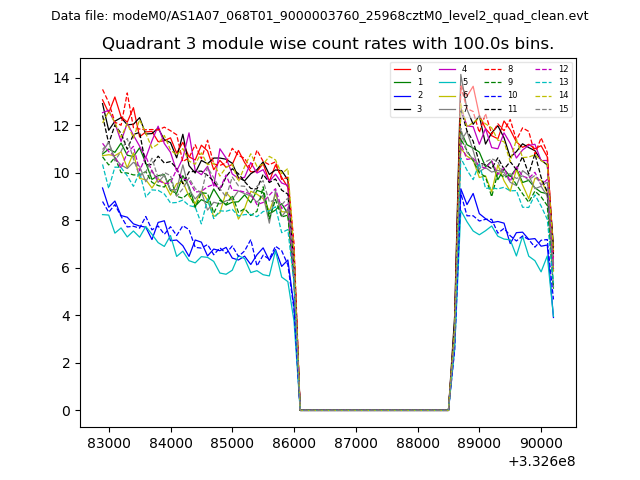
| Module-wise count rates for Quadrant C Data is divided into 100 sec bins |
 |
 |
| Module-wise count rates for Quadrant D Data is divided into 100 sec bins |
 |
 |
| Parameter | Plot |
|---|---|
| CZT HV Monitor |  |
| D_VDD | 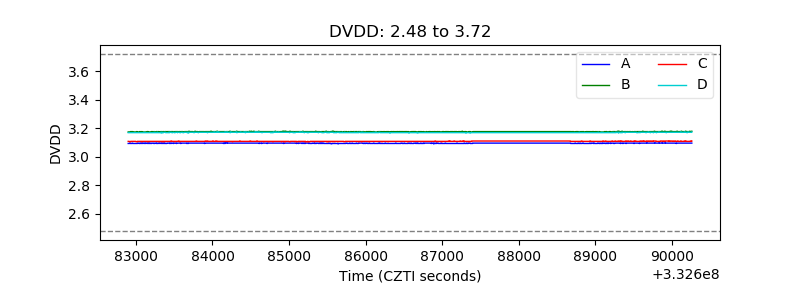 |
| Temperature 1 | 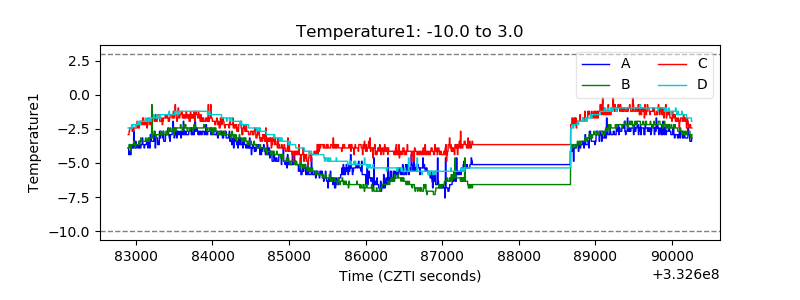 |
| Veto HV Monitor | 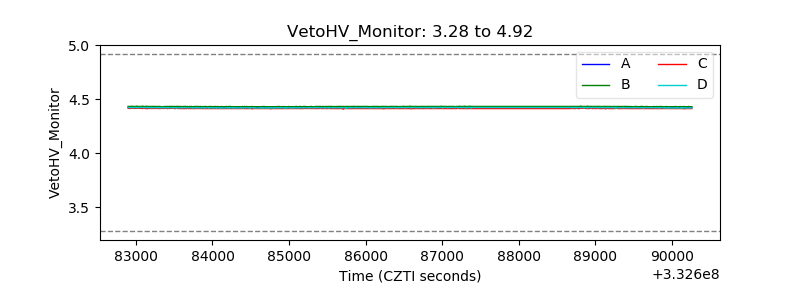 |
| Veto LLD | 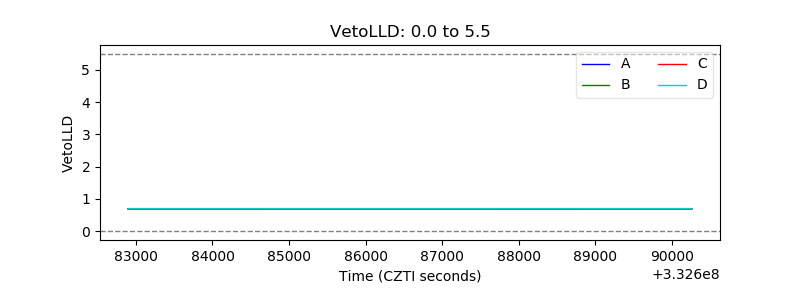 |
| Alpha Counter | 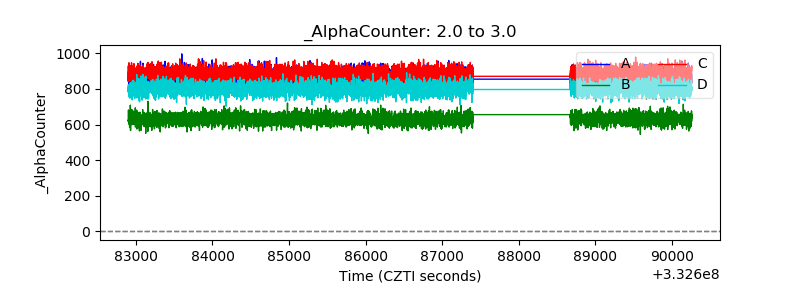 |
| _CPM_Rate | 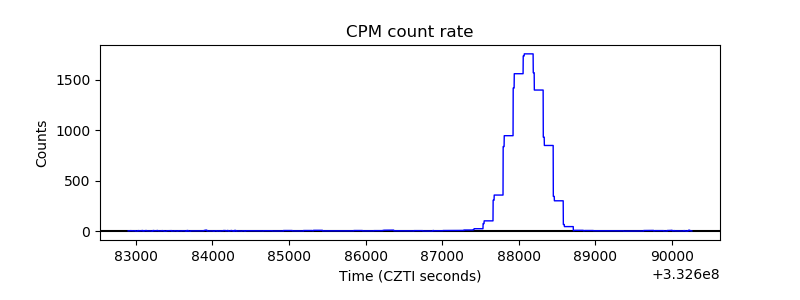 |
| CZT Counter | 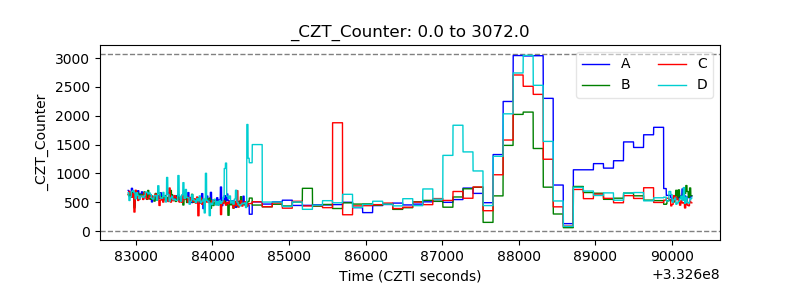 |
| +2.5 Volts monitor |  |
| +5 Volts monitor |  |
| _ROLL_ROT | 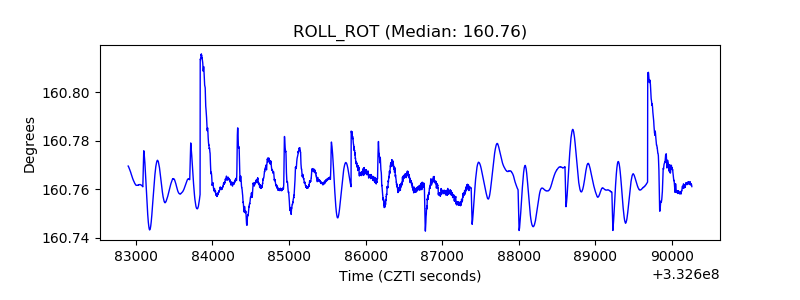 |
| _Roll_DEC | 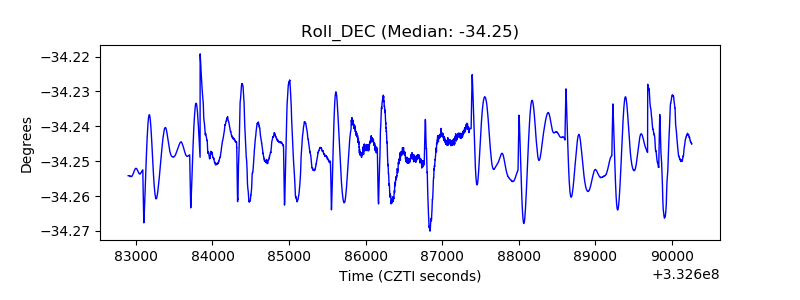 |
| _Roll_RA | 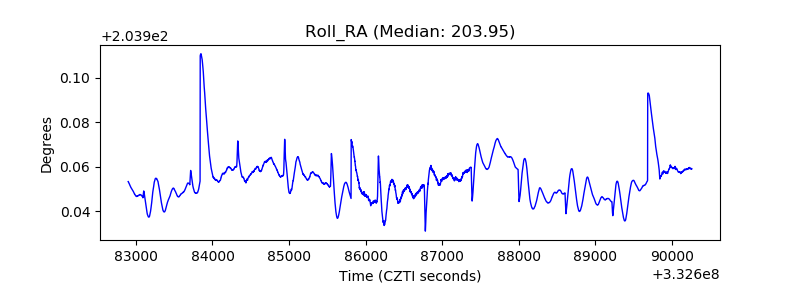 |
| Veto Counter | 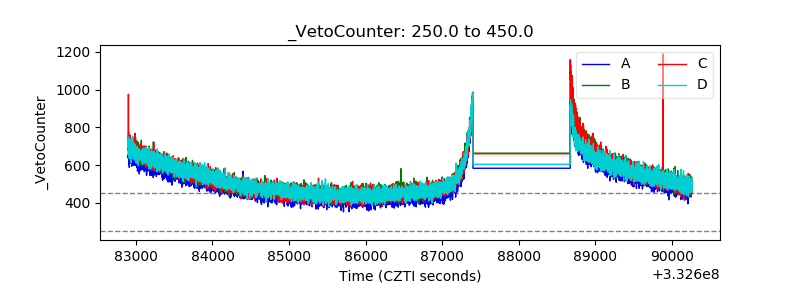 |