| Param | Original file | Final file |
|---|---|---|
| Filename | modeM0/AS1A07_068T01_9000003760_25969cztM0_level2.evt | modeM0/AS1A07_068T01_9000003760_25969cztM0_level2_quad_clean.evt |
| Size (bytes) | 484,058,880 | 93,358,080 |
| Size | 461.6 MB | 89.0 MB |
| Events in quadrant A | 3,713,247 | 622,995 |
| Events in quadrant B | 3,067,425 | 622,202 |
| Events in quadrant C | 3,376,659 | 581,918 |
| Events in quadrant D | 4,099,852 | 585,638 |
| Mode M0 | |||
|---|---|---|---|
| Quadrant | BADHDUFLAG | Total packets | Discarded packets |
| A | 0 | 14408 | 0 |
| B | 0 | 12797 | 0 |
| C | 0 | 13791 | 0 |
| D | 0 | 15950 | 0 |
| Mode M9 | |||
|---|---|---|---|
| Quadrant | BADHDUFLAG | Total packets | Discarded packets |
| A | 0 | 12 | 0 |
| B | 0 | 12 | 0 |
| C | 0 | 12 | 0 |
| D | 0 | 12 | 0 |
| Quadrant | Total seconds | Saturated seconds | Saturation percentage |
|---|---|---|---|
| A | 5929 | 126 | 2.125148% |
| B | 5929 | 76 | 1.281835% |
| C | 5930 | 139 | 2.344013% |
| D | 5930 | 181 | 3.052277% |
Noise dominated data is calculated using 1-second bins in cleaned event files. If a bin has >2000 counts, and if more than 50% of those come from <1% of pixels, then it is considered to be noise-dominated and hence unusable.
| Quadrant | # 1 sec bins | Bins with >0 counts | Bins with >2000 counts | High rate bins dominated by noise | Noise dominated (total time) | Noise dominated (detector-on time) | Marked lightcurve |
|---|---|---|---|---|---|---|---|
| A | 7164 | 5930 | 0 | 0 | 0.00% | 0.00% | 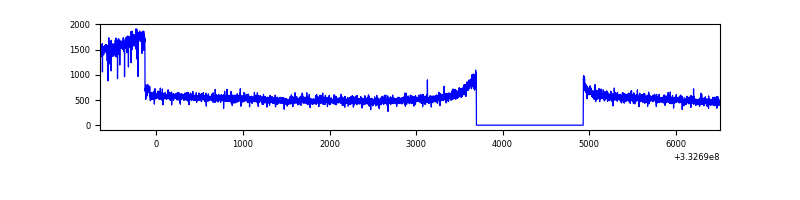 |
| B | 7164 | 5930 | 0 | 0 | 0.00% | 0.00% | 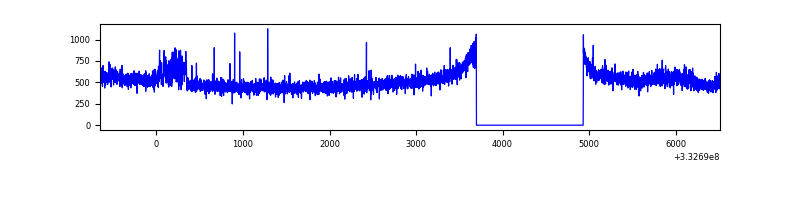 |
| C | 7165 | 5931 | 11 | 11 | 0.15% | 0.19% | 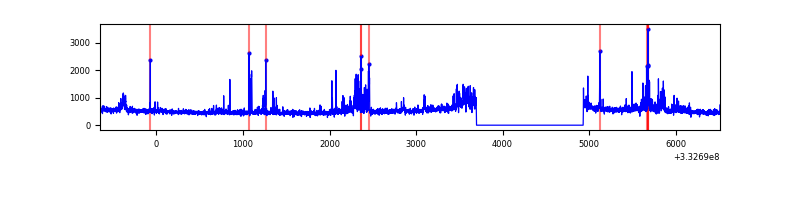 |
| D | 7165 | 5931 | 165 | 165 | 2.30% | 2.78% | 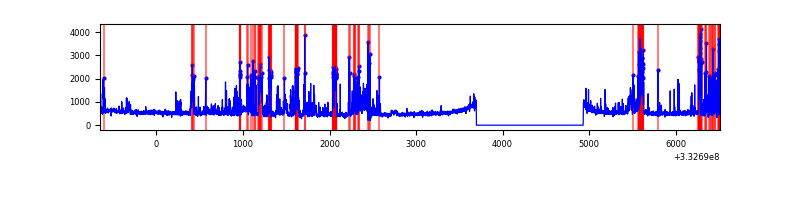 |
Top three noisy pixels from each quadrant. If the there are fewer than three noisy pixels in the level2.evt file, extra rows are filled as -1
| Pixel properties | Quadrant properties | ||||||
|---|---|---|---|---|---|---|---|
| Quadrant | DetID | PixID | Counts | Sigma | Mean | Median | Sigma |
| A | 15 | 169 | 711024 | 4544.03 | 779 | 766 | 156.3 |
| A | 13 | 254 | 9010 | 52.74 | 779 | 766 | 156.3 |
| A | 0 | 226 | 6942 | 39.51 | 779 | 766 | 156.3 |
| B | 0 | 190 | 84811 | 585.16 | 759 | 741 | 143.7 |
| B | 12 | 111 | 17185 | 114.45 | 759 | 741 | 143.7 |
| B | 11 | 111 | 15274 | 101.15 | 759 | 741 | 143.7 |
| C | 3 | 233 | 426834 | 2531.61 | 720 | 724 | 168.3 |
| C | 14 | 238 | 118329 | 698.72 | 720 | 724 | 168.3 |
| C | 7 | 238 | 25854 | 149.3 | 720 | 724 | 168.3 |
| D | 1 | 52 | 1274765 | 7225.48 | 741 | 723 | 176.3 |
| D | 2 | 234 | 22516 | 123.59 | 741 | 723 | 176.3 |
| D | 2 | 120 | 10531 | 55.62 | 741 | 723 | 176.3 |
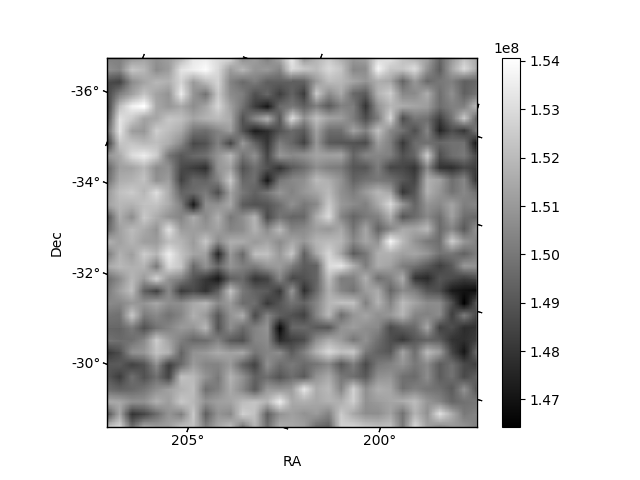
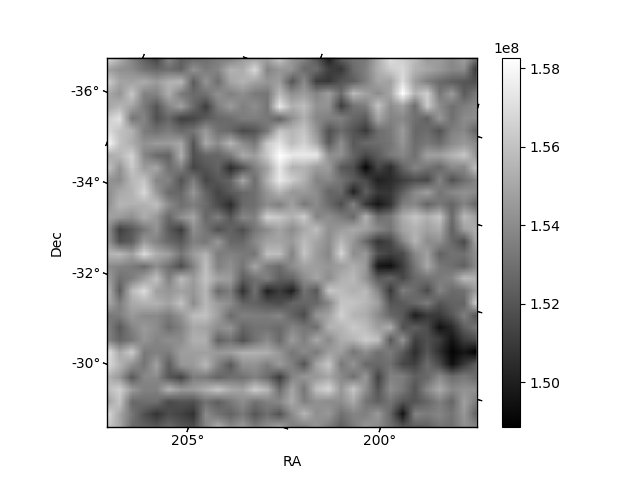
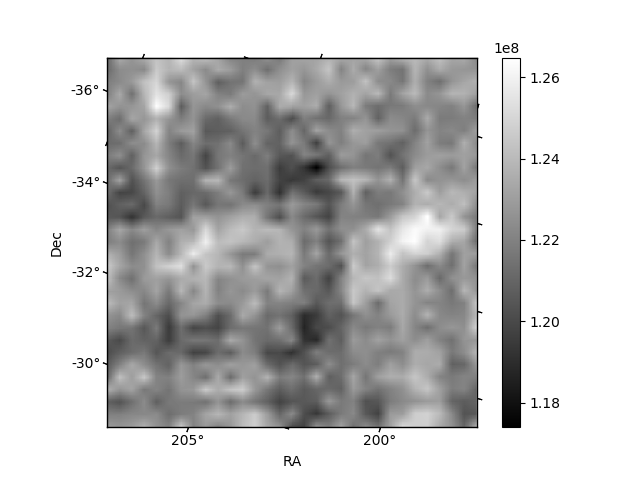
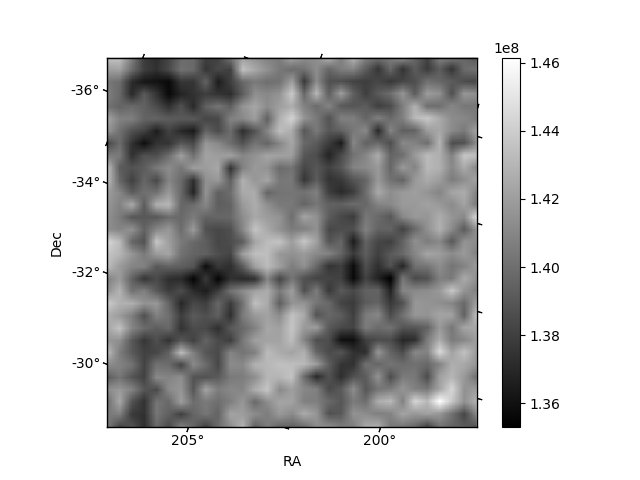
Histogram calculated using DETX and DETY for each event in the final _common_clean file
| Quadrant A |  |
 |
Quadrant B |
|---|---|---|---|
| Quadrant D |  |
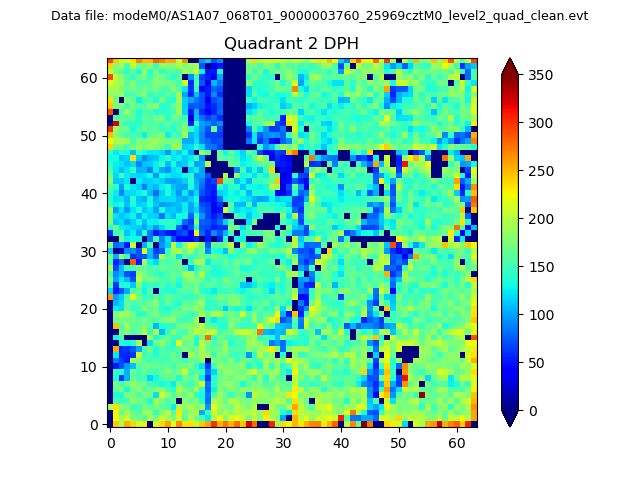 |
Quadrant C |
| Plot type | Count rate plots | Images |
|---|---|---|
| Comparison with Poisson distribution Blue bars denote a histogram of data divided into 1 sec bins. Red curve is a Poisson curve with rate = median count rate of data. |
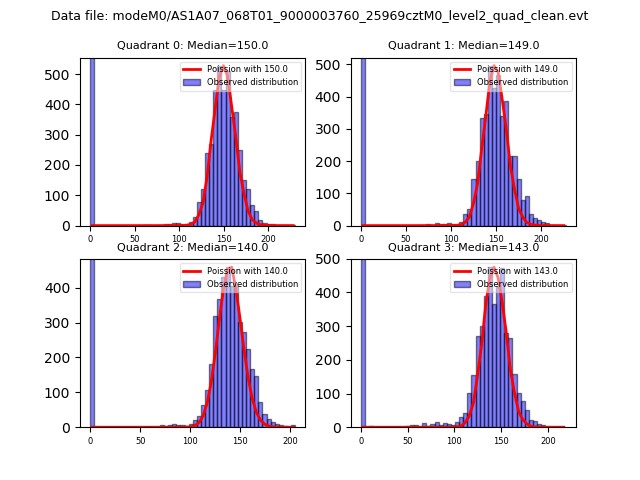 |
 |
| Quadrant-wise count rates Data is divided into 100 sec bins |
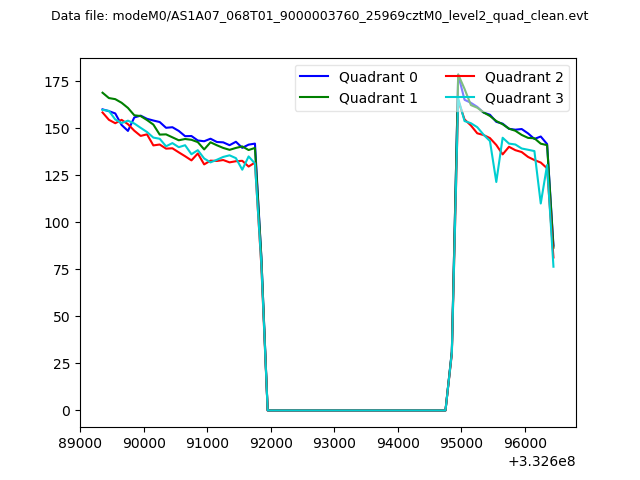 |
|
| Module-wise count rates for Quadrant A Data is divided into 100 sec bins |
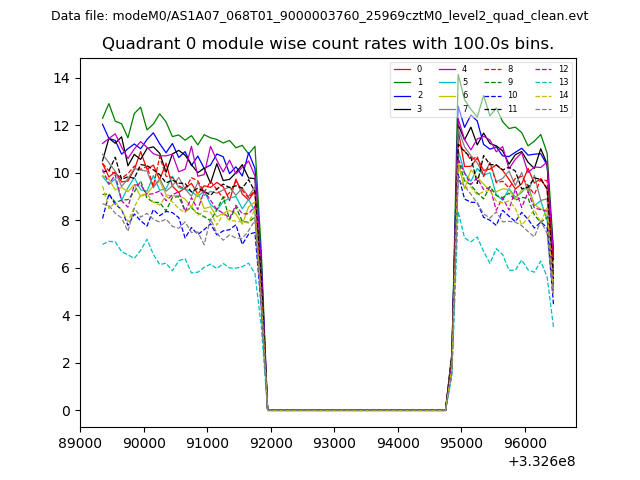 |
 |
| Module-wise count rates for Quadrant B Data is divided into 100 sec bins |
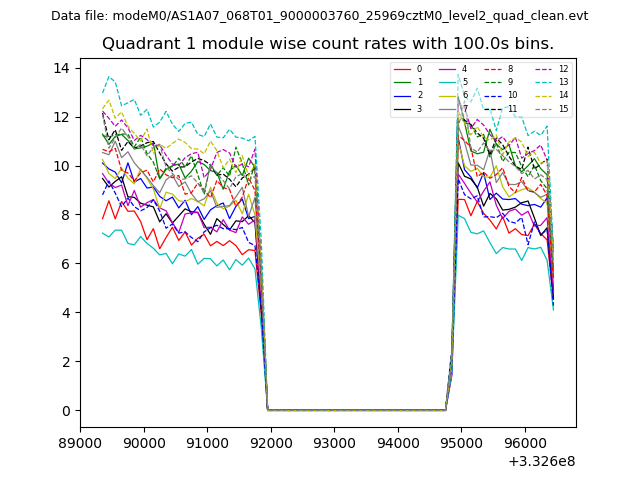 |
 |
| Module-wise count rates for Quadrant C Data is divided into 100 sec bins |
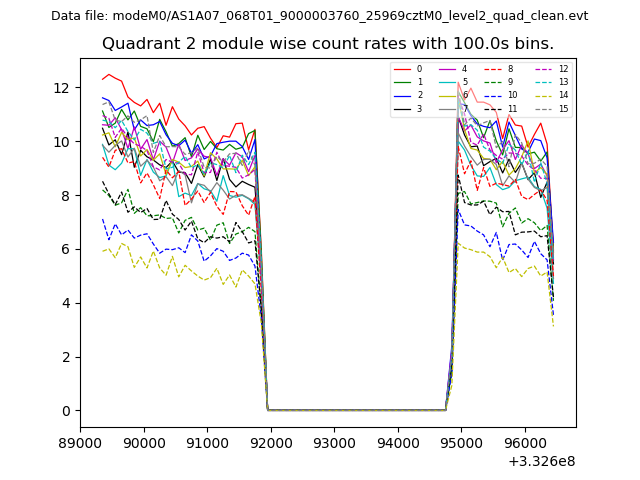 |
 |
| Module-wise count rates for Quadrant D Data is divided into 100 sec bins |
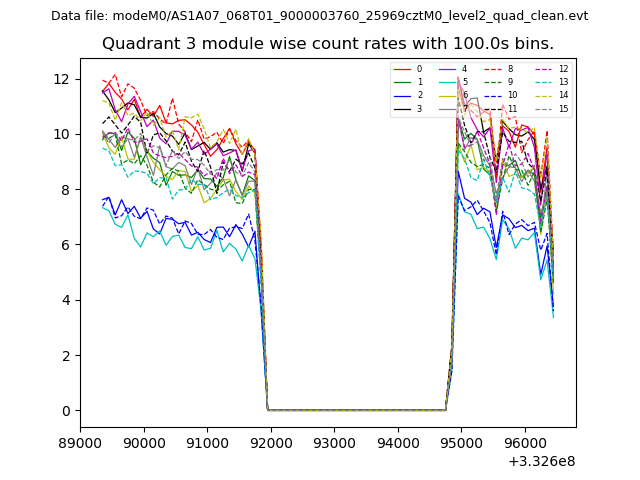 |
 |
| Parameter | Plot |
|---|---|
| CZT HV Monitor | 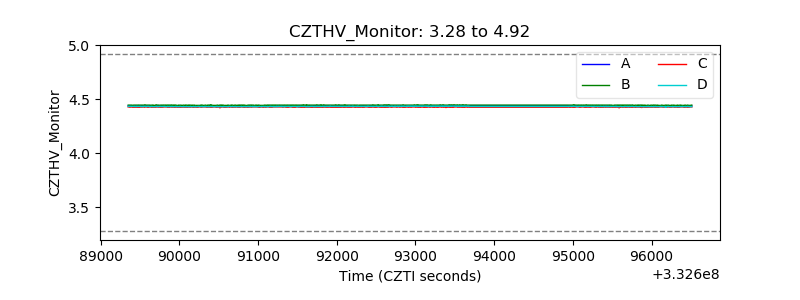 |
| D_VDD | 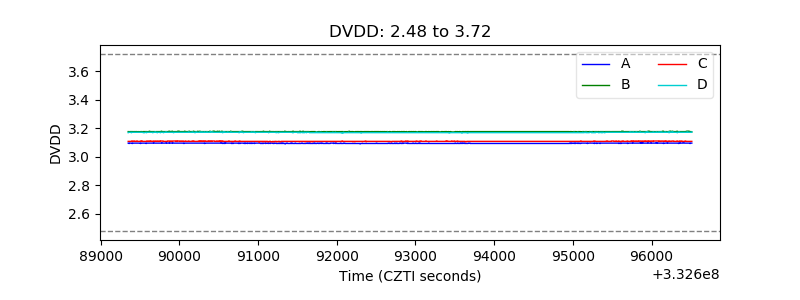 |
| Temperature 1 | 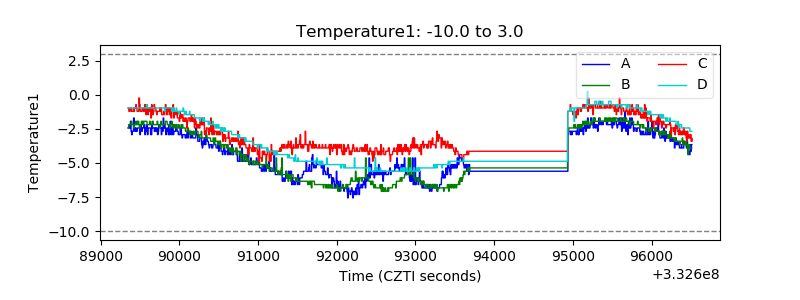 |
| Veto HV Monitor | 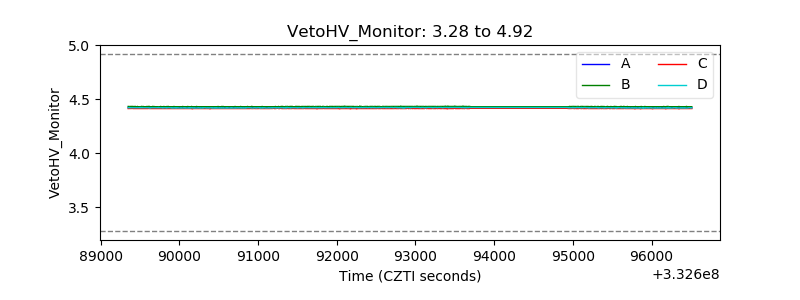 |
| Veto LLD | 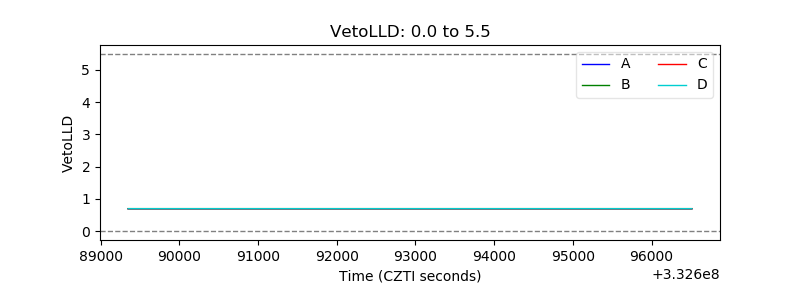 |
| Alpha Counter | 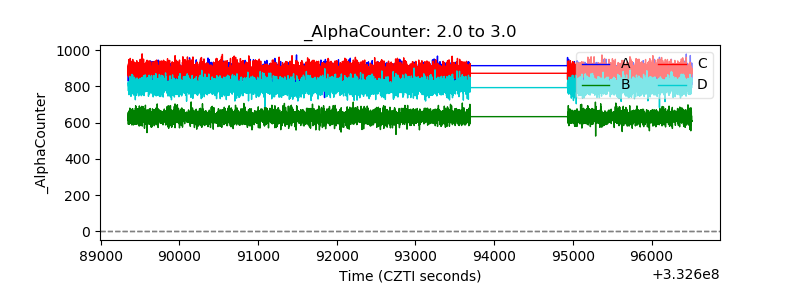 |
| _CPM_Rate | 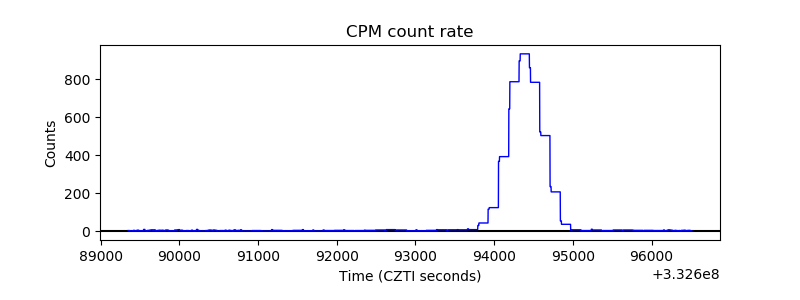 |
| CZT Counter | 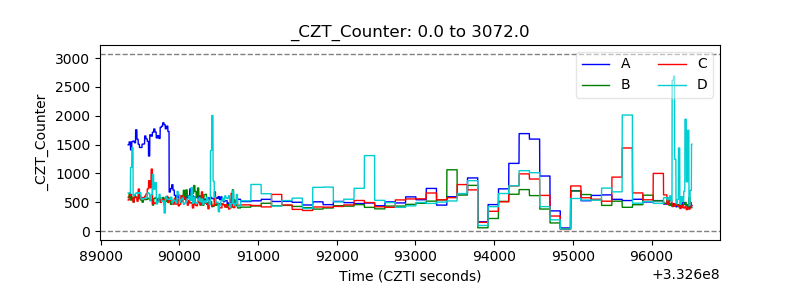 |
| +2.5 Volts monitor |  |
| +5 Volts monitor | 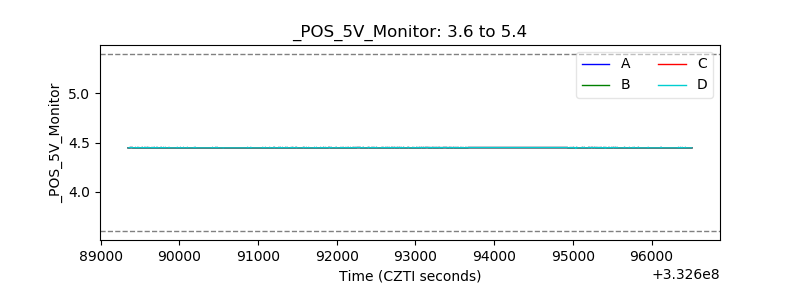 |
| _ROLL_ROT | 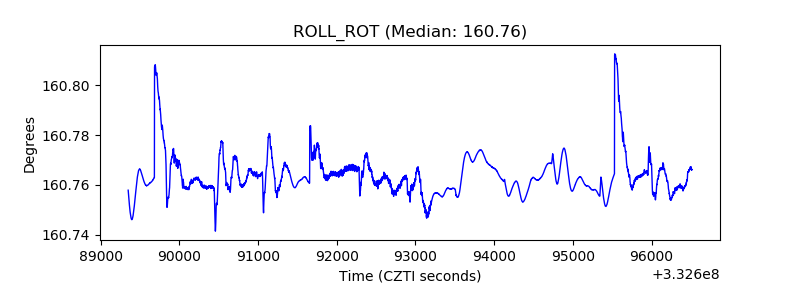 |
| _Roll_DEC | 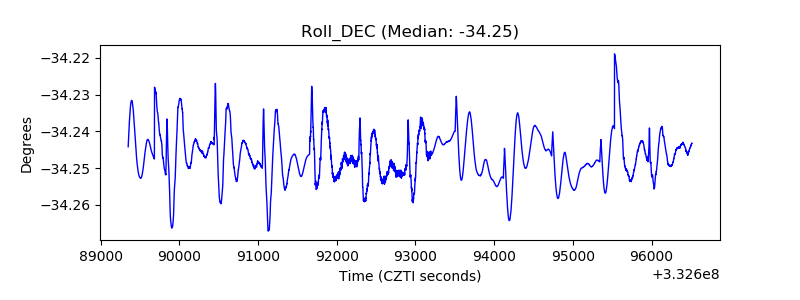 |
| _Roll_RA | 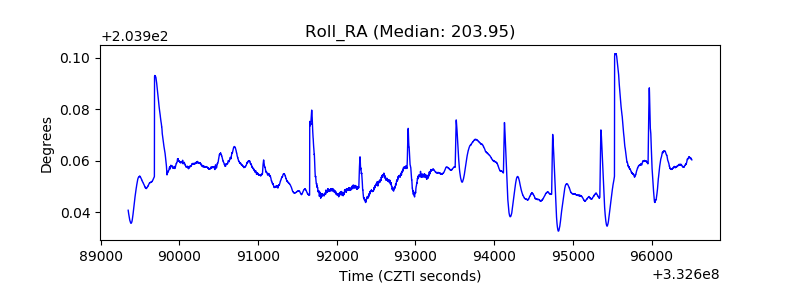 |
| Veto Counter | 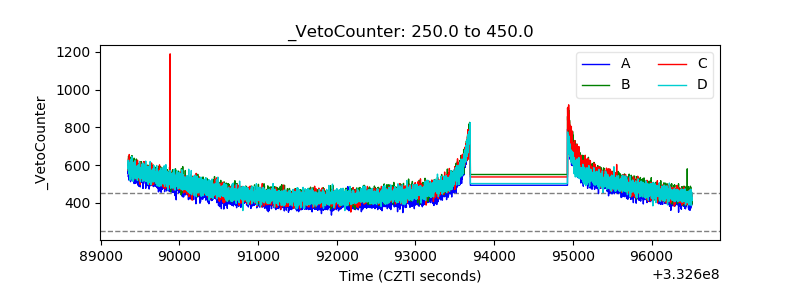 |