| Param | Original file | Final file |
|---|---|---|
| Filename | modeM0/AS1A07_068T01_9000003760_25970cztM0_level2.evt | modeM0/AS1A07_068T01_9000003760_25970cztM0_level2_quad_clean.evt |
| Size (bytes) | 519,615,360 | 95,575,680 |
| Size | 495.5 MB | 91.1 MB |
| Events in quadrant A | 3,203,476 | 639,411 |
| Events in quadrant B | 3,247,222 | 633,020 |
| Events in quadrant C | 3,773,285 | 590,165 |
| Events in quadrant D | 5,071,245 | 577,911 |
| Mode M0 | |||
|---|---|---|---|
| Quadrant | BADHDUFLAG | Total packets | Discarded packets |
| A | 0 | 13561 | 0 |
| B | 0 | 13669 | 0 |
| C | 0 | 15435 | 0 |
| D | 0 | 19302 | 0 |
| Mode M9 | |||
|---|---|---|---|
| Quadrant | BADHDUFLAG | Total packets | Discarded packets |
| A | 0 | 10 | 0 |
| B | 0 | 10 | 0 |
| C | 0 | 10 | 0 |
| D | 0 | 10 | 0 |
| Quadrant | Total seconds | Saturated seconds | Saturation percentage |
|---|---|---|---|
| A | 6507 | 48 | 0.737667% |
| B | 6505 | 61 | 0.937740% |
| C | 6508 | 179 | 2.750461% |
| D | 6507 | 457 | 7.023206% |
Noise dominated data is calculated using 1-second bins in cleaned event files. If a bin has >2000 counts, and if more than 50% of those come from <1% of pixels, then it is considered to be noise-dominated and hence unusable.
| Quadrant | # 1 sec bins | Bins with >0 counts | Bins with >2000 counts | High rate bins dominated by noise | Noise dominated (total time) | Noise dominated (detector-on time) | Marked lightcurve |
|---|---|---|---|---|---|---|---|
| A | 7497 | 6508 | 0 | 0 | 0.00% | 0.00% | 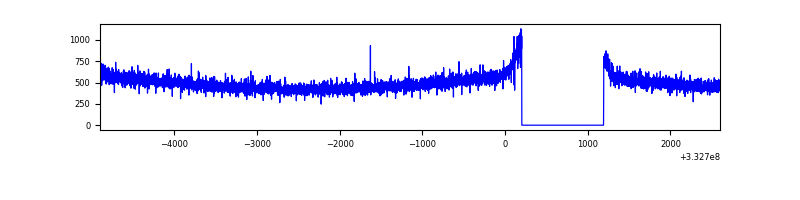 |
| B | 7497 | 6508 | 0 | 0 | 0.00% | 0.00% | 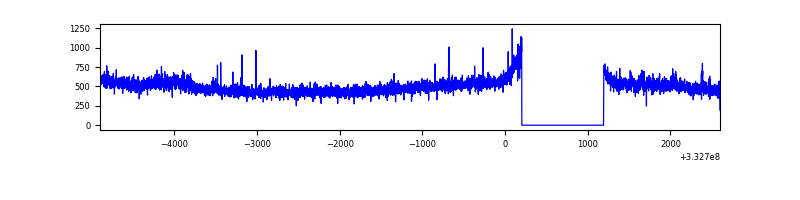 |
| C | 7498 | 6509 | 20 | 20 | 0.27% | 0.31% | 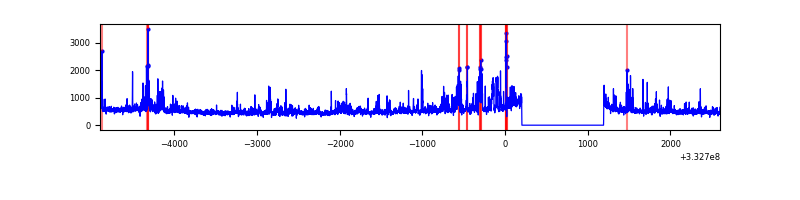 |
| D | 7497 | 6508 | 355 | 355 | 4.74% | 5.45% | 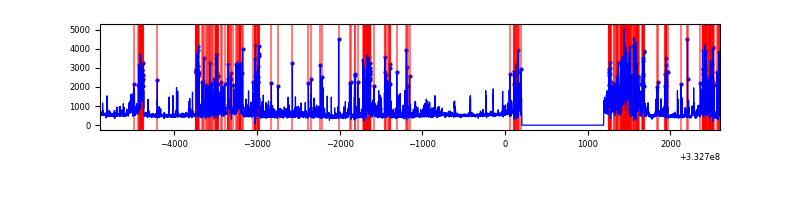 |
Top three noisy pixels from each quadrant. If the there are fewer than three noisy pixels in the level2.evt file, extra rows are filled as -1
| Pixel properties | Quadrant properties | ||||||
|---|---|---|---|---|---|---|---|
| Quadrant | DetID | PixID | Counts | Sigma | Mean | Median | Sigma |
| A | 13 | 254 | 10620 | 58.99 | 828 | 812 | 166.3 |
| A | 15 | 169 | 8115 | 43.93 | 828 | 812 | 166.3 |
| A | 3 | 137 | 7424 | 39.77 | 828 | 812 | 166.3 |
| B | 0 | 190 | 44583 | 281.2 | 812 | 793 | 155.7 |
| B | 12 | 111 | 18316 | 112.53 | 812 | 793 | 155.7 |
| B | 15 | 33 | 16970 | 103.88 | 812 | 793 | 155.7 |
| C | 3 | 233 | 650115 | 3606.26 | 767 | 773 | 180.1 |
| C | 14 | 238 | 125255 | 691.34 | 767 | 773 | 180.1 |
| C | 7 | 238 | 9261 | 47.14 | 767 | 773 | 180.1 |
| D | 1 | 52 | 2098071 | 11369.69 | 770 | 752 | 184.5 |
| D | 2 | 120 | 27082 | 142.74 | 770 | 752 | 184.5 |
| D | 2 | 234 | 26562 | 139.92 | 770 | 752 | 184.5 |
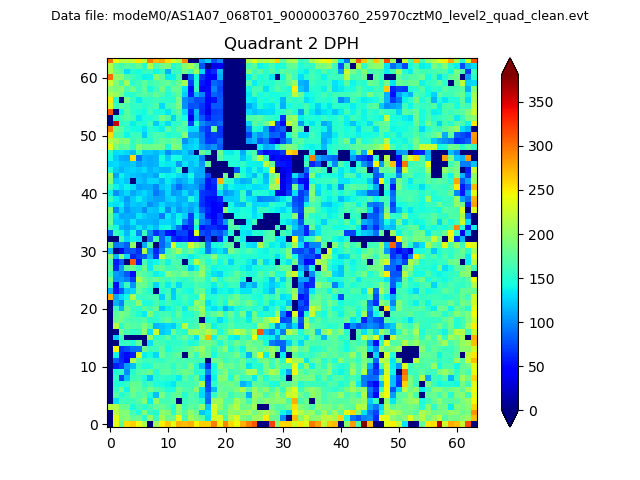
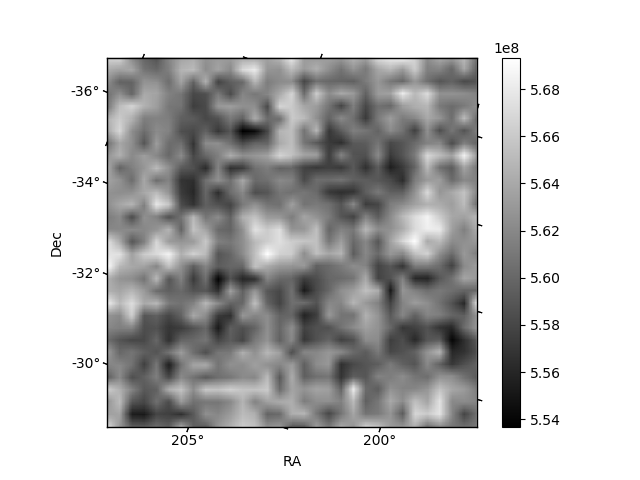
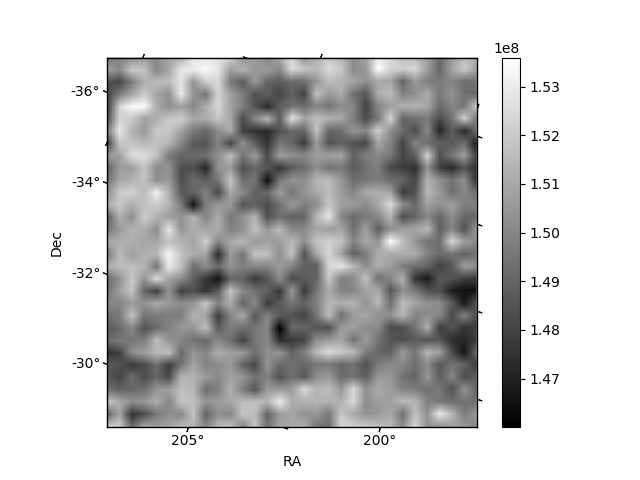
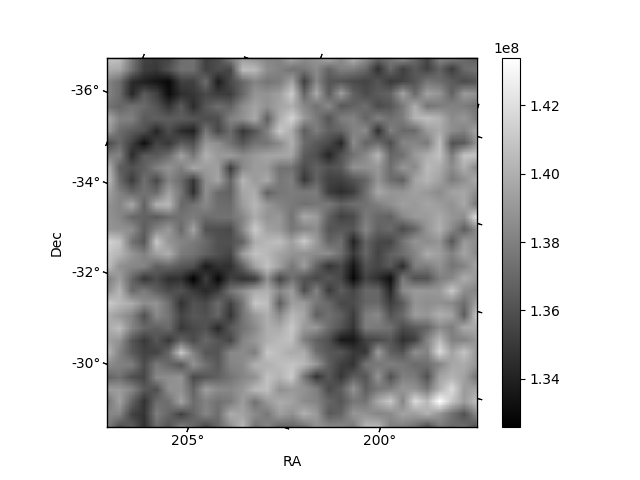
Histogram calculated using DETX and DETY for each event in the final _common_clean file
| Quadrant A | 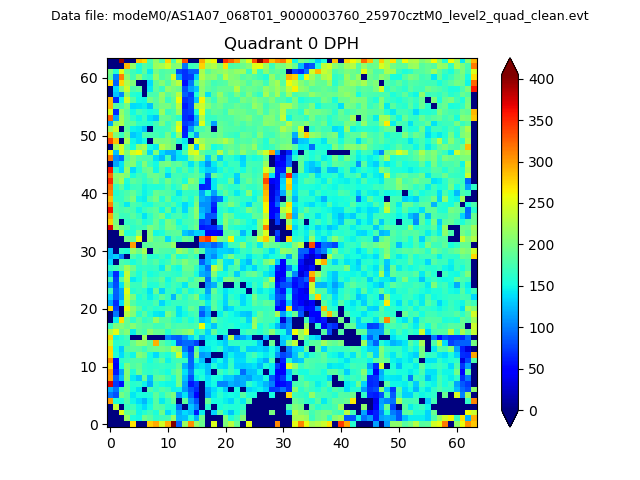 |
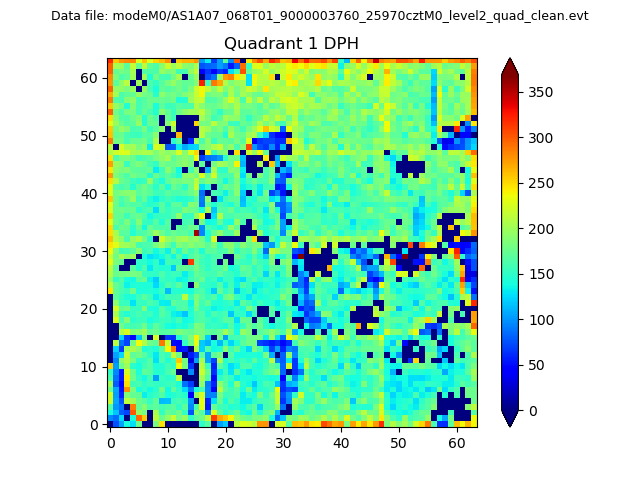 |
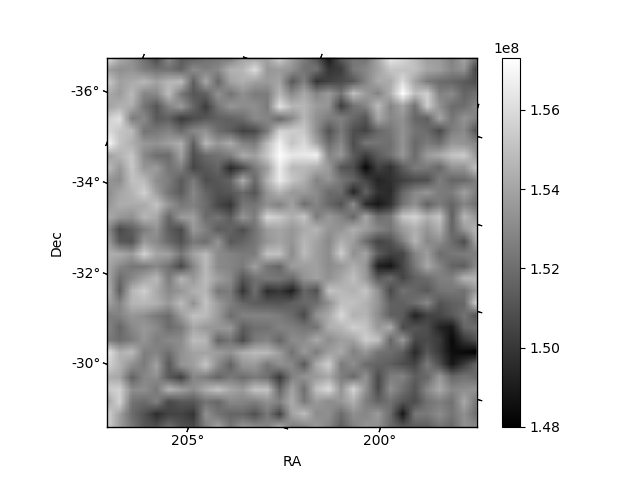
Quadrant B |
|---|---|---|---|
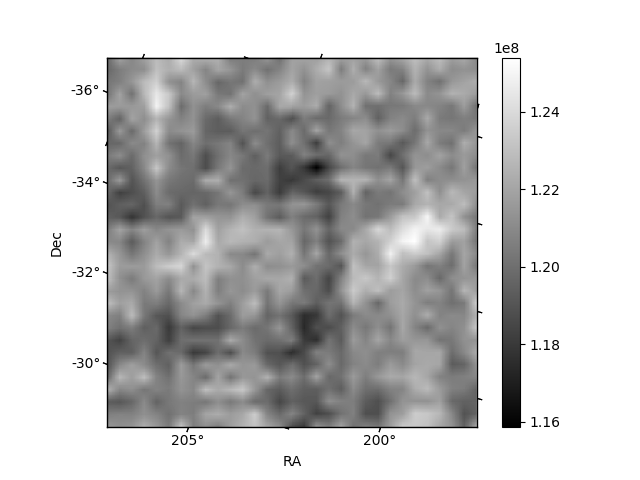
| Quadrant D | 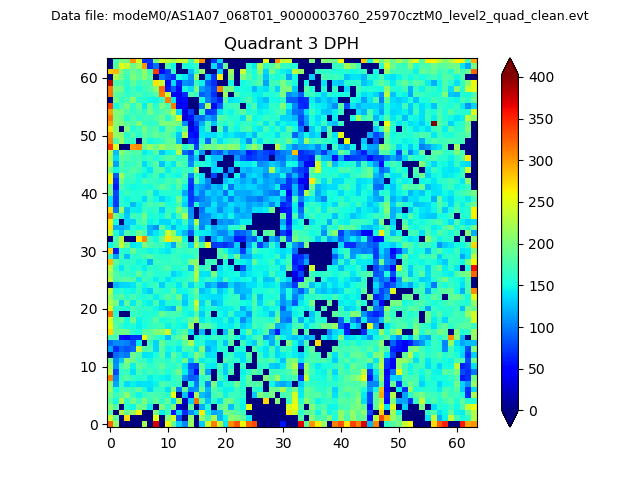 |
 |
Quadrant C |
| Plot type | Count rate plots | Images |
|---|---|---|
| Comparison with Poisson distribution Blue bars denote a histogram of data divided into 1 sec bins. Red curve is a Poisson curve with rate = median count rate of data. |
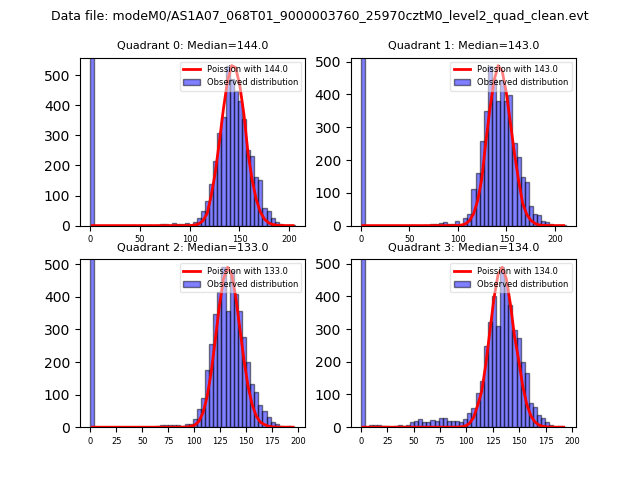 |
 |
| Quadrant-wise count rates Data is divided into 100 sec bins |
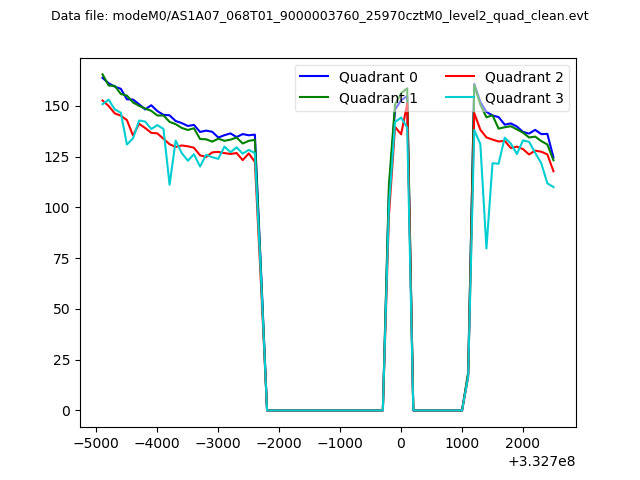 |
|
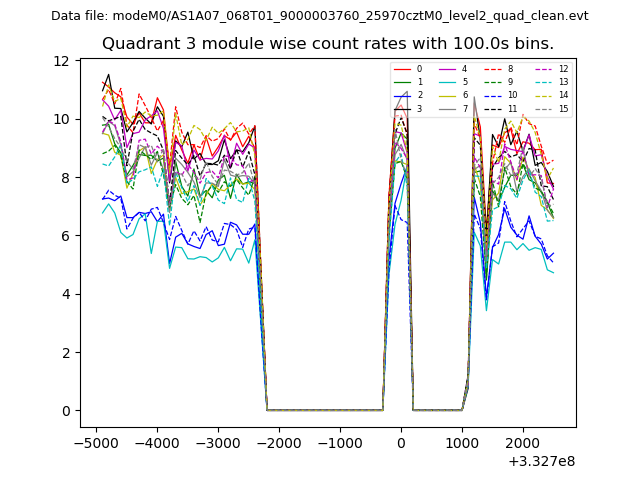
| Module-wise count rates for Quadrant A Data is divided into 100 sec bins |
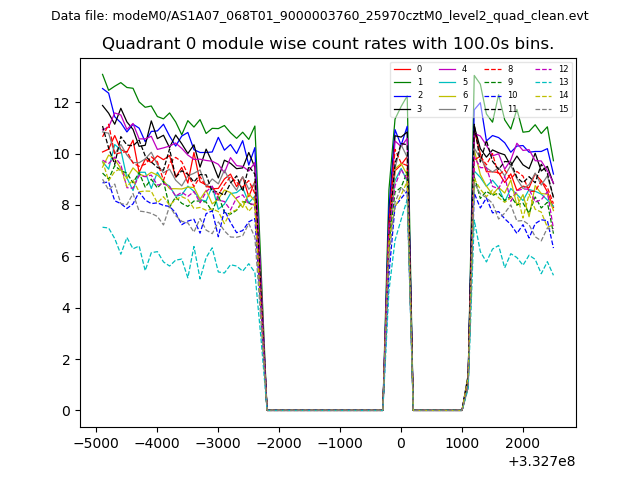 |
 |
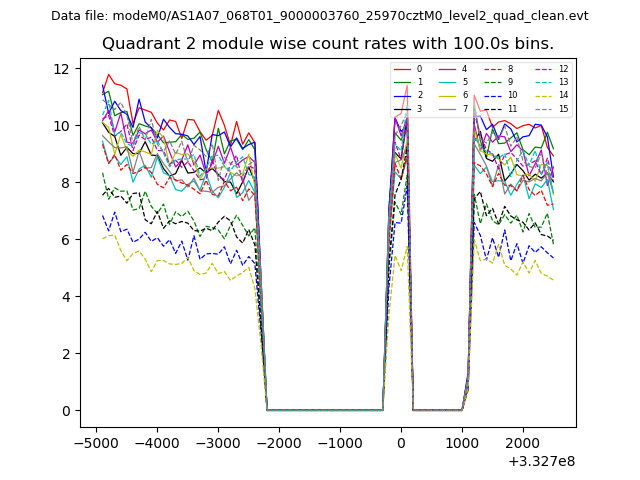
| Module-wise count rates for Quadrant B Data is divided into 100 sec bins |
 |
 |
| Module-wise count rates for Quadrant C Data is divided into 100 sec bins |
 |
 |
| Module-wise count rates for Quadrant D Data is divided into 100 sec bins |
 |
 |
| Parameter | Plot |
|---|---|
| CZT HV Monitor | 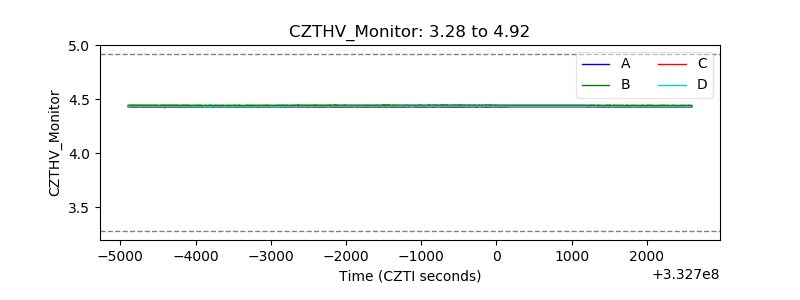 |
| D_VDD | 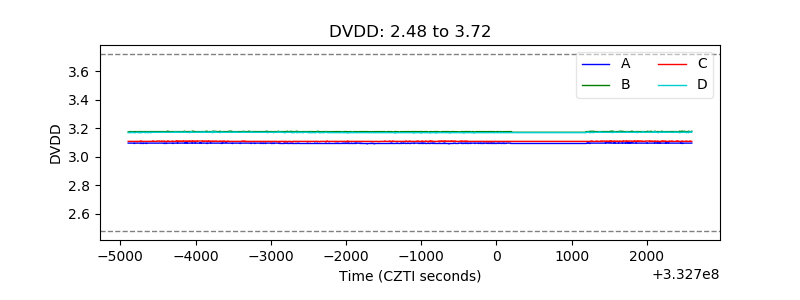 |
| Temperature 1 |  |
| Veto HV Monitor | 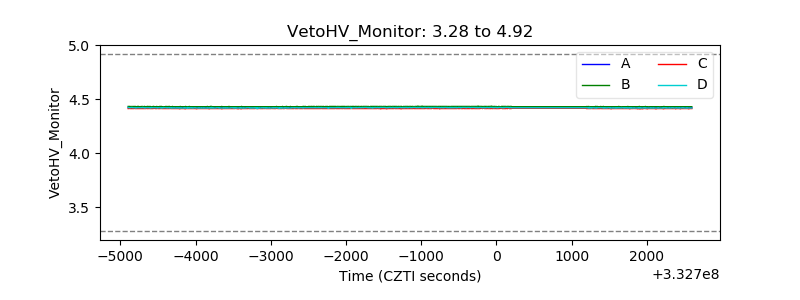 |
| Veto LLD | 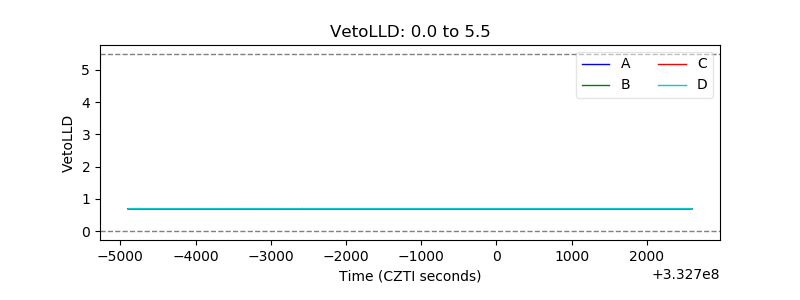 |
| Alpha Counter | 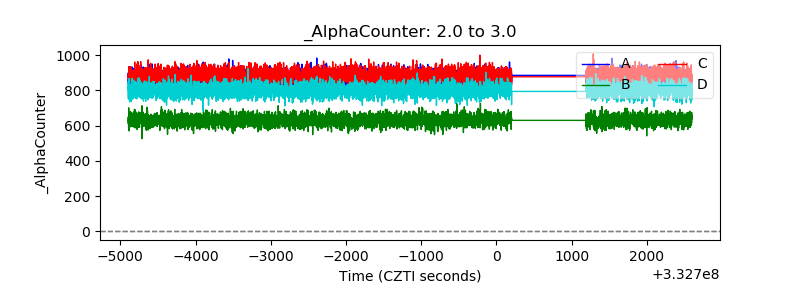 |
| _CPM_Rate | 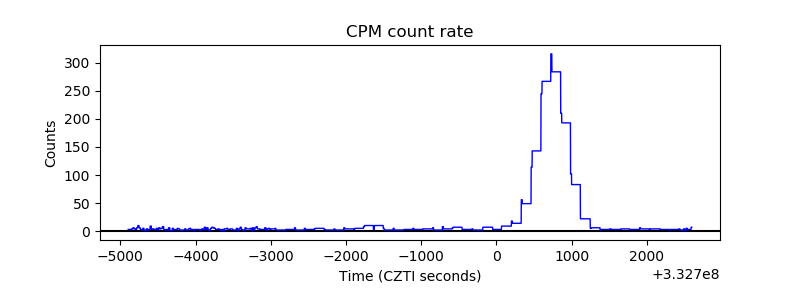 |
| CZT Counter | 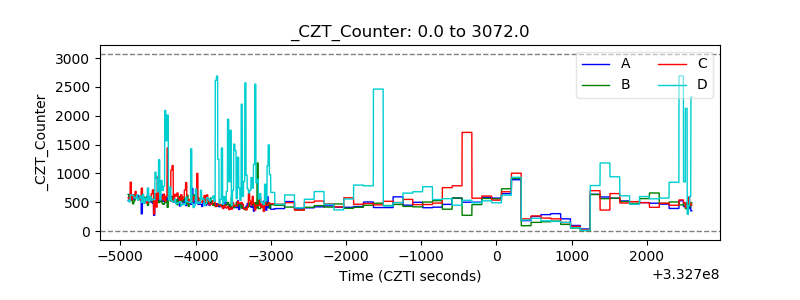 |
| +2.5 Volts monitor |  |
| +5 Volts monitor | 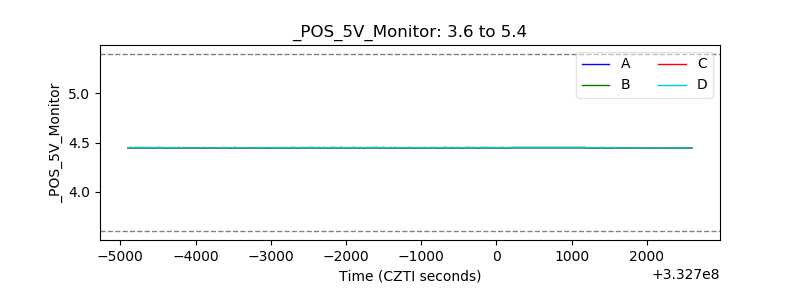 |
| _ROLL_ROT | 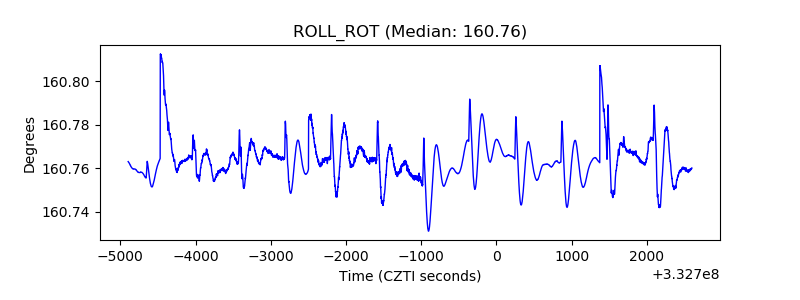 |
| _Roll_DEC | 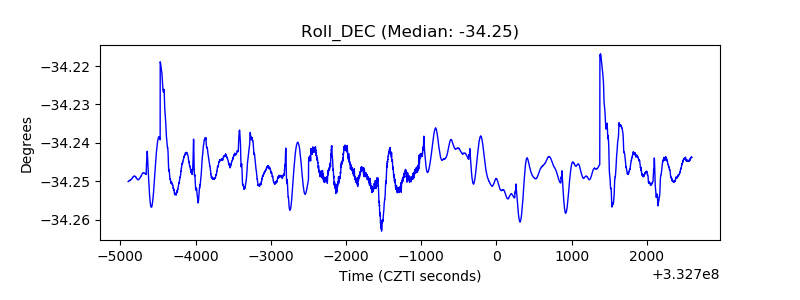 |
| _Roll_RA | 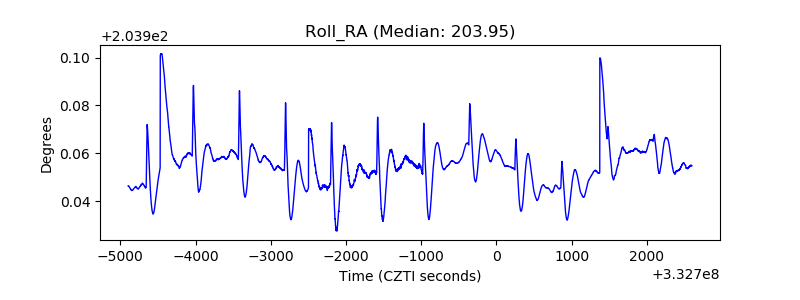 |
| Veto Counter | 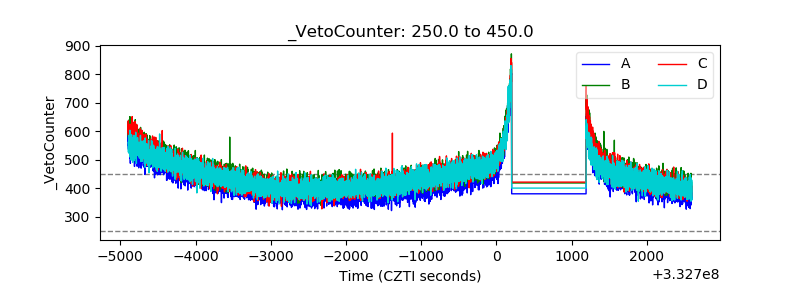 |