| Param | Original file | Final file |
|---|---|---|
| Filename | modeM0/AS1A07_068T01_9000003760_25971cztM0_level2.evt | modeM0/AS1A07_068T01_9000003760_25971cztM0_level2_quad_clean.evt |
| Size (bytes) | 504,282,240 | 93,121,920 |
| Size | 480.9 MB | 88.8 MB |
| Events in quadrant A | 3,168,602 | 613,491 |
| Events in quadrant B | 3,213,671 | 606,742 |
| Events in quadrant C | 4,071,516 | 571,922 |
| Events in quadrant D | 4,372,354 | 569,369 |
| Mode M0 | |||
|---|---|---|---|
| Quadrant | BADHDUFLAG | Total packets | Discarded packets |
| A | 0 | 13498 | 0 |
| B | 0 | 13644 | 0 |
| C | 0 | 16396 | 0 |
| D | 0 | 17354 | 0 |
| Mode M9 | |||
|---|---|---|---|
| Quadrant | BADHDUFLAG | Total packets | Discarded packets |
| A | 0 | 6 | 0 |
| B | 0 | 6 | 0 |
| C | 0 | 6 | 0 |
| D | 0 | 6 | 0 |
| Quadrant | Total seconds | Saturated seconds | Saturation percentage |
|---|---|---|---|
| A | 6573 | 33 | 0.502054% |
| B | 6570 | 41 | 0.624049% |
| C | 6572 | 158 | 2.404139% |
| D | 6572 | 288 | 4.382228% |
Noise dominated data is calculated using 1-second bins in cleaned event files. If a bin has >2000 counts, and if more than 50% of those come from <1% of pixels, then it is considered to be noise-dominated and hence unusable.
| Quadrant | # 1 sec bins | Bins with >0 counts | Bins with >2000 counts | High rate bins dominated by noise | Noise dominated (total time) | Noise dominated (detector-on time) | Marked lightcurve |
|---|---|---|---|---|---|---|---|
| A | 7194 | 6575 | 0 | 0 | 0.00% | 0.00% | 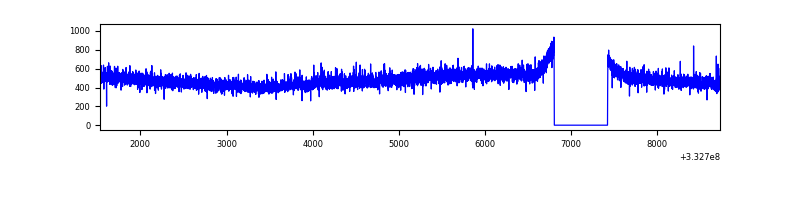 |
| B | 7194 | 6575 | 0 | 0 | 0.00% | 0.00% | 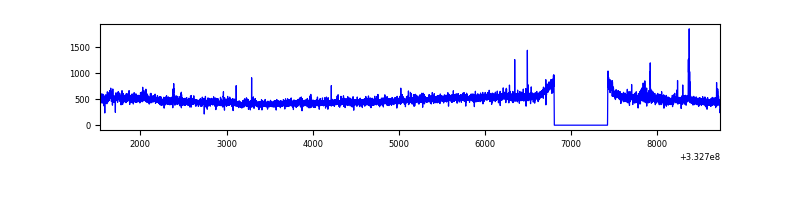 |
| C | 7195 | 6576 | 40 | 40 | 0.56% | 0.61% | 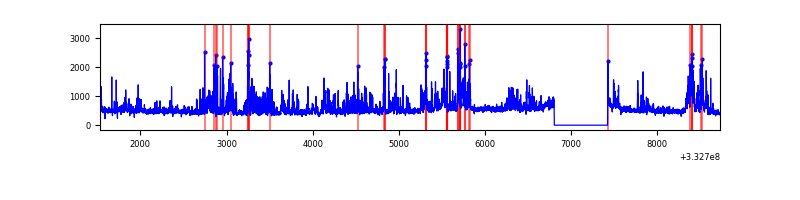 |
| D | 7195 | 6576 | 238 | 238 | 3.31% | 3.62% | 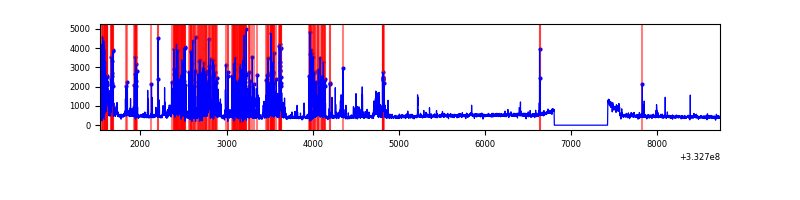 |
Top three noisy pixels from each quadrant. If the there are fewer than three noisy pixels in the level2.evt file, extra rows are filled as -1
| Pixel properties | Quadrant properties | ||||||
|---|---|---|---|---|---|---|---|
| Quadrant | DetID | PixID | Counts | Sigma | Mean | Median | Sigma |
| A | 11 | 29 | 44592 | 269.38 | 808 | 789 | 162.6 |
| A | 13 | 254 | 11365 | 65.04 | 808 | 789 | 162.6 |
| A | 3 | 137 | 7558 | 41.63 | 808 | 789 | 162.6 |
| B | 15 | 33 | 33840 | 215.76 | 795 | 775 | 153.2 |
| B | 0 | 229 | 26484 | 167.76 | 795 | 775 | 153.2 |
| B | 0 | 190 | 24224 | 153.02 | 795 | 775 | 153.2 |
| C | 3 | 233 | 975862 | 5503.84 | 754 | 757 | 177.2 |
| C | 14 | 238 | 121148 | 679.53 | 754 | 757 | 177.2 |
| C | 7 | 238 | 25151 | 137.69 | 754 | 757 | 177.2 |
| D | 1 | 52 | 1426161 | 7768.33 | 760 | 740 | 183.5 |
| D | 2 | 120 | 29735 | 158.02 | 760 | 740 | 183.5 |
| D | 2 | 234 | 25322 | 133.97 | 760 | 740 | 183.5 |
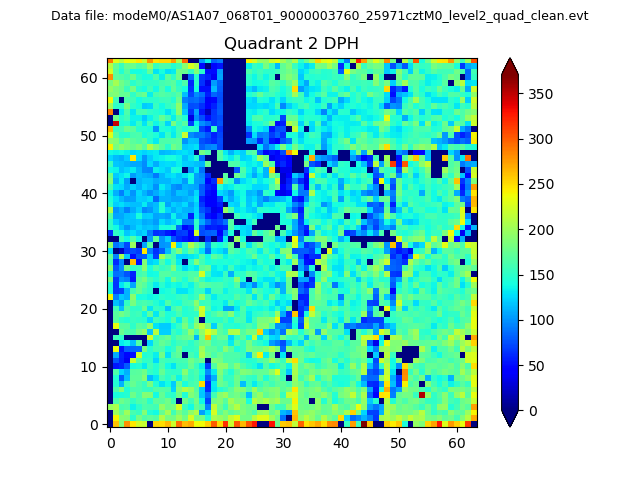
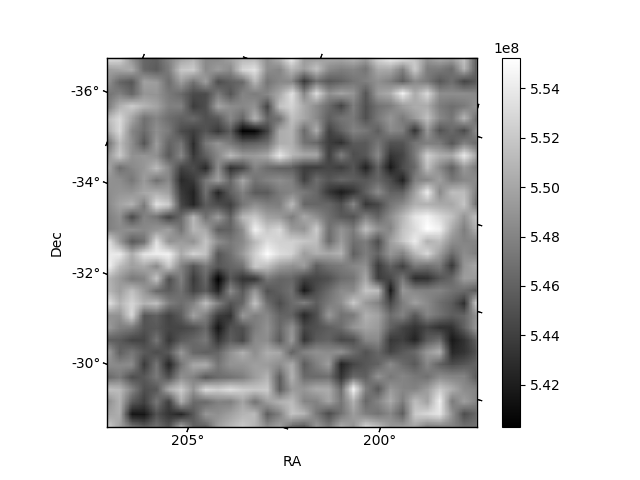
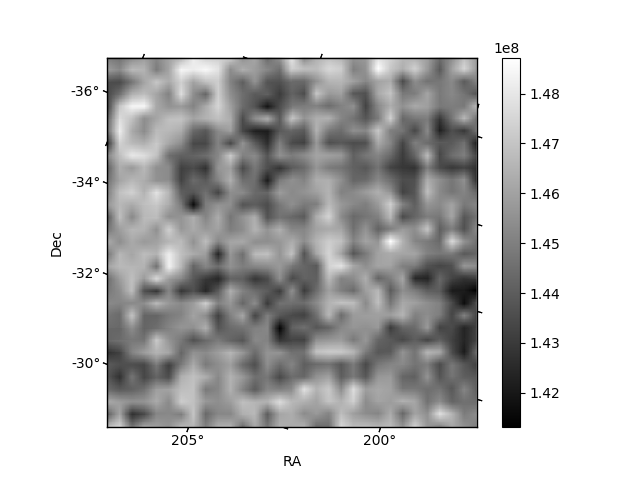
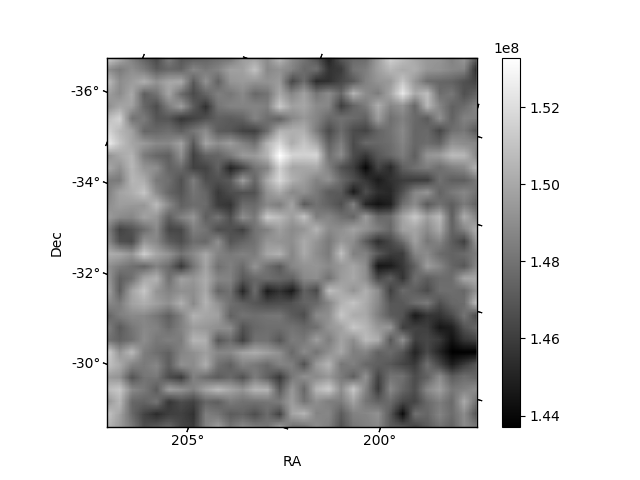
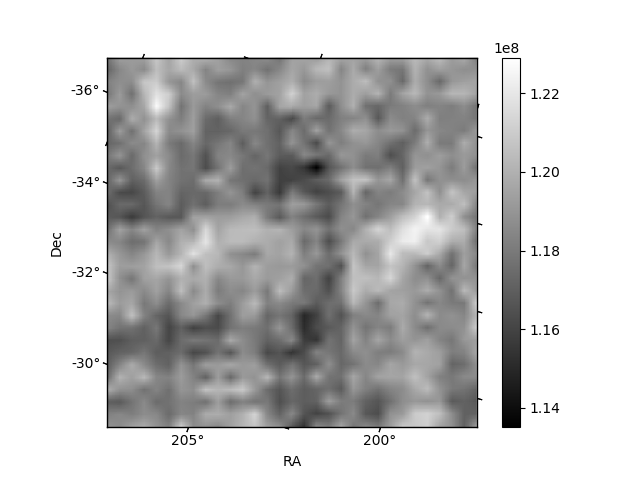
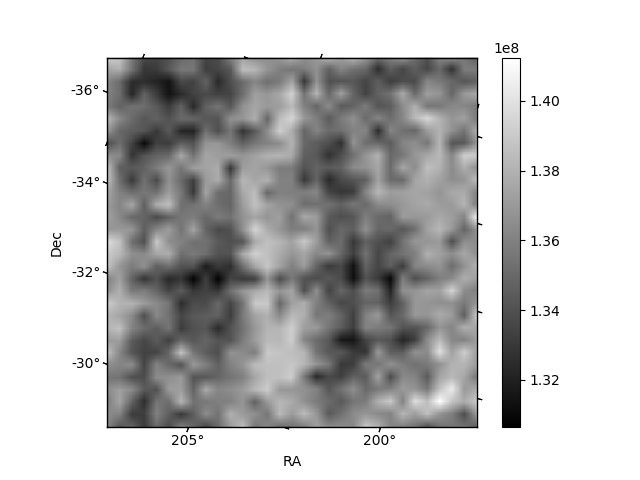
Histogram calculated using DETX and DETY for each event in the final _common_clean file
| Quadrant A | 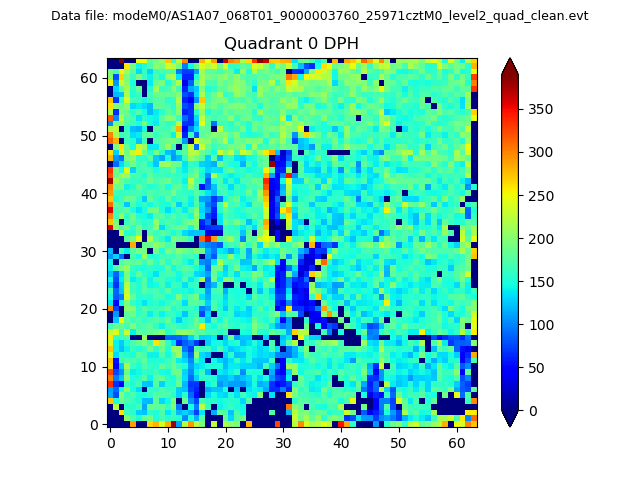 |
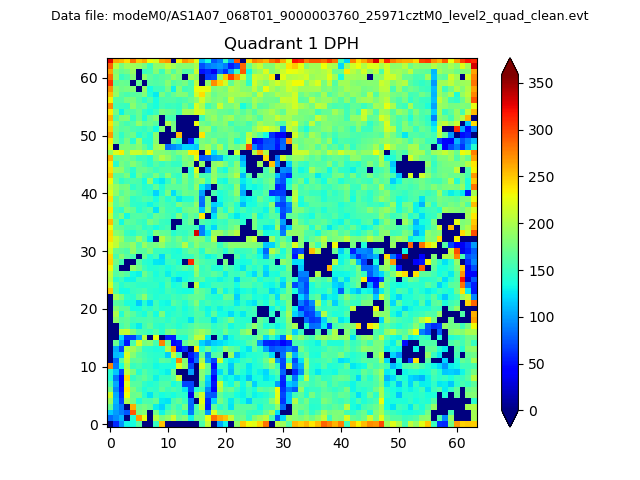 |
Quadrant B |
|---|---|---|---|
| Quadrant D | 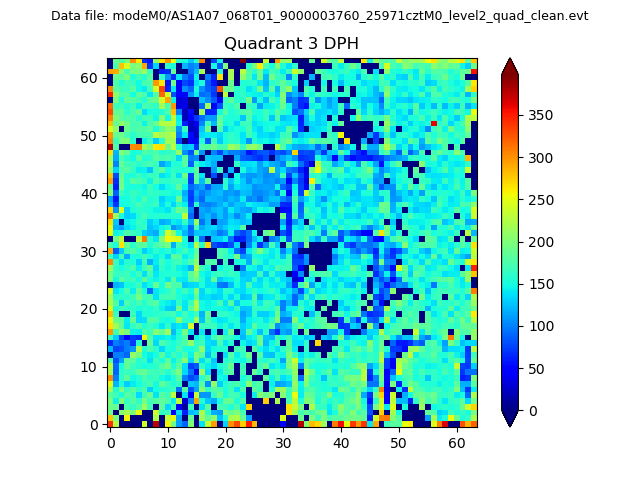 |
 |
Quadrant C |
| Plot type | Count rate plots | Images |
|---|---|---|
| Comparison with Poisson distribution Blue bars denote a histogram of data divided into 1 sec bins. Red curve is a Poisson curve with rate = median count rate of data. |
 |
 |
| Quadrant-wise count rates Data is divided into 100 sec bins |
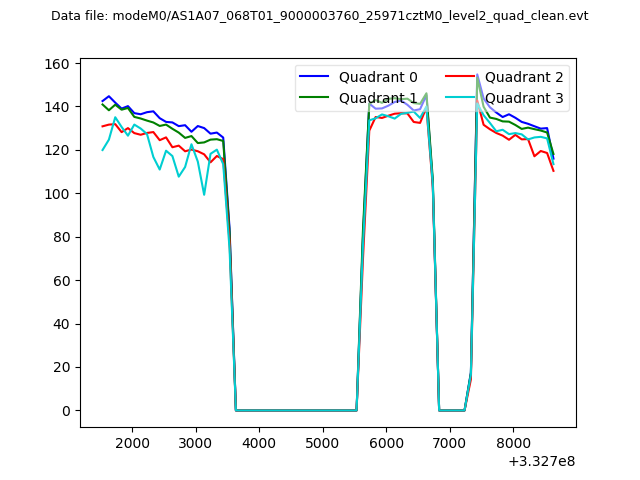 |
|
| Module-wise count rates for Quadrant A Data is divided into 100 sec bins |
 |
 |
| Module-wise count rates for Quadrant B Data is divided into 100 sec bins |
 |
 |
| Module-wise count rates for Quadrant C Data is divided into 100 sec bins |
 |
 |
| Module-wise count rates for Quadrant D Data is divided into 100 sec bins |
 |
 |
| Parameter | Plot |
|---|---|
| CZT HV Monitor |  |
| D_VDD | 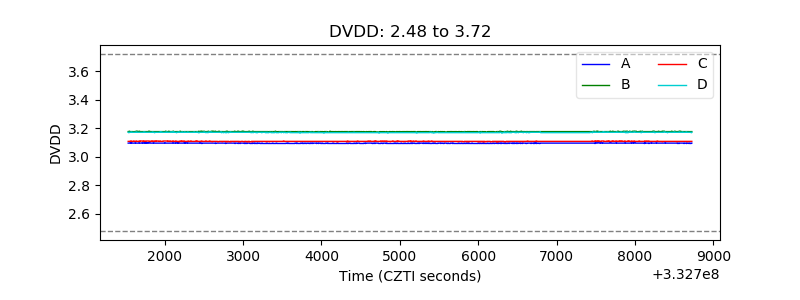 |
| Temperature 1 | 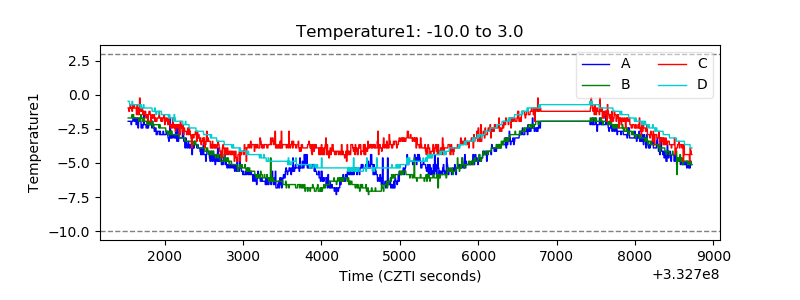 |
| Veto HV Monitor | 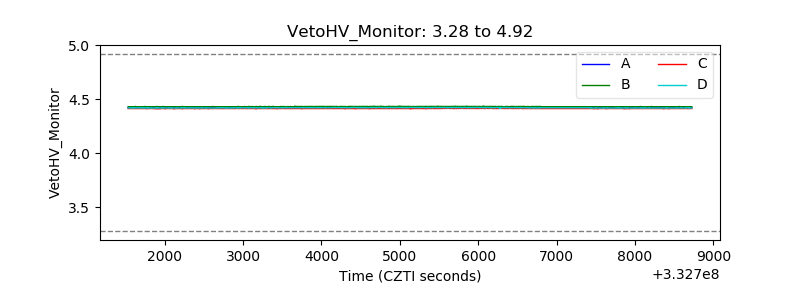 |
| Veto LLD |  |
| Alpha Counter | 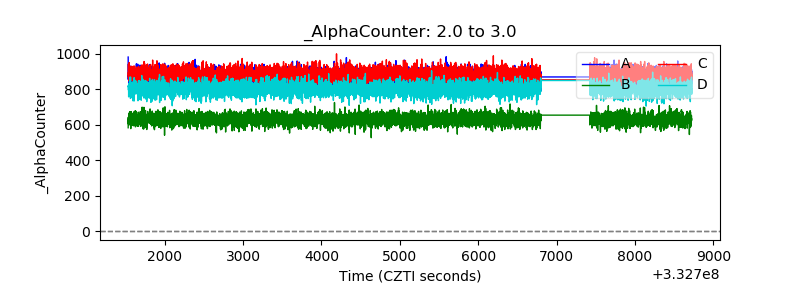 |
| _CPM_Rate | 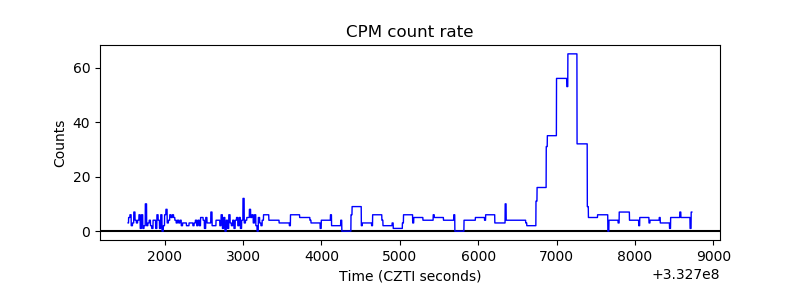 |
| CZT Counter | 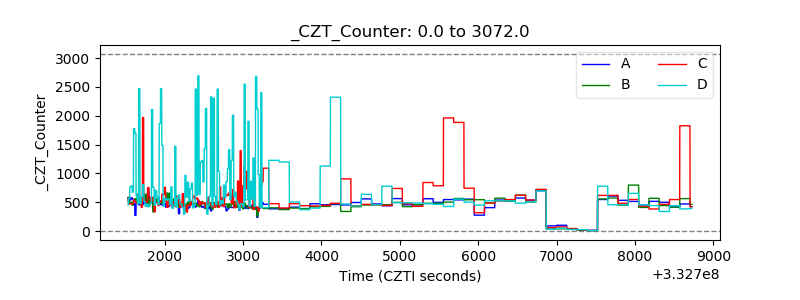 |
| +2.5 Volts monitor |  |
| +5 Volts monitor | 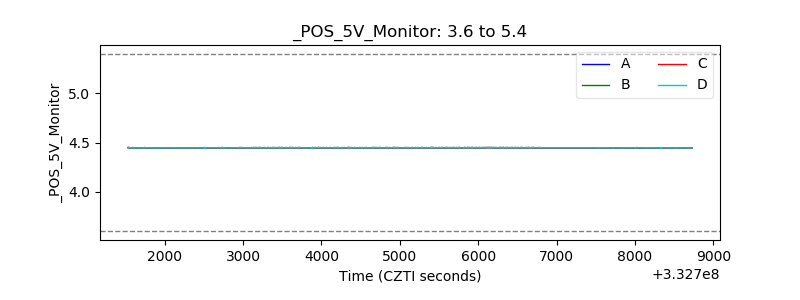 |
| _ROLL_ROT |  |
| _Roll_DEC | 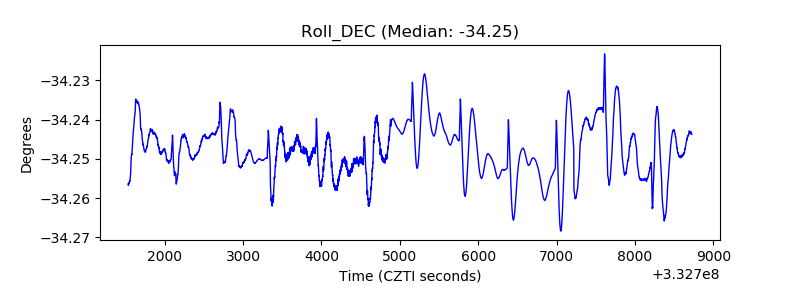 |
| _Roll_RA | 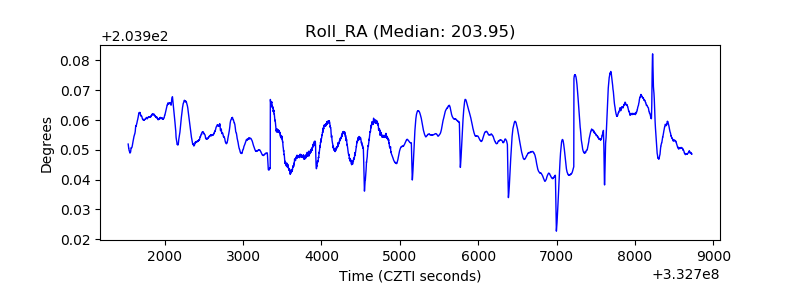 |
| Veto Counter |  |