| Param | Original file | Final file |
|---|---|---|
| Filename | modeM0/AS1A07_068T01_9000003760_25976cztM0_level2.evt | modeM0/AS1A07_068T01_9000003760_25976cztM0_level2_quad_clean.evt |
| Size (bytes) | 949,691,520 | 153,524,160 |
| Size | 905.7 MB | 146.4 MB |
| Events in quadrant A | 5,466,654 | 992,702 |
| Events in quadrant B | 5,533,065 | 994,466 |
| Events in quadrant C | 6,734,035 | 937,130 |
| Events in quadrant D | 10,222,655 | 901,634 |
| Mode M0 | |||
|---|---|---|---|
| Quadrant | BADHDUFLAG | Total packets | Discarded packets |
| A | 0 | 24009 | 0 |
| B | 0 | 24181 | 0 |
| C | 0 | 27689 | 0 |
| D | 0 | 38386 | 0 |
| Mode M9 | |||
|---|---|---|---|
| Quadrant | BADHDUFLAG | Total packets | Discarded packets |
| A | 0 | 14 | 5 |
| B | 0 | 14 | 5 |
| C | 0 | 14 | 4 |
| D | 0 | 17 | 8 |
| Quadrant | Total seconds | Saturated seconds | Saturation percentage |
|---|---|---|---|
| A | 11800 | 82 | 0.694915% |
| B | 11803 | 108 | 0.915022% |
| C | 11778 | 254 | 2.156563% |
| D | 11777 | 1332 | 11.310181% |
Noise dominated data is calculated using 1-second bins in cleaned event files. If a bin has >2000 counts, and if more than 50% of those come from <1% of pixels, then it is considered to be noise-dominated and hence unusable.
| Quadrant | # 1 sec bins | Bins with >0 counts | Bins with >2000 counts | High rate bins dominated by noise | Noise dominated (total time) | Noise dominated (detector-on time) | Marked lightcurve |
|---|---|---|---|---|---|---|---|
| A | 17281 | 11888 | 0 | 0 | 0.00% | 0.00% | 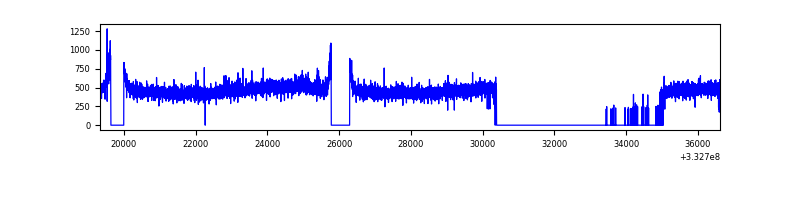 |
| B | 17282 | 11910 | 4 | 4 | 0.02% | 0.03% | 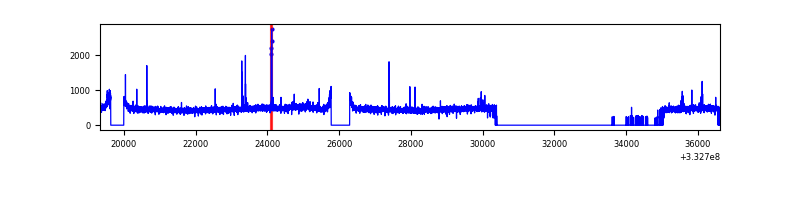 |
| C | 17281 | 11868 | 52 | 52 | 0.30% | 0.44% | 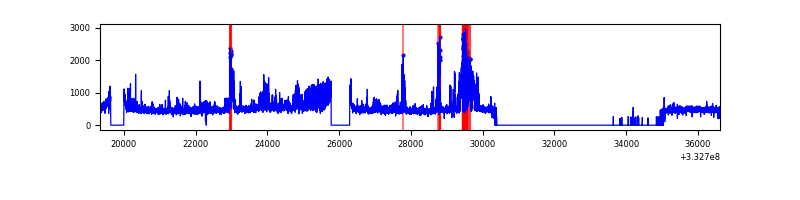 |
| D | 17282 | 11882 | 1068 | 1068 | 6.18% | 8.99% | 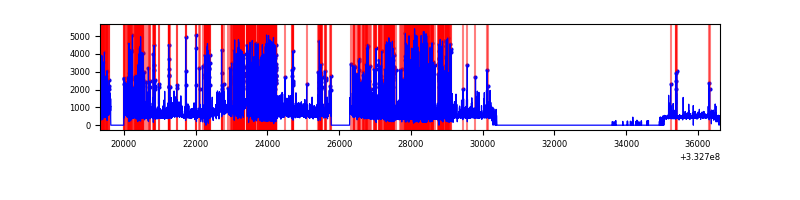 |
Top three noisy pixels from each quadrant. If the there are fewer than three noisy pixels in the level2.evt file, extra rows are filled as -1
| Pixel properties | Quadrant properties | ||||||
|---|---|---|---|---|---|---|---|
| Quadrant | DetID | PixID | Counts | Sigma | Mean | Median | Sigma |
| A | 13 | 254 | 18162 | 59.11 | 1415 | 1383 | 283.9 |
| A | 3 | 137 | 13506 | 42.71 | 1415 | 1383 | 283.9 |
| A | 0 | 226 | 12196 | 38.09 | 1415 | 1383 | 283.9 |
| B | 12 | 111 | 33519 | 119.86 | 1393 | 1354 | 268.3 |
| B | 11 | 111 | 30542 | 108.77 | 1393 | 1354 | 268.3 |
| B | 0 | 230 | 29489 | 104.84 | 1393 | 1354 | 268.3 |
| C | 3 | 233 | 805625 | 2558.63 | 1333 | 1340 | 314.3 |
| C | 7 | 238 | 503362 | 1597.06 | 1333 | 1340 | 314.3 |
| C | 14 | 238 | 216044 | 683.03 | 1333 | 1340 | 314.3 |
| D | 1 | 52 | 4785491 | 15534.11 | 1289 | 1255 | 308.0 |
| D | 7 | 80 | 510742 | 1654.27 | 1289 | 1255 | 308.0 |
| D | 2 | 234 | 42243 | 133.09 | 1289 | 1255 | 308.0 |
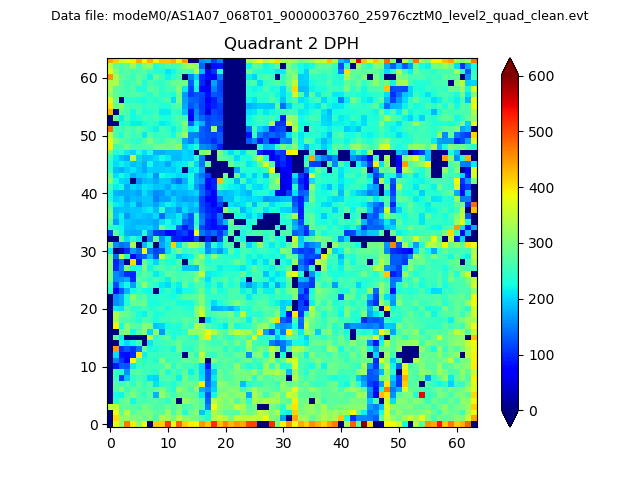
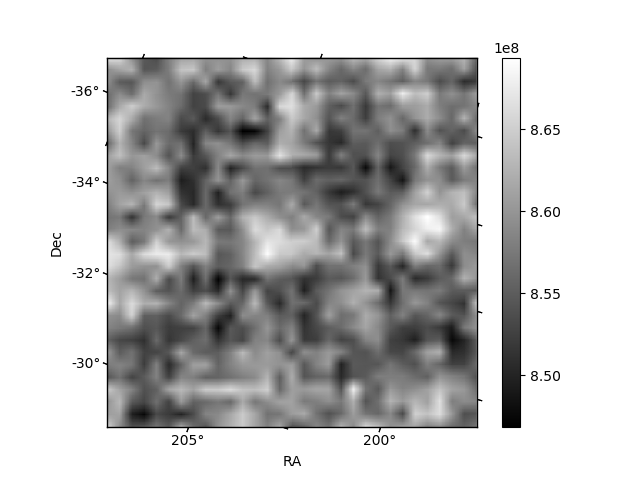
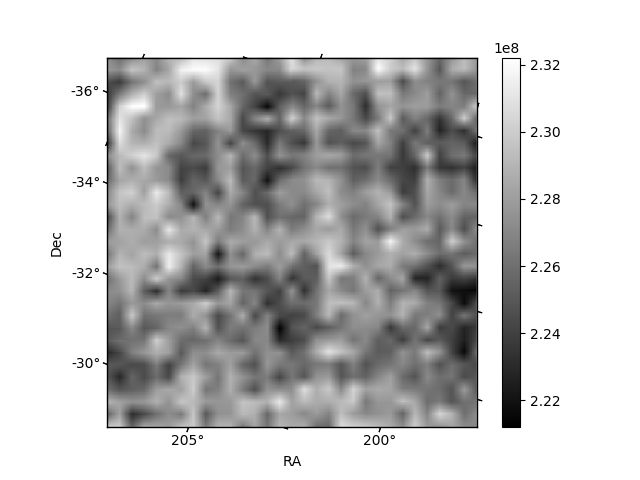
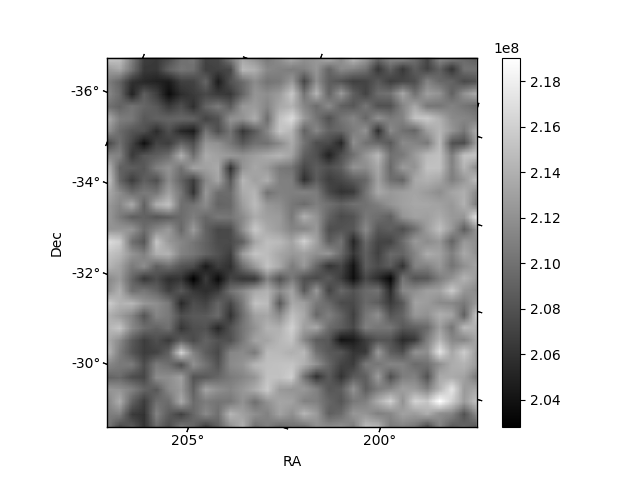
Histogram calculated using DETX and DETY for each event in the final _common_clean file
| Quadrant A | 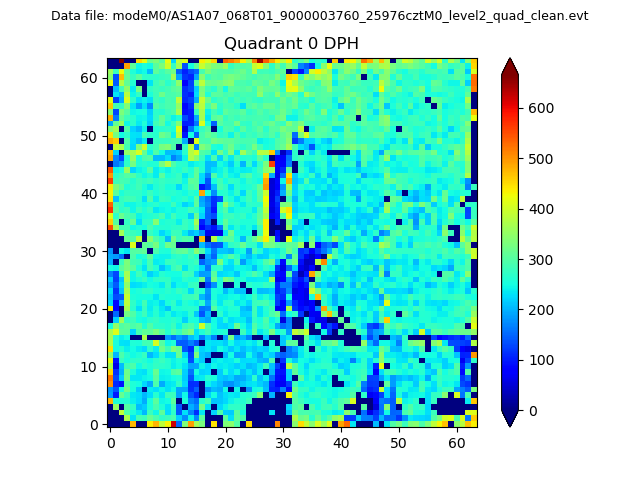 |
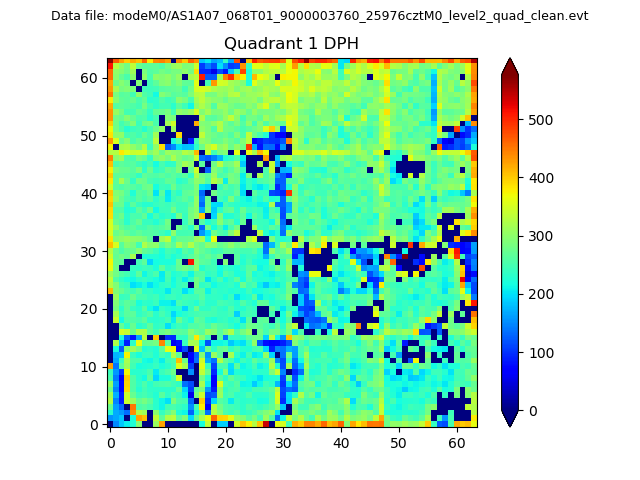 |
Quadrant B |
|---|---|---|---|
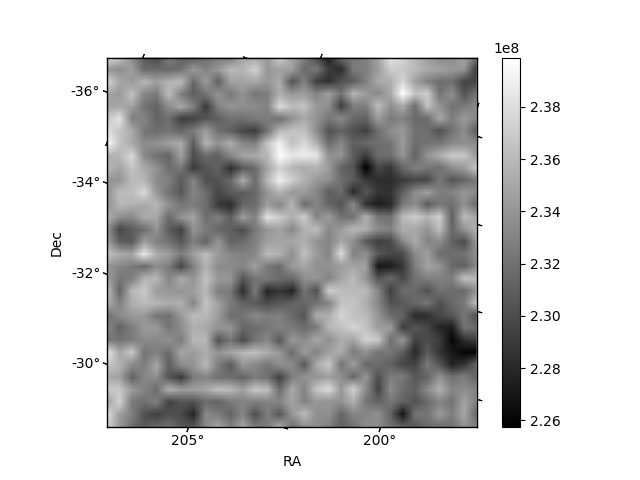
| Quadrant D | 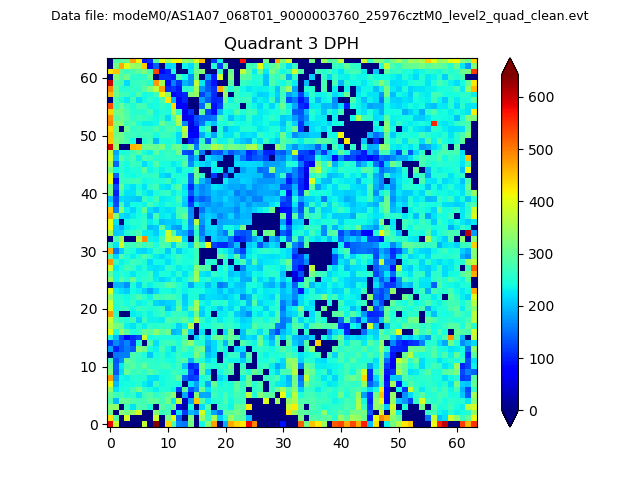 |
 |
Quadrant C |
| Plot type | Count rate plots | Images |
|---|---|---|
| Comparison with Poisson distribution Blue bars denote a histogram of data divided into 1 sec bins. Red curve is a Poisson curve with rate = median count rate of data. |
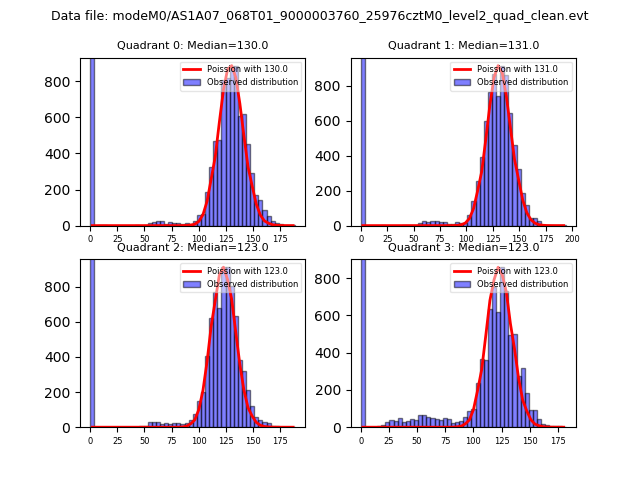 |
 |
| Quadrant-wise count rates Data is divided into 100 sec bins |
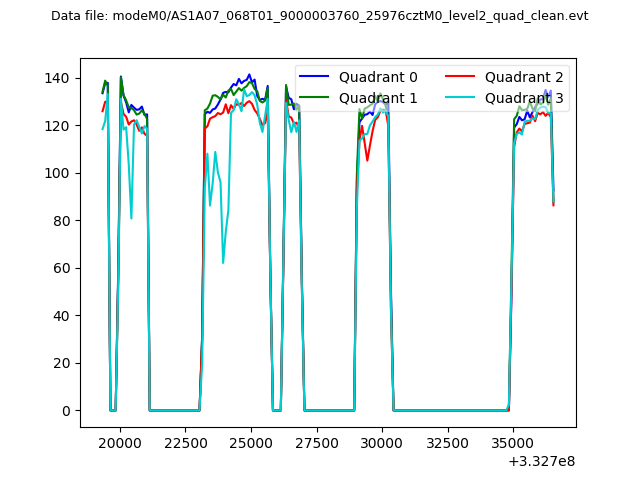 |
|
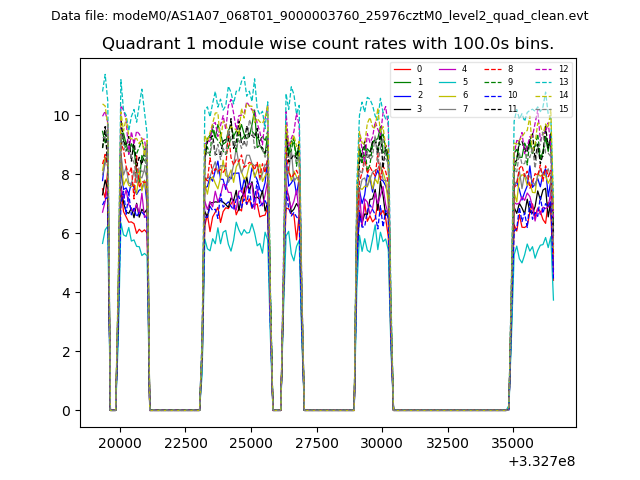
| Module-wise count rates for Quadrant A Data is divided into 100 sec bins |
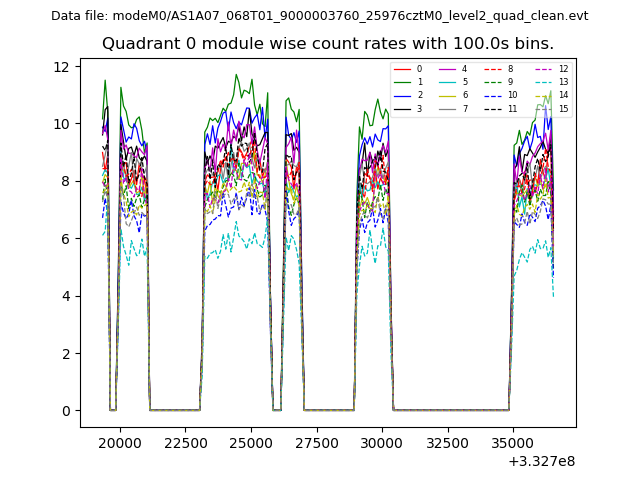 |
 |
| Module-wise count rates for Quadrant B Data is divided into 100 sec bins |
 |
 |
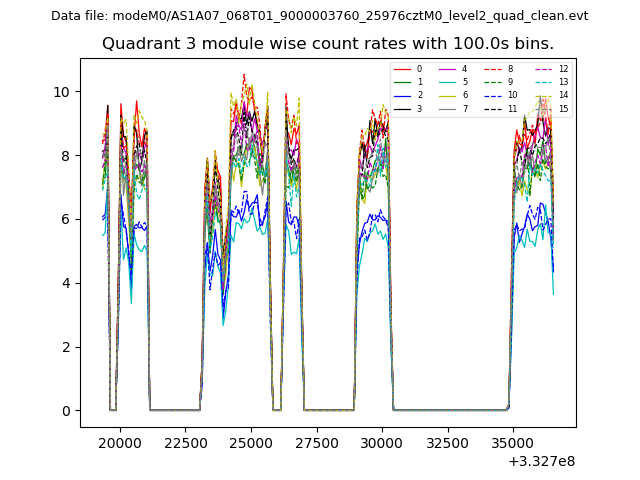
| Module-wise count rates for Quadrant C Data is divided into 100 sec bins |
 |
 |
| Module-wise count rates for Quadrant D Data is divided into 100 sec bins |
 |
 |
| Parameter | Plot |
|---|---|
| CZT HV Monitor |  |
| D_VDD | 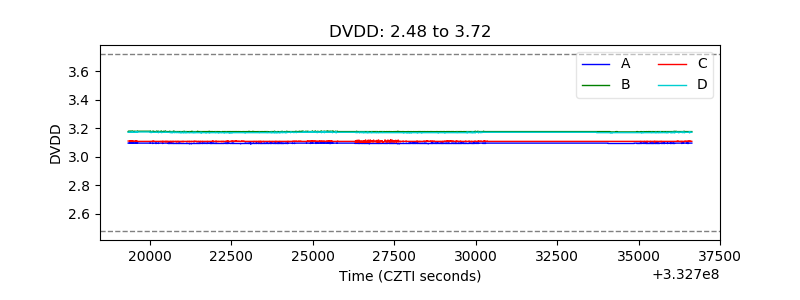 |
| Temperature 1 | 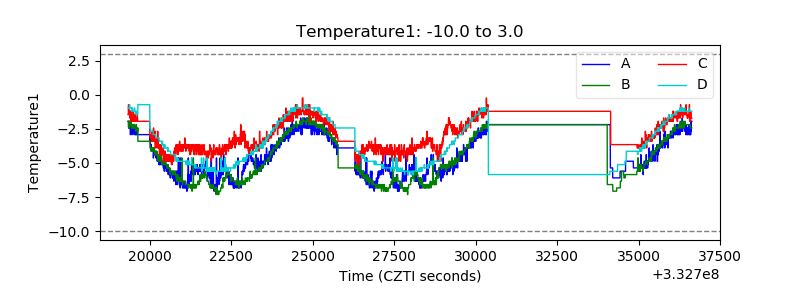 |
| Veto HV Monitor | 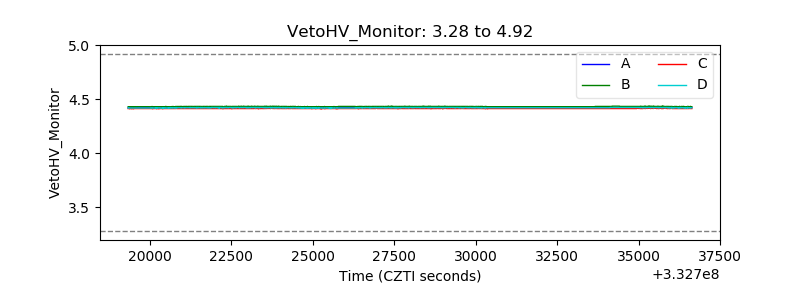 |
| Veto LLD | 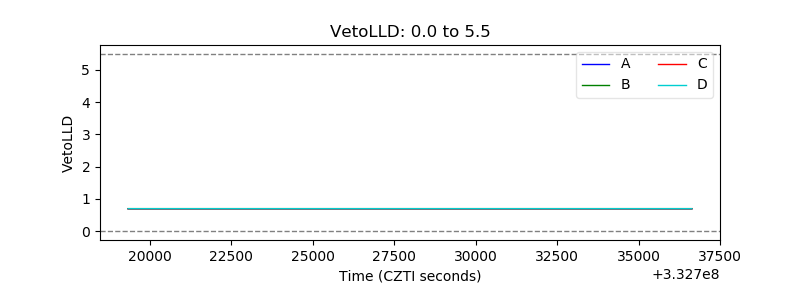 |
| Alpha Counter | 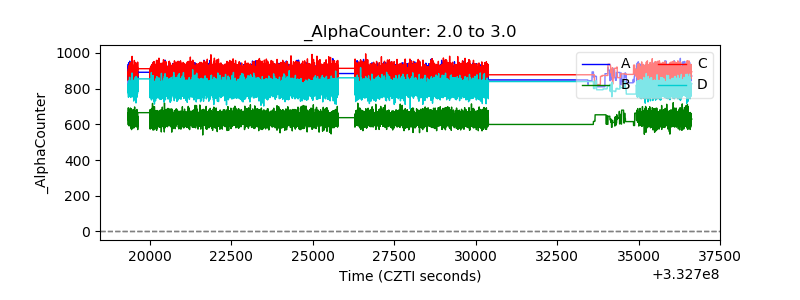 |
| _CPM_Rate | 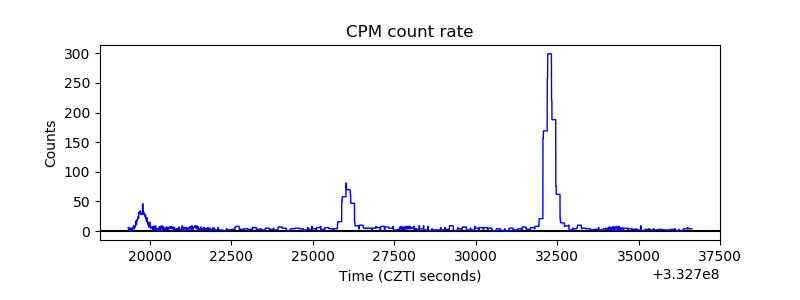 |
| CZT Counter | 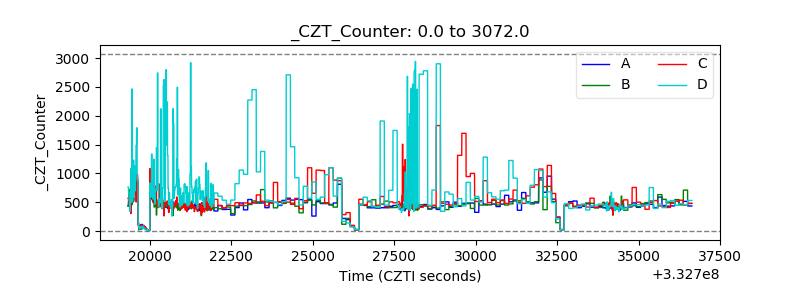 |
| +2.5 Volts monitor |  |
| +5 Volts monitor |  |
| _ROLL_ROT | 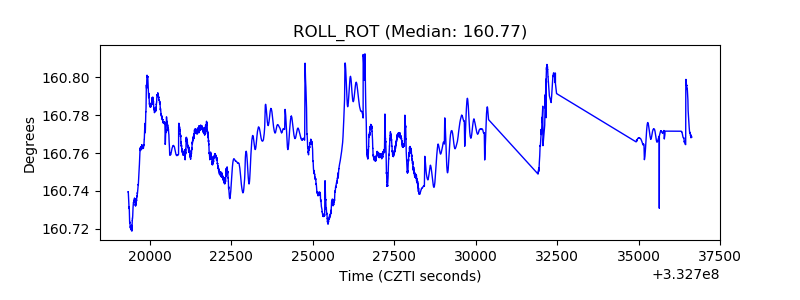 |
| _Roll_DEC | 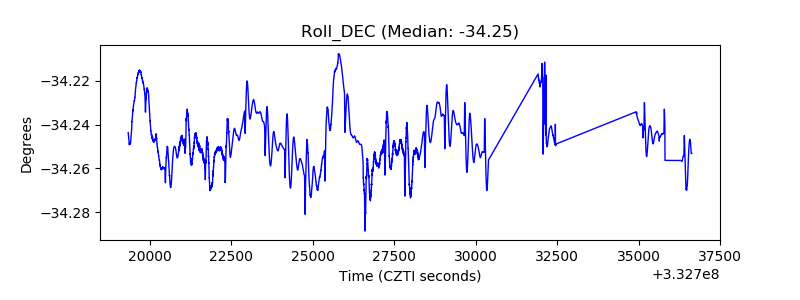 |
| _Roll_RA | 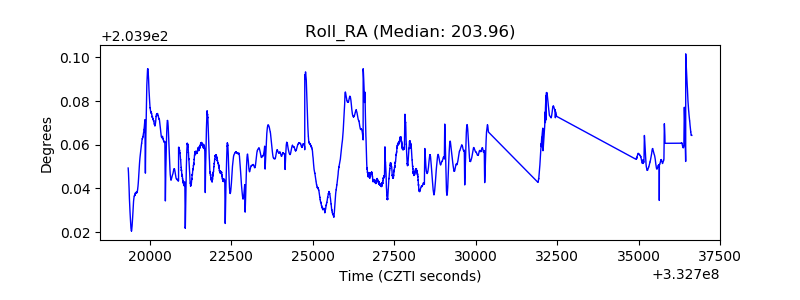 |
| Veto Counter | 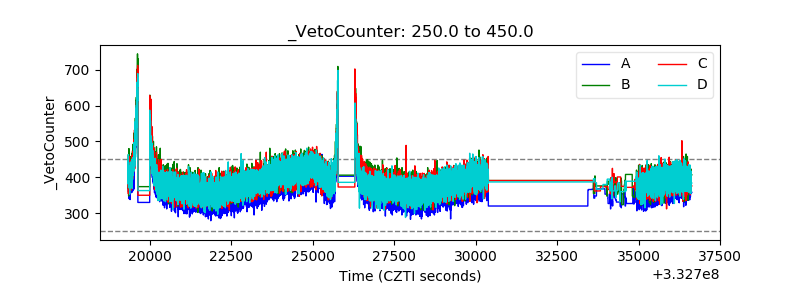 |