| Param | Original file | Final file |
|---|---|---|
| Filename | modeM0/AS1A07_068T01_9000003760_25977cztM0_level2.evt | modeM0/AS1A07_068T01_9000003760_25977cztM0_level2_quad_clean.evt |
| Size (bytes) | 1,880,023,680 | 297,714,240 |
| Size | 1.8 GB | 283.9 MB |
| Events in quadrant A | 11,321,980 | 1,908,690 |
| Events in quadrant B | 11,451,122 | 1,903,823 |
| Events in quadrant C | 12,837,377 | 1,806,154 |
| Events in quadrant D | 19,693,320 | 1,733,203 |
| Mode M0 | |||
|---|---|---|---|
| Quadrant | BADHDUFLAG | Total packets | Discarded packets |
| A | 0 | 49119 | 0 |
| B | 0 | 49381 | 0 |
| C | 0 | 53468 | 0 |
| D | 0 | 74864 | 0 |
| Mode M9 | |||
|---|---|---|---|
| Quadrant | BADHDUFLAG | Total packets | Discarded packets |
| A | 0 | 33 | 2 |
| B | 0 | 31 | 2 |
| C | 0 | 32 | 2 |
| D | 0 | 32 | 2 |
| Quadrant | Total seconds | Saturated seconds | Saturation percentage |
|---|---|---|---|
| A | 24053 | 177 | 0.735875% |
| B | 24046 | 227 | 0.944024% |
| C | 24047 | 439 | 1.825592% |
| D | 24044 | 2411 | 10.027450% |
Noise dominated data is calculated using 1-second bins in cleaned event files. If a bin has >2000 counts, and if more than 50% of those come from <1% of pixels, then it is considered to be noise-dominated and hence unusable.
| Quadrant | # 1 sec bins | Bins with >0 counts | Bins with >2000 counts | High rate bins dominated by noise | Noise dominated (total time) | Noise dominated (detector-on time) | Marked lightcurve |
|---|---|---|---|---|---|---|---|
| A | 32295 | 24222 | 0 | 0 | 0.00% | 0.00% | 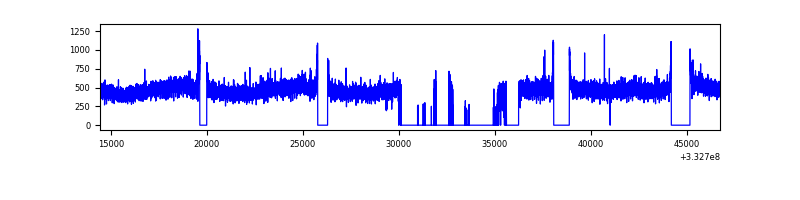 |
| B | 32296 | 24199 | 5 | 5 | 0.02% | 0.02% | 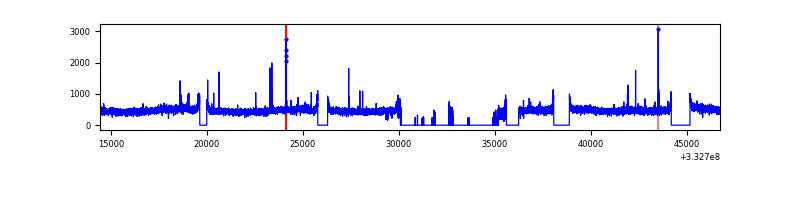 |
| C | 32296 | 24209 | 52 | 52 | 0.16% | 0.21% | 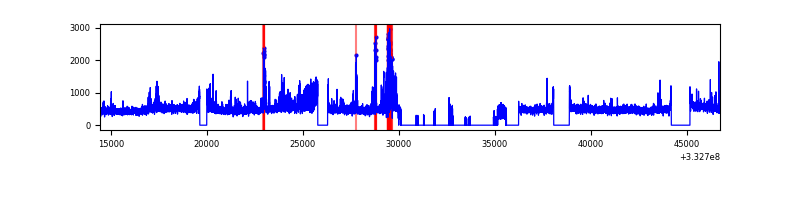 |
| D | 32296 | 24189 | 1846 | 1846 | 5.72% | 7.63% | 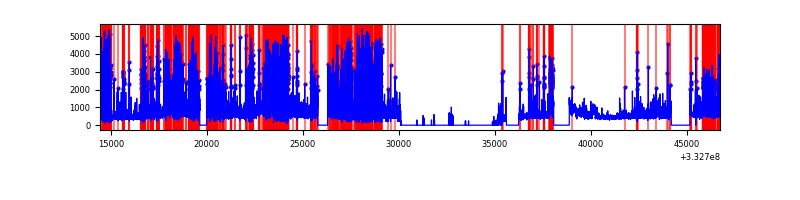 |
Top three noisy pixels from each quadrant. If the there are fewer than three noisy pixels in the level2.evt file, extra rows are filled as -1
| Pixel properties | Quadrant properties | ||||||
|---|---|---|---|---|---|---|---|
| Quadrant | DetID | PixID | Counts | Sigma | Mean | Median | Sigma |
| A | 13 | 254 | 37913 | 59.88 | 2930 | 2869 | 585.3 |
| A | 3 | 1 | 27464 | 42.02 | 2930 | 2869 | 585.3 |
| A | 3 | 137 | 27400 | 41.91 | 2930 | 2869 | 585.3 |
| B | 12 | 111 | 69330 | 121.29 | 2888 | 2816 | 548.4 |
| B | 11 | 111 | 62186 | 108.26 | 2888 | 2816 | 548.4 |
| B | 14 | 111 | 57264 | 99.29 | 2888 | 2816 | 548.4 |
| C | 3 | 233 | 1057926 | 1634.38 | 2769 | 2789 | 645.6 |
| C | 7 | 238 | 513173 | 790.57 | 2769 | 2789 | 645.6 |
| C | 14 | 238 | 447791 | 689.3 | 2769 | 2789 | 645.6 |
| D | 1 | 52 | 8417844 | 13123.92 | 2700 | 2635 | 641.2 |
| D | 7 | 80 | 817020 | 1270.07 | 2700 | 2635 | 641.2 |
| D | 12 | 233 | 145463 | 222.75 | 2700 | 2635 | 641.2 |
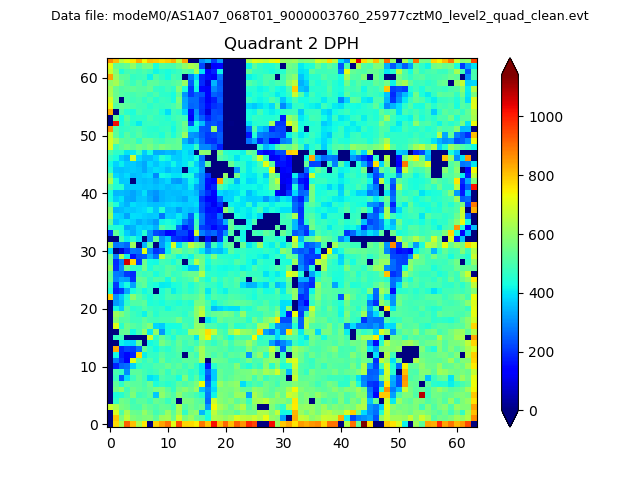
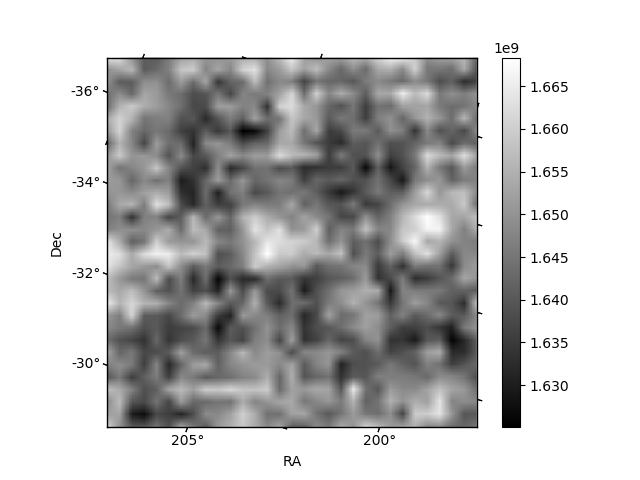
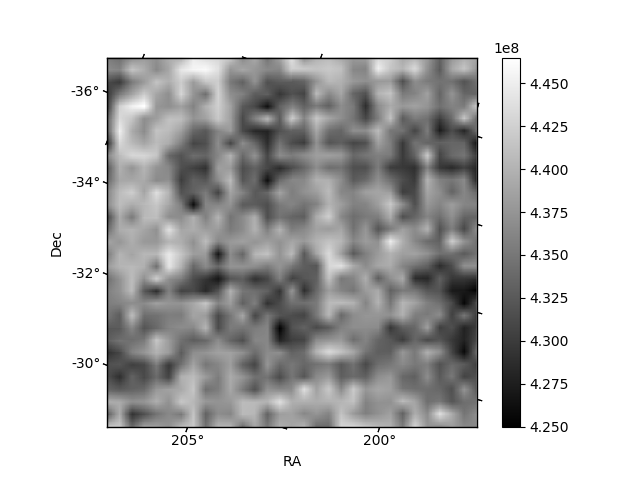
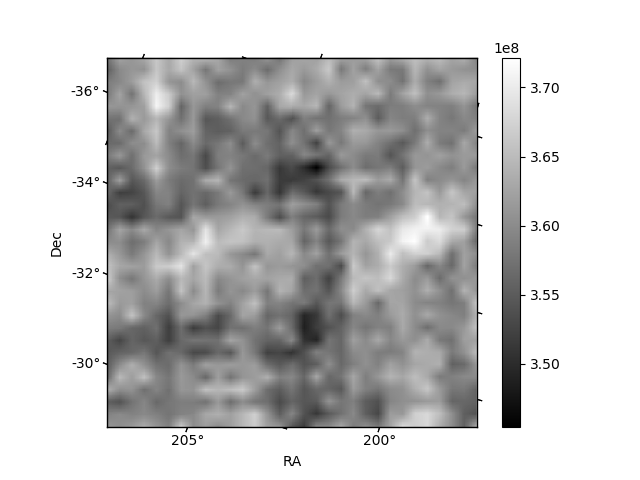
Histogram calculated using DETX and DETY for each event in the final _common_clean file
| Quadrant A | 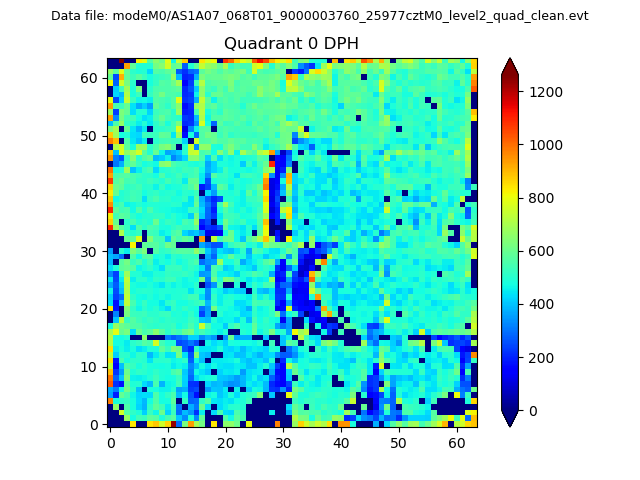 |
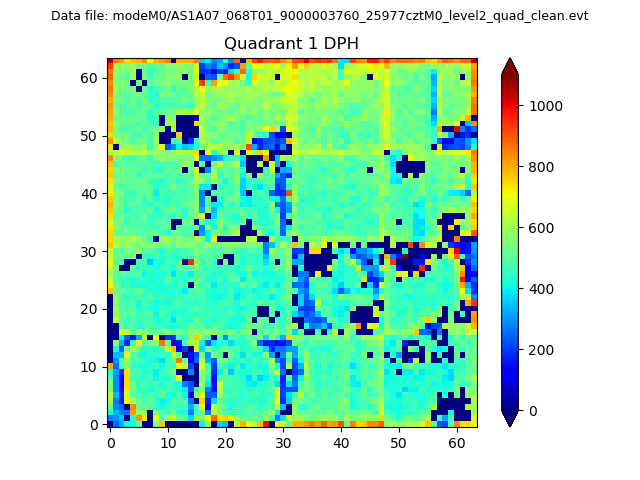 |
Quadrant B |
|---|---|---|---|
| Quadrant D | 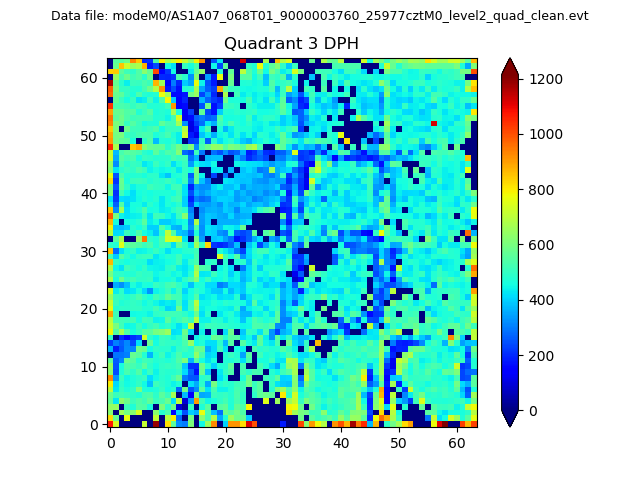 |
 |
Quadrant C |
| Plot type | Count rate plots | Images |
|---|---|---|
| Comparison with Poisson distribution Blue bars denote a histogram of data divided into 1 sec bins. Red curve is a Poisson curve with rate = median count rate of data. |
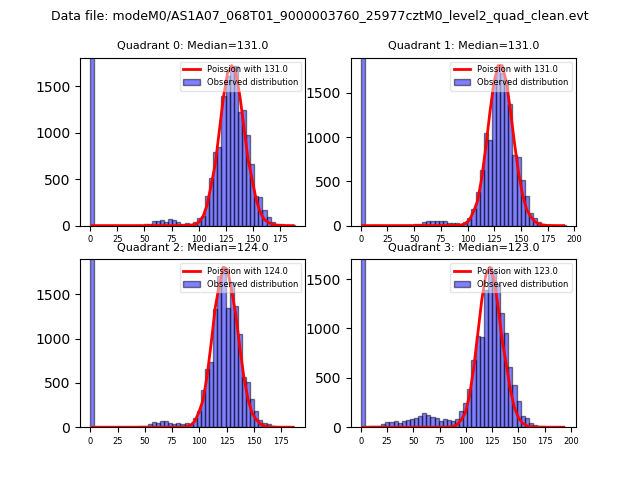 |
 |
| Quadrant-wise count rates Data is divided into 100 sec bins |
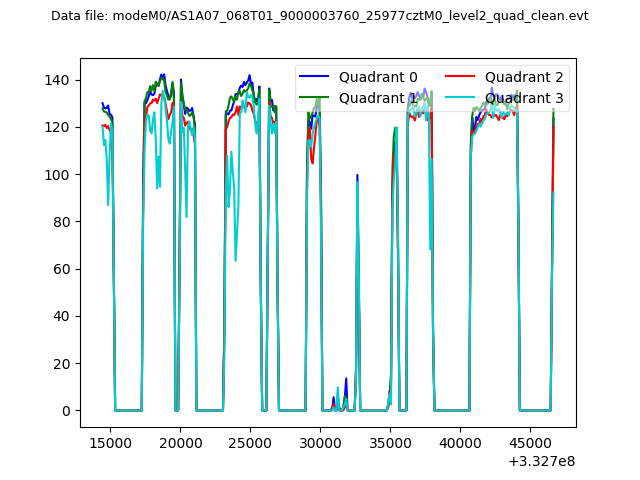 |
|
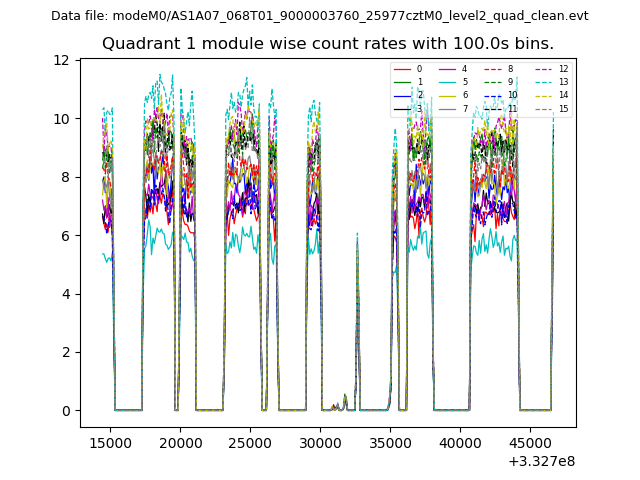
| Module-wise count rates for Quadrant A Data is divided into 100 sec bins |
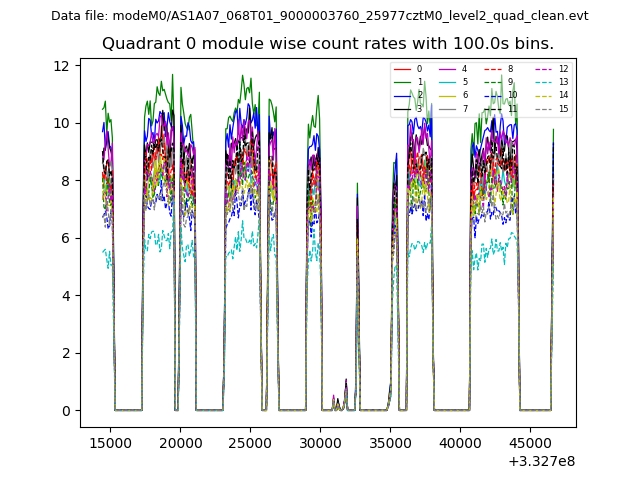 |
 |
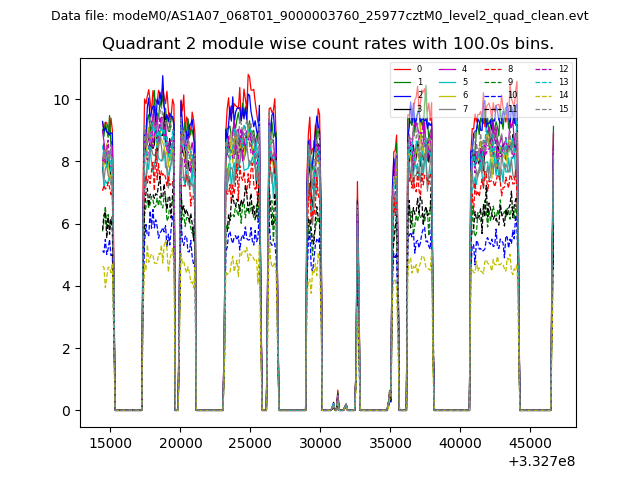
| Module-wise count rates for Quadrant B Data is divided into 100 sec bins |
 |
 |
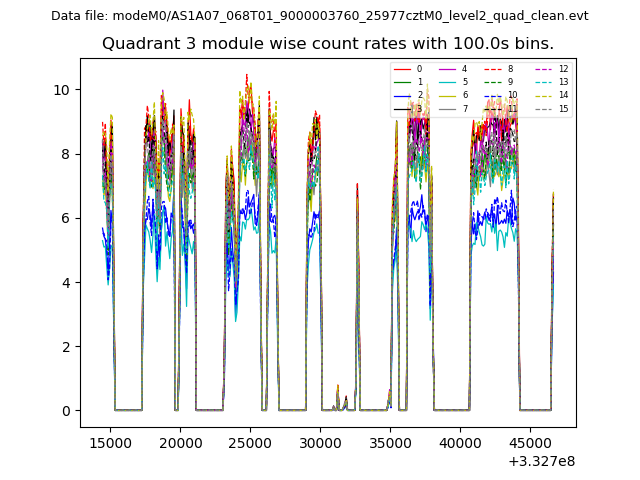
| Module-wise count rates for Quadrant C Data is divided into 100 sec bins |
 |
 |
| Module-wise count rates for Quadrant D Data is divided into 100 sec bins |
 |
 |
| Parameter | Plot |
|---|---|
| CZT HV Monitor | 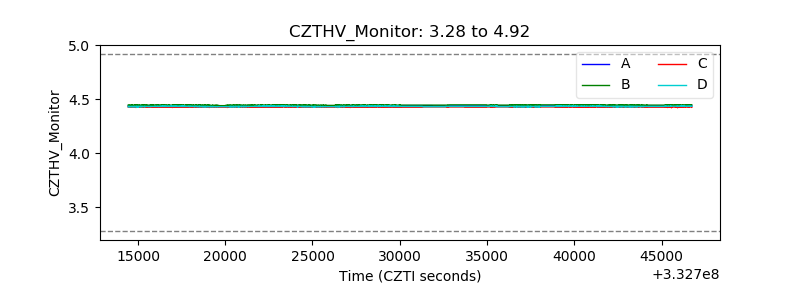 |
| D_VDD |  |
| Temperature 1 |  |
| Veto HV Monitor | 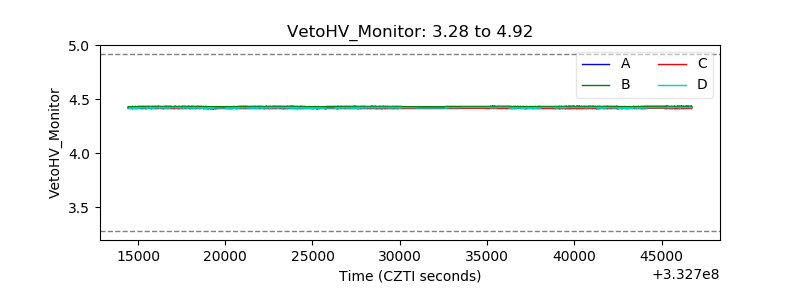 |
| Veto LLD |  |
| Alpha Counter | 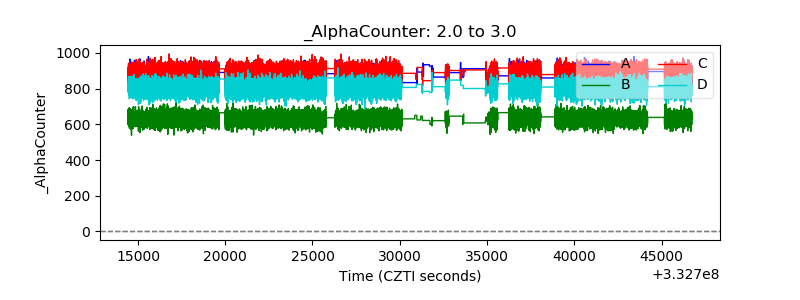 |
| _CPM_Rate | 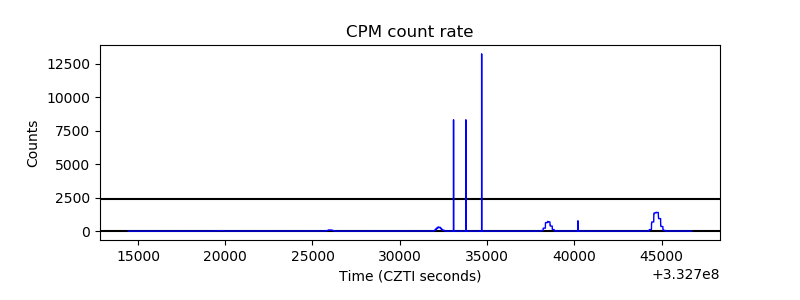 |
| CZT Counter | 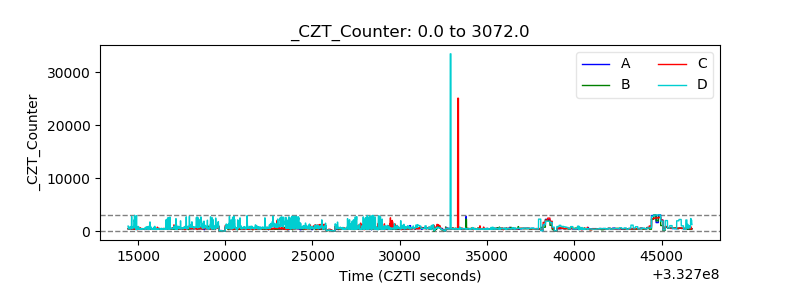 |
| +2.5 Volts monitor |  |
| +5 Volts monitor |  |
| _ROLL_ROT | 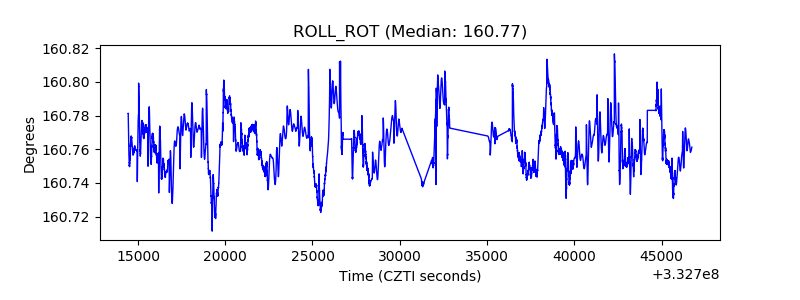 |
| _Roll_DEC | 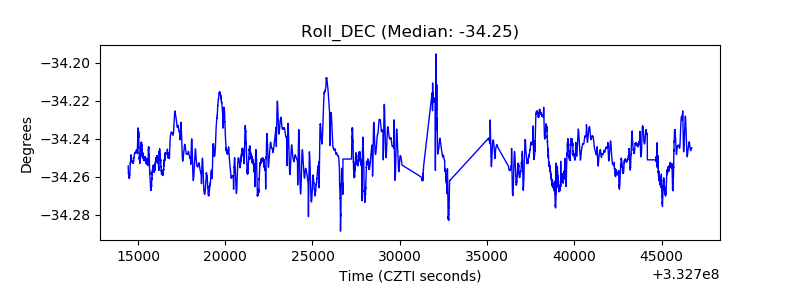 |
| _Roll_RA | 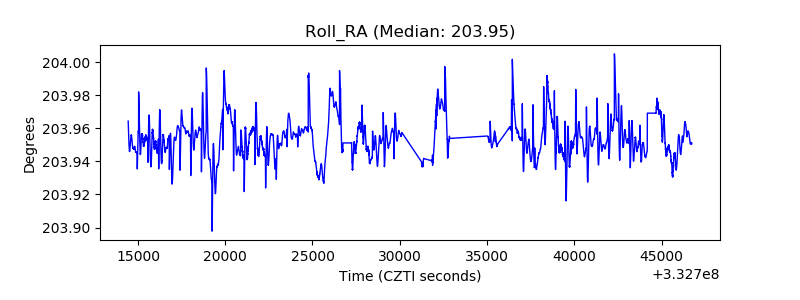 |
| Veto Counter | 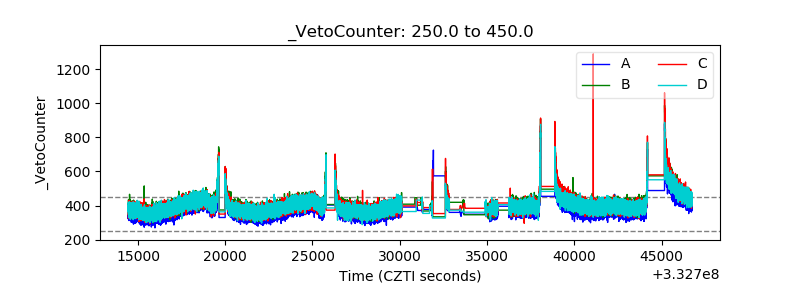 |