| Param | Original file | Final file |
|---|---|---|
| Filename | modeM0/AS1A07_068T01_9000003760_25979cztM0_level2.evt | modeM0/AS1A07_068T01_9000003760_25979cztM0_level2_quad_clean.evt |
| Size (bytes) | 528,773,760 | 87,269,760 |
| Size | 504.3 MB | 83.2 MB |
| Events in quadrant A | 3,345,458 | 562,351 |
| Events in quadrant B | 3,352,633 | 564,777 |
| Events in quadrant C | 3,736,707 | 534,278 |
| Events in quadrant D | 5,135,354 | 525,075 |
| Mode M0 | |||
|---|---|---|---|
| Quadrant | BADHDUFLAG | Total packets | Discarded packets |
| A | 0 | 13997 | 0 |
| B | 0 | 14018 | 0 |
| C | 0 | 15274 | 0 |
| D | 0 | 19617 | 0 |
| Mode M9 | |||
|---|---|---|---|
| Quadrant | BADHDUFLAG | Total packets | Discarded packets |
| A | 0 | 11 | 0 |
| B | 0 | 11 | 0 |
| C | 0 | 12 | 0 |
| D | 0 | 12 | 0 |
| Quadrant | Total seconds | Saturated seconds | Saturation percentage |
|---|---|---|---|
| A | 6538 | 87 | 1.330682% |
| B | 6538 | 108 | 1.651881% |
| C | 6538 | 167 | 2.554298% |
| D | 6537 | 558 | 8.536026% |
Noise dominated data is calculated using 1-second bins in cleaned event files. If a bin has >2000 counts, and if more than 50% of those come from <1% of pixels, then it is considered to be noise-dominated and hence unusable.
| Quadrant | # 1 sec bins | Bins with >0 counts | Bins with >2000 counts | High rate bins dominated by noise | Noise dominated (total time) | Noise dominated (detector-on time) | Marked lightcurve |
|---|---|---|---|---|---|---|---|
| A | 7628 | 6538 | 0 | 0 | 0.00% | 0.00% | 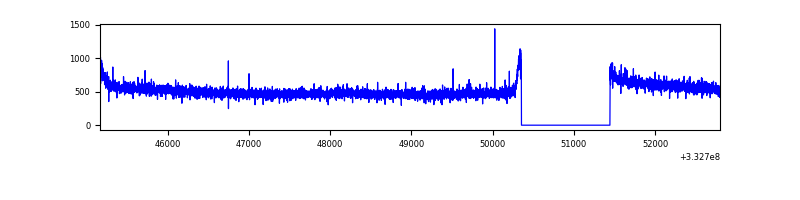 |
| B | 7628 | 6538 | 0 | 0 | 0.00% | 0.00% | 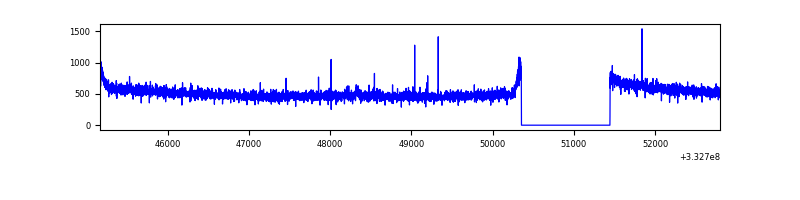 |
| C | 7628 | 6538 | 6 | 6 | 0.08% | 0.09% | 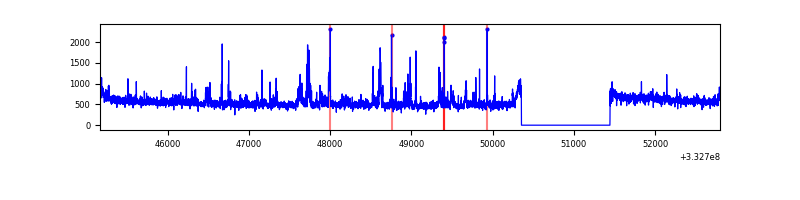 |
| D | 7627 | 6537 | 343 | 343 | 4.50% | 5.25% | 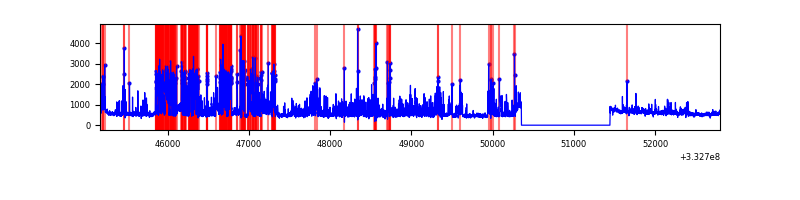 |
Top three noisy pixels from each quadrant. If the there are fewer than three noisy pixels in the level2.evt file, extra rows are filled as -1
| Pixel properties | Quadrant properties | ||||||
|---|---|---|---|---|---|---|---|
| Quadrant | DetID | PixID | Counts | Sigma | Mean | Median | Sigma |
| A | 13 | 254 | 10033 | 53.33 | 867 | 851 | 172.2 |
| A | 3 | 137 | 7679 | 39.66 | 867 | 851 | 172.2 |
| A | 0 | 226 | 7430 | 38.21 | 867 | 851 | 172.2 |
| B | 12 | 111 | 19774 | 117.81 | 852 | 834 | 160.8 |
| B | 11 | 111 | 17702 | 104.93 | 852 | 834 | 160.8 |
| B | 14 | 111 | 16521 | 97.58 | 852 | 834 | 160.8 |
| C | 3 | 233 | 360490 | 1896.44 | 823 | 830 | 189.6 |
| C | 14 | 238 | 133861 | 701.46 | 823 | 830 | 189.6 |
| C | 7 | 238 | 22908 | 116.41 | 823 | 830 | 189.6 |
| D | 1 | 52 | 1951915 | 10015.2 | 820 | 801 | 194.8 |
| D | 12 | 233 | 59842 | 303.06 | 820 | 801 | 194.8 |
| D | 2 | 234 | 21785 | 107.71 | 820 | 801 | 194.8 |
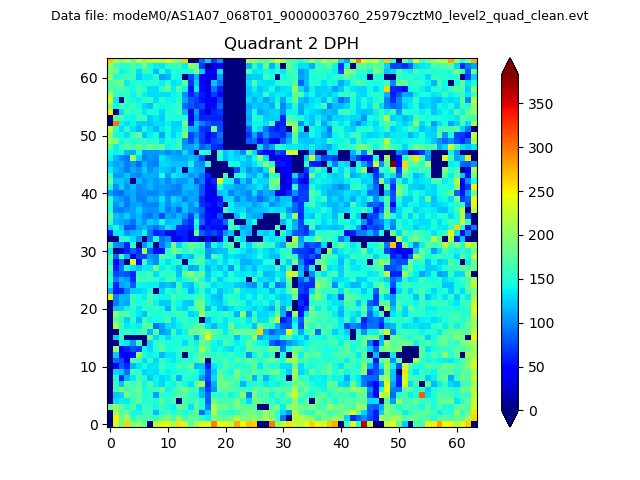
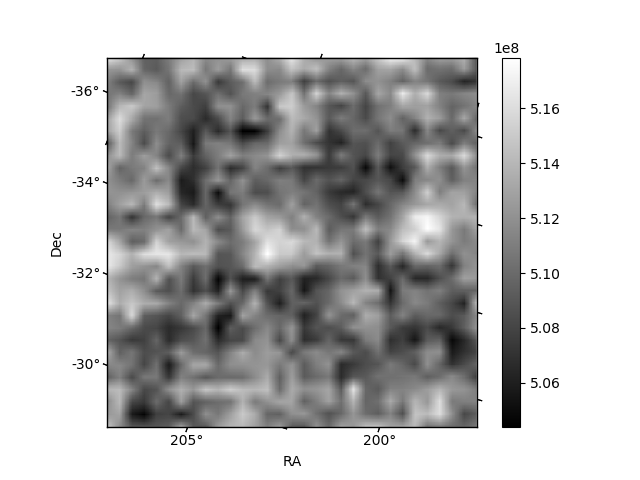
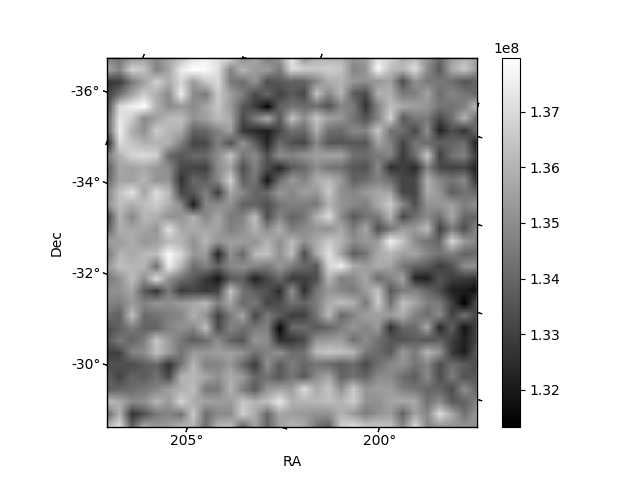
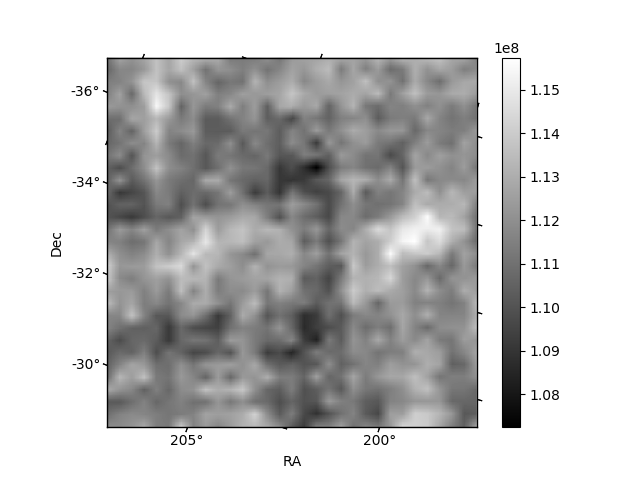
Histogram calculated using DETX and DETY for each event in the final _common_clean file
| Quadrant A | 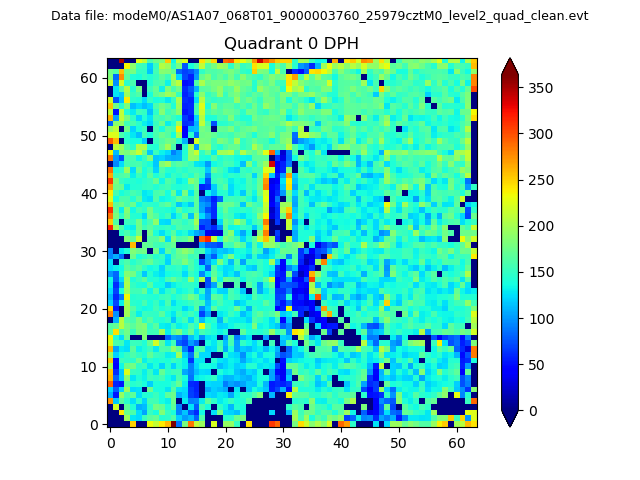 |
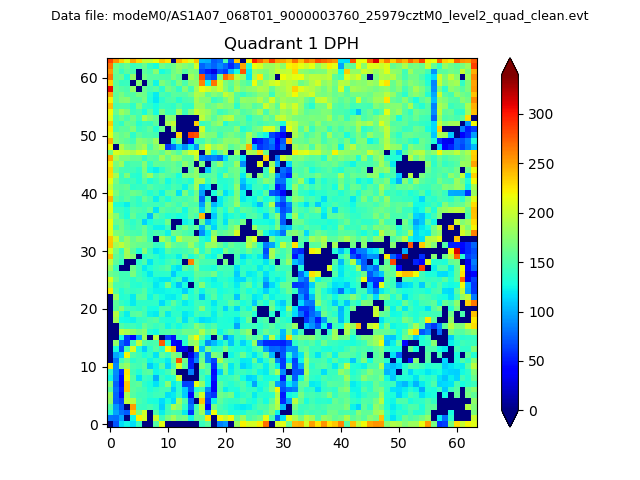 |
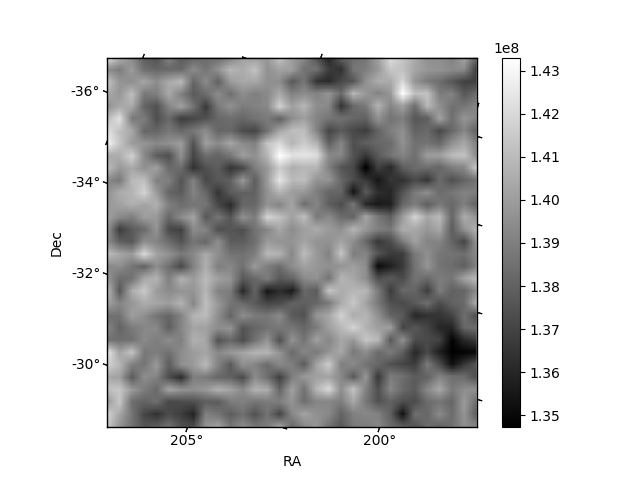
Quadrant B |
|---|---|---|---|
| Quadrant D | 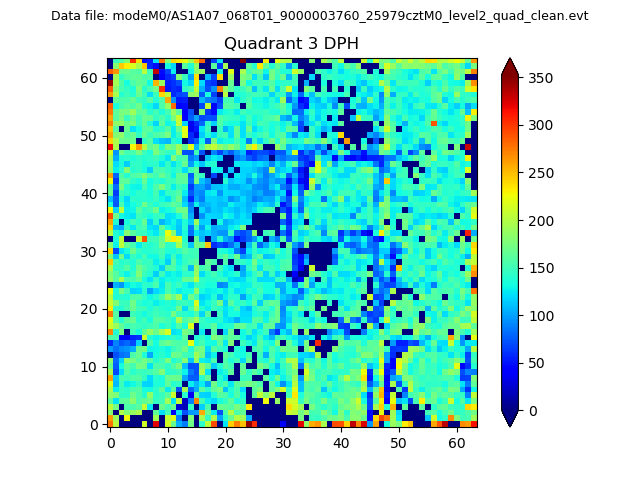 |
 |
Quadrant C |
| Plot type | Count rate plots | Images |
|---|---|---|
| Comparison with Poisson distribution Blue bars denote a histogram of data divided into 1 sec bins. Red curve is a Poisson curve with rate = median count rate of data. |
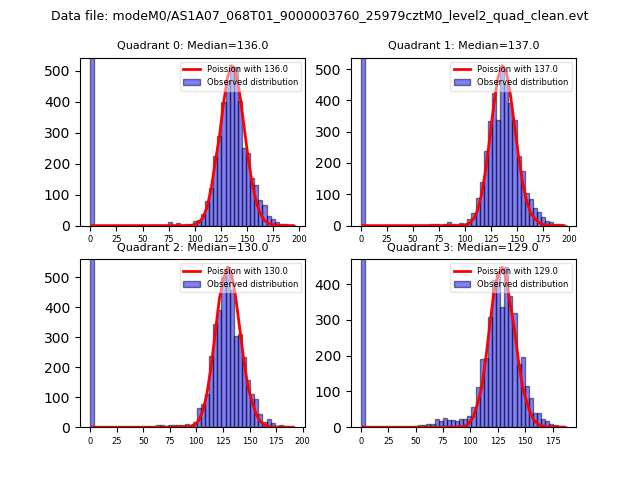 |
 |
| Quadrant-wise count rates Data is divided into 100 sec bins |
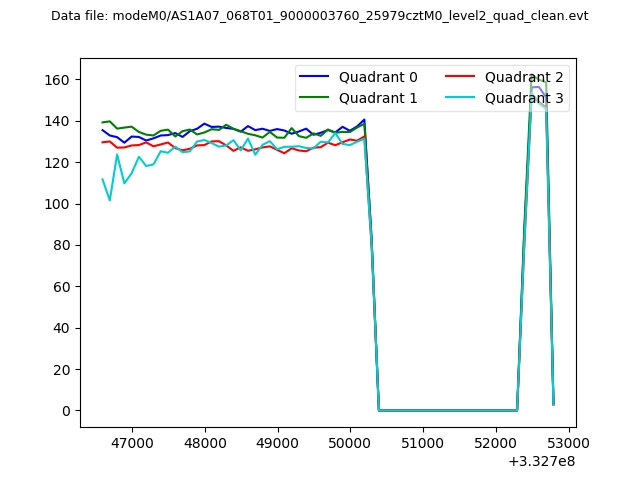 |
|
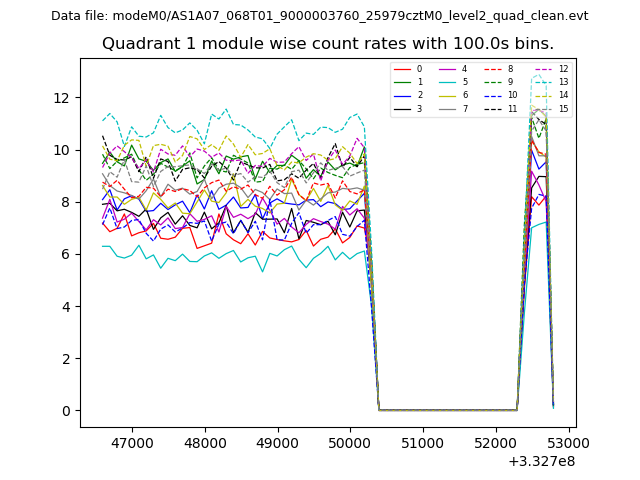
| Module-wise count rates for Quadrant A Data is divided into 100 sec bins |
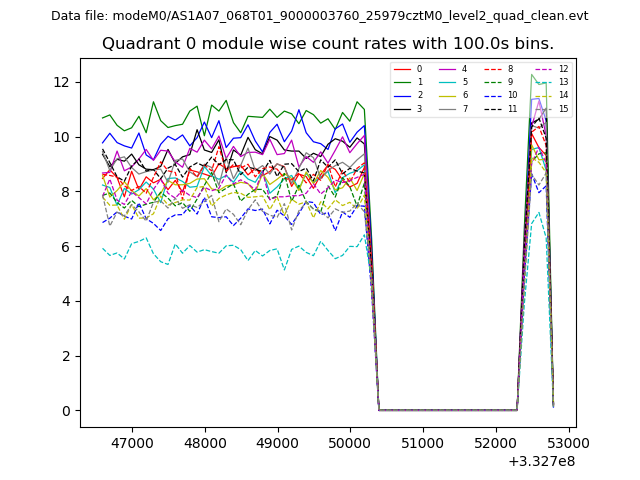 |
 |
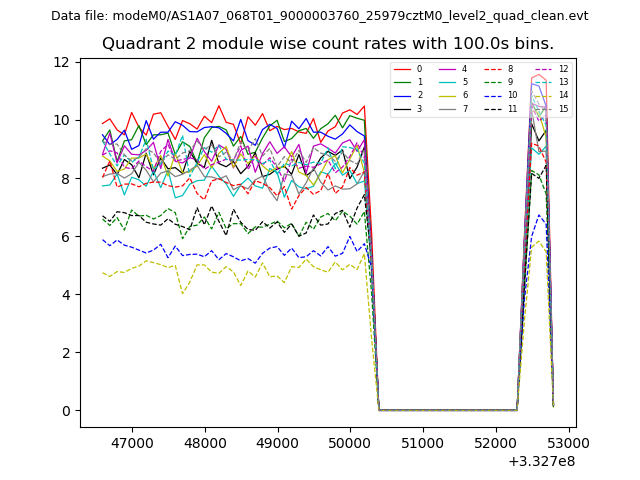
| Module-wise count rates for Quadrant B Data is divided into 100 sec bins |
 |
 |
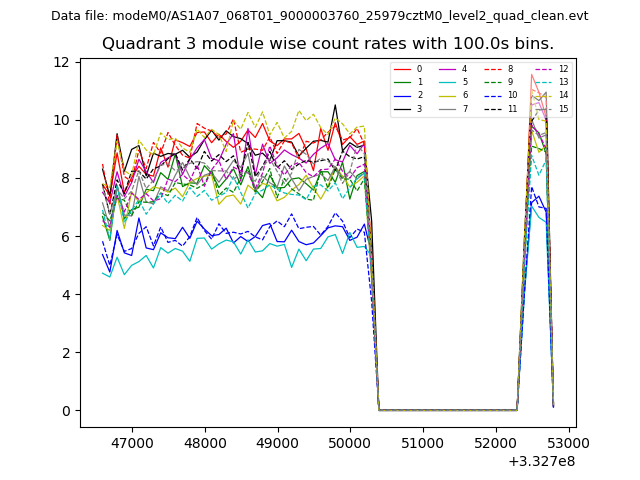
| Module-wise count rates for Quadrant C Data is divided into 100 sec bins |
 |
 |
| Module-wise count rates for Quadrant D Data is divided into 100 sec bins |
 |
 |
| Parameter | Plot |
|---|---|
| CZT HV Monitor |  |
| D_VDD | 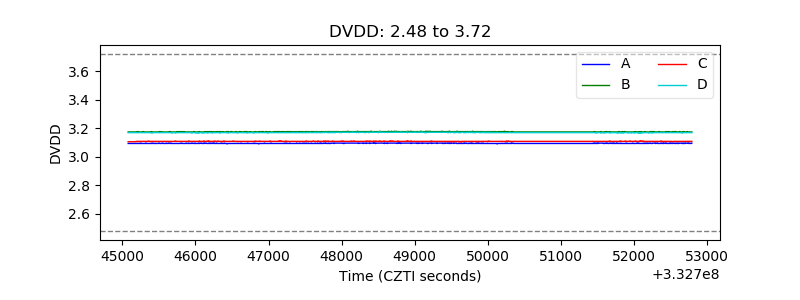 |
| Temperature 1 | 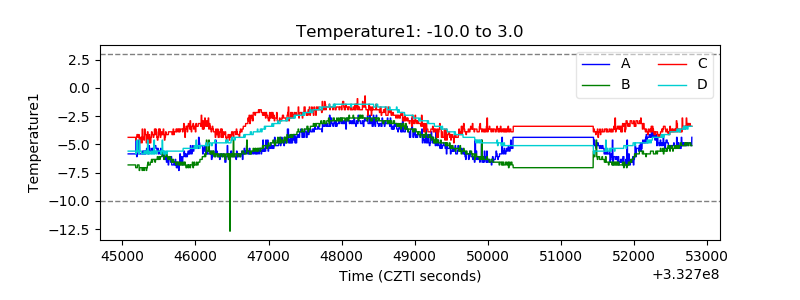 |
| Veto HV Monitor | 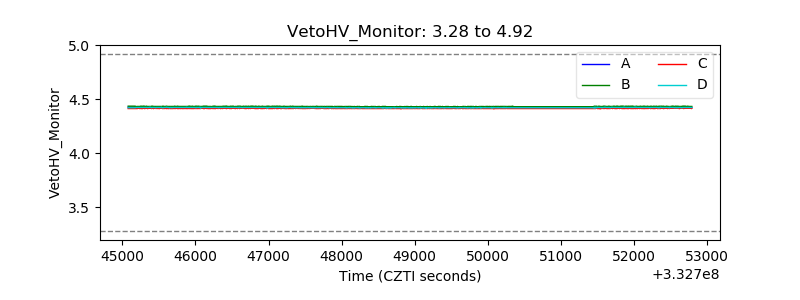 |
| Veto LLD | 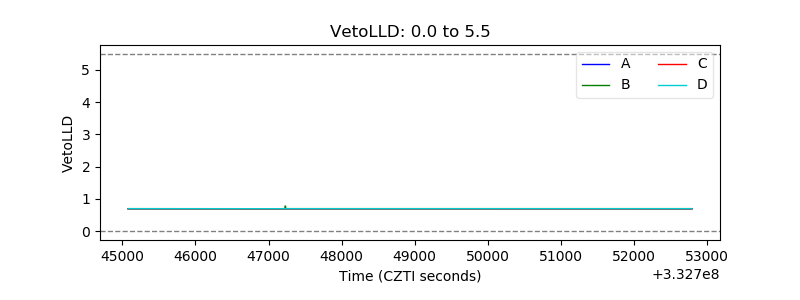 |
| Alpha Counter | 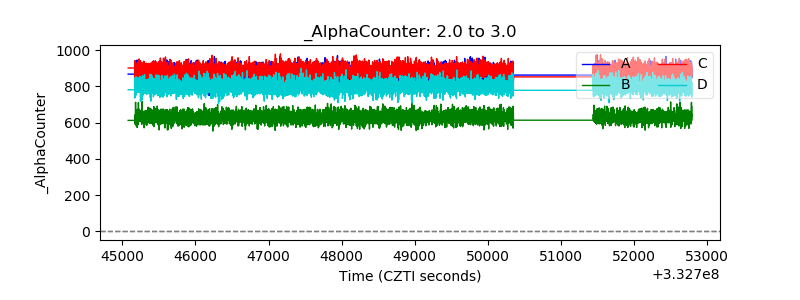 |
| _CPM_Rate | 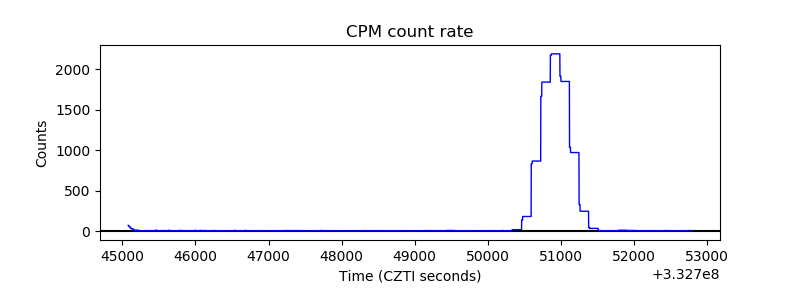 |
| CZT Counter | 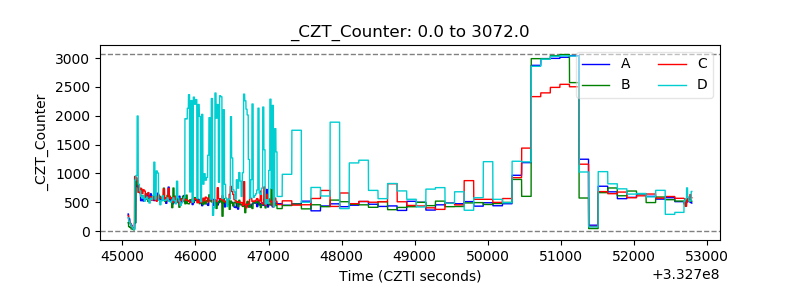 |
| +2.5 Volts monitor |  |
| +5 Volts monitor |  |
| _ROLL_ROT | 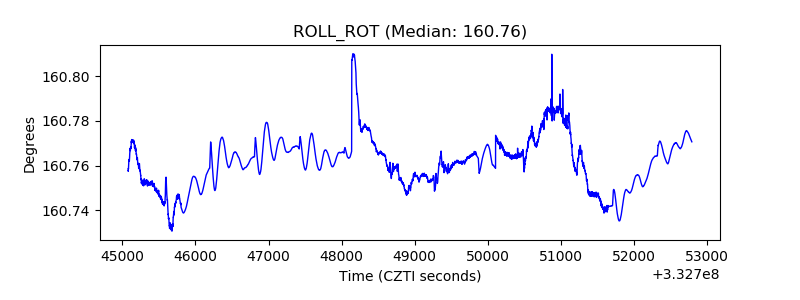 |
| _Roll_DEC | 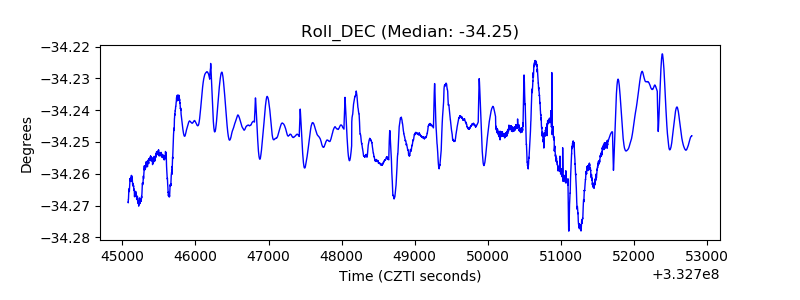 |
| _Roll_RA | 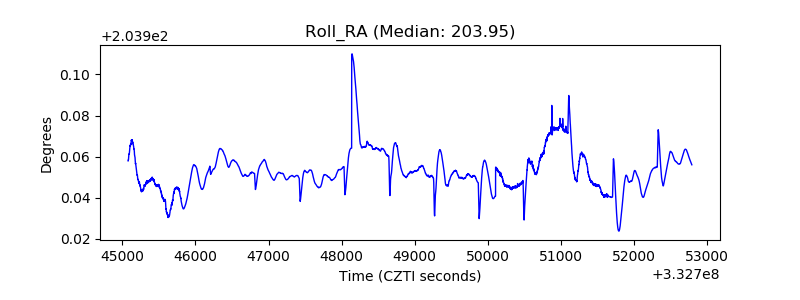 |
| Veto Counter | 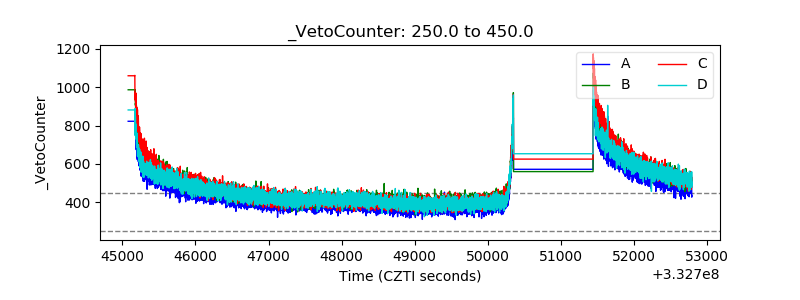 |