| Param | Original file | Final file |
|---|---|---|
| Filename | modeM0/AS1A07_068T01_9000003760_25980cztM0_level2.evt | modeM0/AS1A07_068T01_9000003760_25980cztM0_level2_quad_clean.evt |
| Size (bytes) | 422,683,200 | 83,082,240 |
| Size | 403.1 MB | 79.2 MB |
| Events in quadrant A | 2,557,932 | 559,213 |
| Events in quadrant B | 2,558,661 | 558,472 |
| Events in quadrant C | 2,740,178 | 530,023 |
| Events in quadrant D | 4,604,346 | 517,674 |
| Mode M0 | |||
|---|---|---|---|
| Quadrant | BADHDUFLAG | Total packets | Discarded packets |
| A | 0 | 10657 | 0 |
| B | 0 | 10724 | 0 |
| C | 0 | 11317 | 0 |
| D | 0 | 16958 | 0 |
| Mode M9 | |||
|---|---|---|---|
| Quadrant | BADHDUFLAG | Total packets | Discarded packets |
| A | 0 | 14 | 1 |
| B | 0 | 15 | 2 |
| C | 0 | 15 | 2 |
| D | 0 | 15 | 3 |
| Quadrant | Total seconds | Saturated seconds | Saturation percentage |
|---|---|---|---|
| A | 4915 | 47 | 0.956256% |
| B | 4948 | 63 | 1.273242% |
| C | 4943 | 110 | 2.225369% |
| D | 4933 | 527 | 10.683154% |
Noise dominated data is calculated using 1-second bins in cleaned event files. If a bin has >2000 counts, and if more than 50% of those come from <1% of pixels, then it is considered to be noise-dominated and hence unusable.
| Quadrant | # 1 sec bins | Bins with >0 counts | Bins with >2000 counts | High rate bins dominated by noise | Noise dominated (total time) | Noise dominated (detector-on time) | Marked lightcurve |
|---|---|---|---|---|---|---|---|
| A | 7533 | 5076 | 0 | 0 | 0.00% | 0.00% | 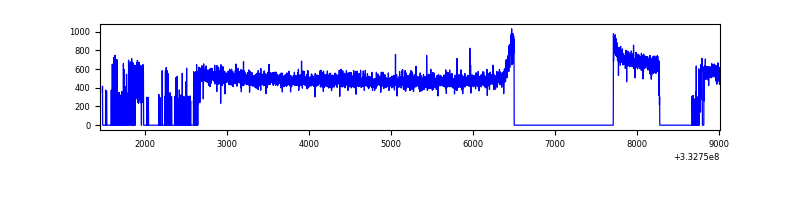 |
| B | 7478 | 5123 | 0 | 0 | 0.00% | 0.00% | 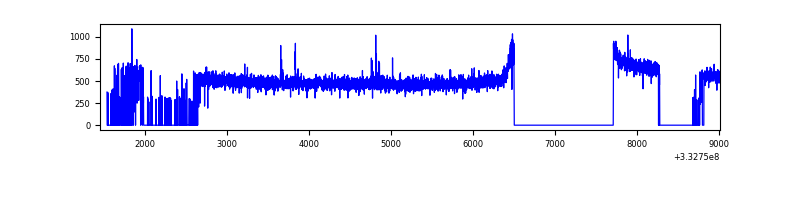 |
| C | 7563 | 5108 | 0 | 0 | 0.00% | 0.00% | 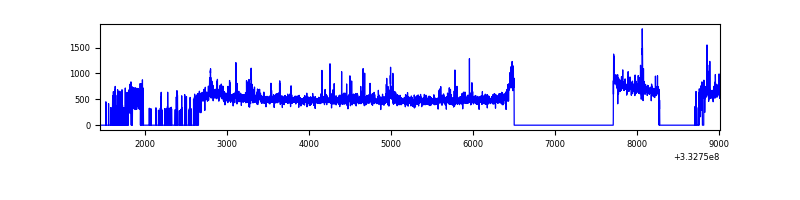 |
| D | 7541 | 5114 | 303 | 303 | 4.02% | 5.92% | 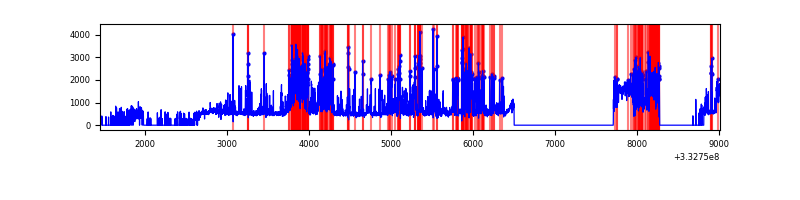 |
Top three noisy pixels from each quadrant. If the there are fewer than three noisy pixels in the level2.evt file, extra rows are filled as -1
| Pixel properties | Quadrant properties | ||||||
|---|---|---|---|---|---|---|---|
| Quadrant | DetID | PixID | Counts | Sigma | Mean | Median | Sigma |
| A | 13 | 254 | 7017 | 47.36 | 663 | 651 | 134.4 |
| A | 0 | 226 | 5707 | 37.61 | 663 | 651 | 134.4 |
| A | 3 | 137 | 5635 | 37.08 | 663 | 651 | 134.4 |
| B | 12 | 111 | 14693 | 114.32 | 651 | 637 | 123.0 |
| B | 11 | 111 | 13443 | 104.15 | 651 | 637 | 123.0 |
| B | 14 | 111 | 12329 | 95.09 | 651 | 637 | 123.0 |
| C | 3 | 233 | 170838 | 1168.43 | 630 | 634 | 145.7 |
| C | 14 | 238 | 101960 | 695.59 | 630 | 634 | 145.7 |
| C | 0 | 207 | 11590 | 75.21 | 630 | 634 | 145.7 |
| D | 1 | 52 | 1714965 | 11535.79 | 627 | 612 | 148.6 |
| D | 12 | 233 | 513737 | 3452.79 | 627 | 612 | 148.6 |
| D | 2 | 234 | 16341 | 105.84 | 627 | 612 | 148.6 |
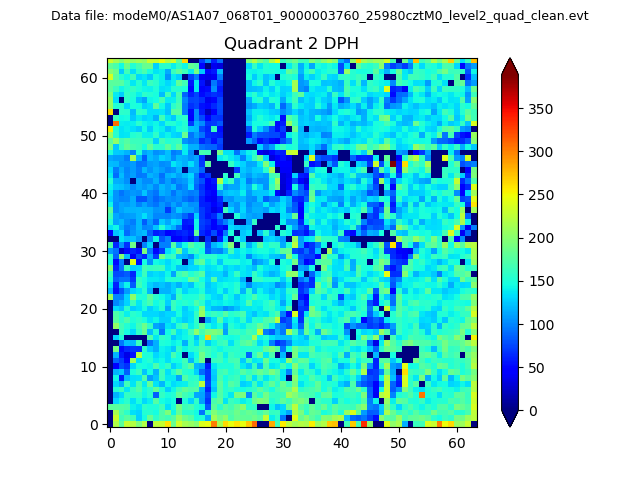
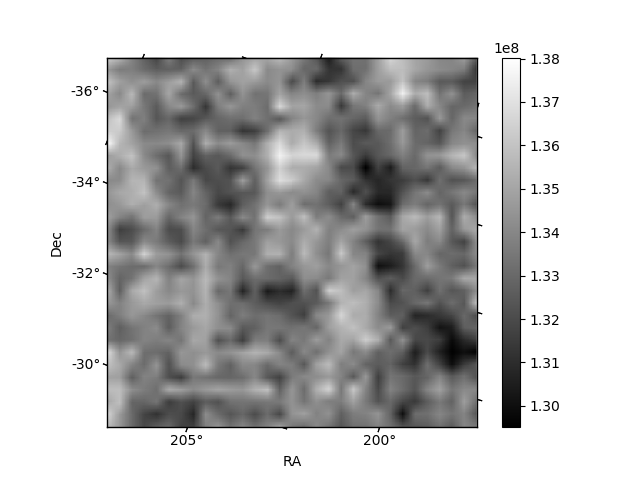
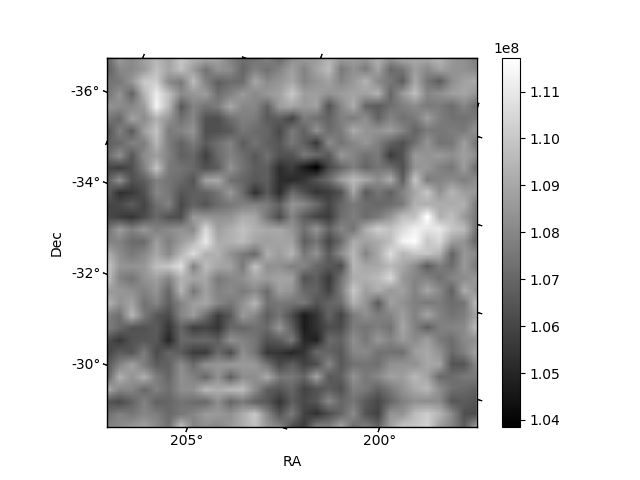
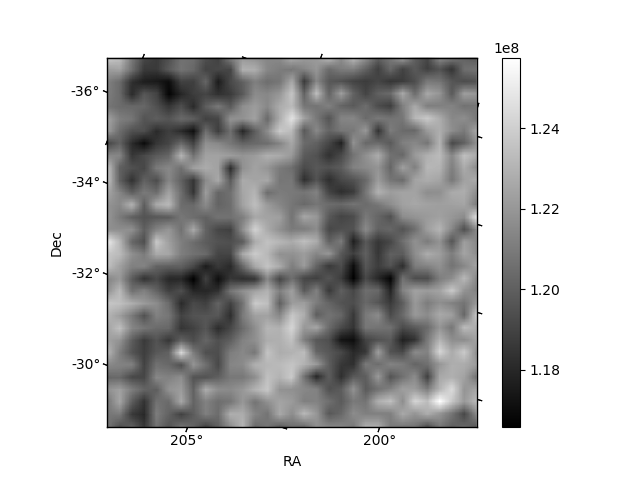
Histogram calculated using DETX and DETY for each event in the final _common_clean file
| Quadrant A | 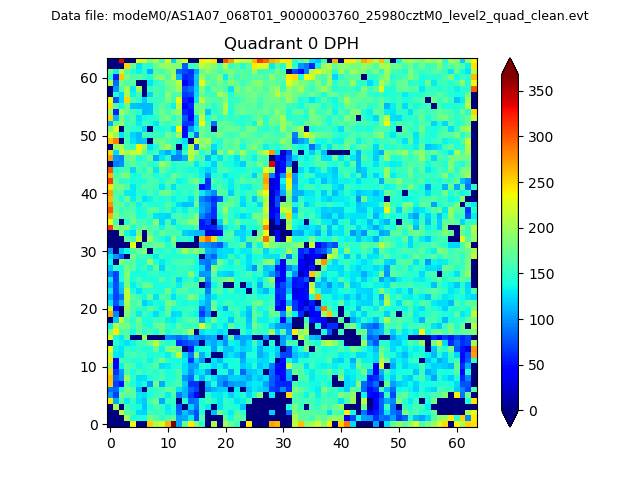 |
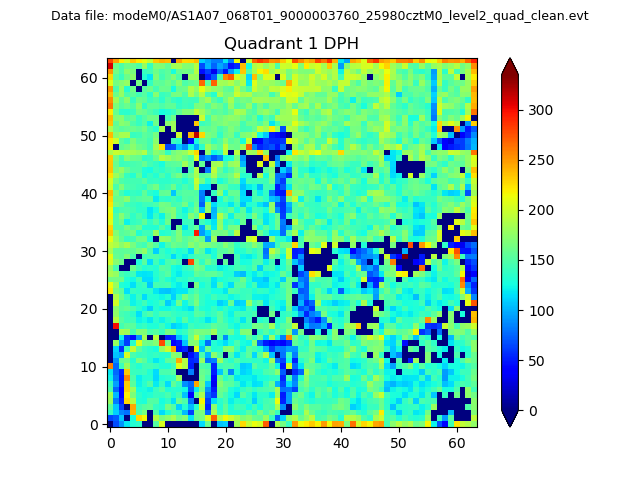 |
Quadrant B |
|---|---|---|---|
| Quadrant D | 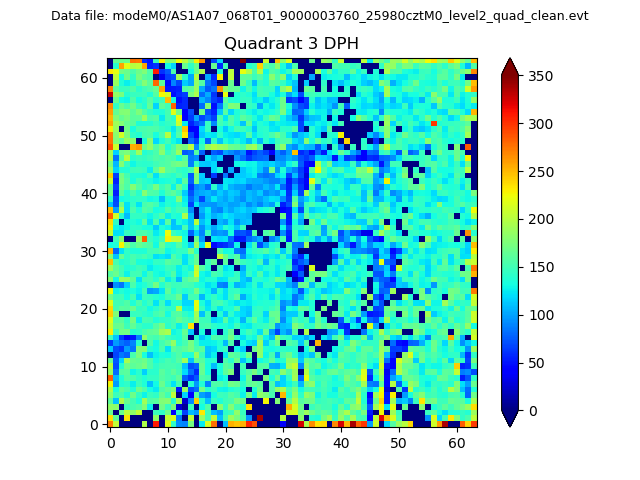 |
 |
Quadrant C |
| Plot type | Count rate plots | Images |
|---|---|---|
| Comparison with Poisson distribution Blue bars denote a histogram of data divided into 1 sec bins. Red curve is a Poisson curve with rate = median count rate of data. |
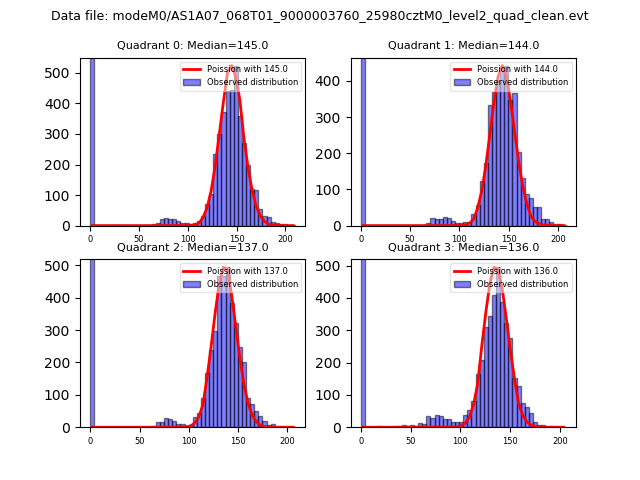 |
 |
| Quadrant-wise count rates Data is divided into 100 sec bins |
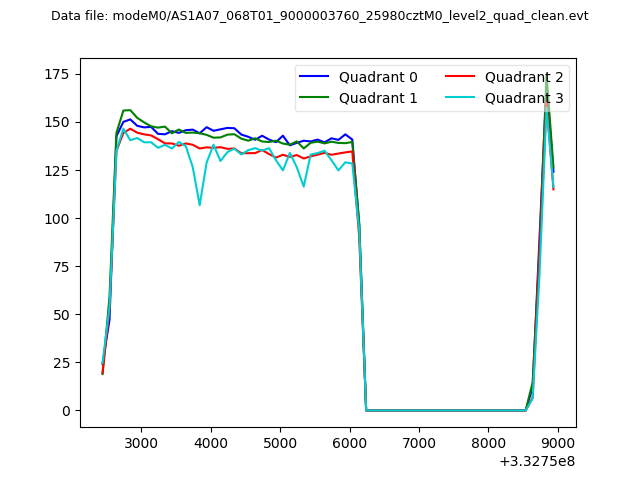 |
|
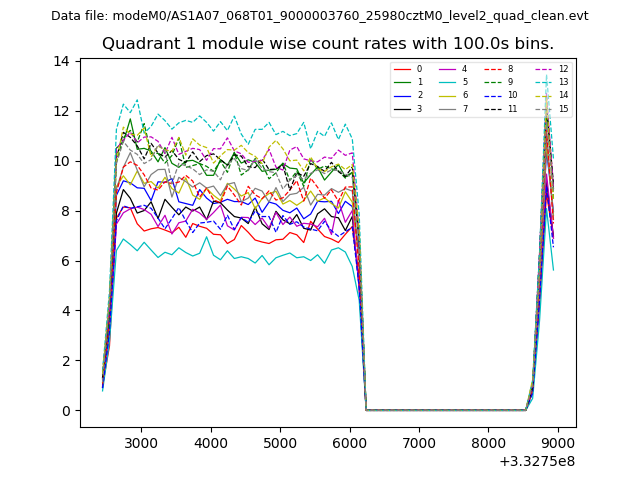
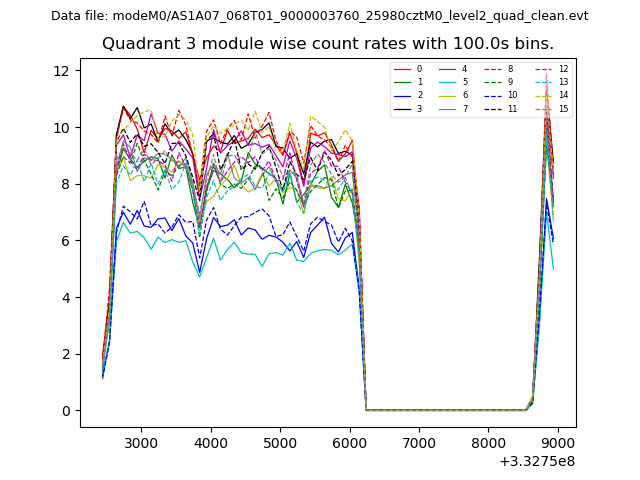
| Module-wise count rates for Quadrant A Data is divided into 100 sec bins |
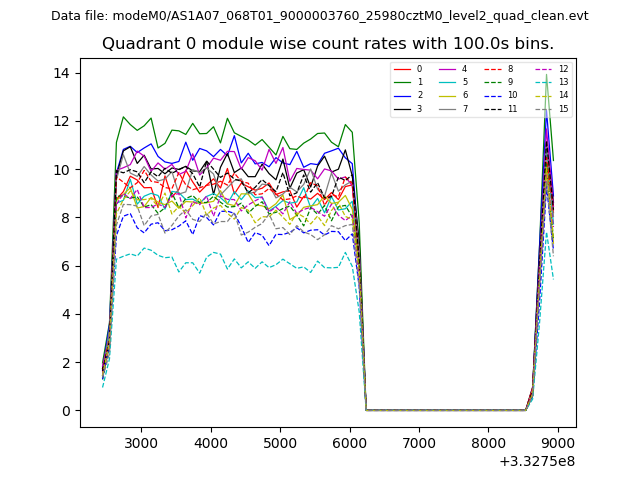 |
 |
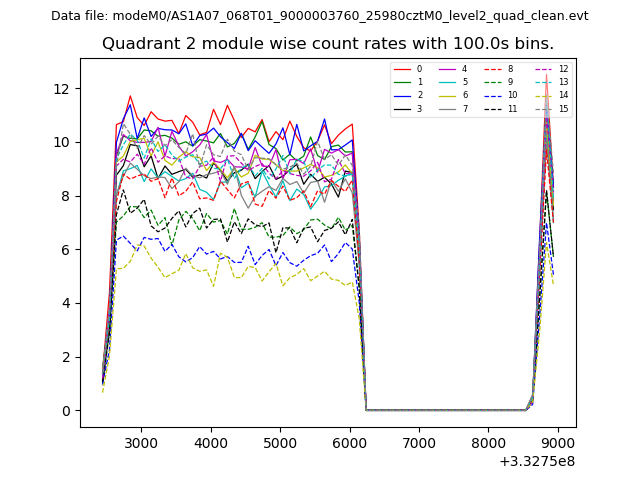
| Module-wise count rates for Quadrant B Data is divided into 100 sec bins |
 |
 |
| Module-wise count rates for Quadrant C Data is divided into 100 sec bins |
 |
 |
| Module-wise count rates for Quadrant D Data is divided into 100 sec bins |
 |
 |
| Parameter | Plot |
|---|---|
| CZT HV Monitor | 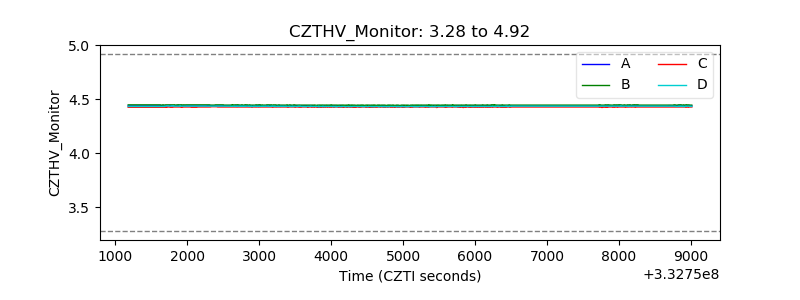 |
| D_VDD |  |
| Temperature 1 | 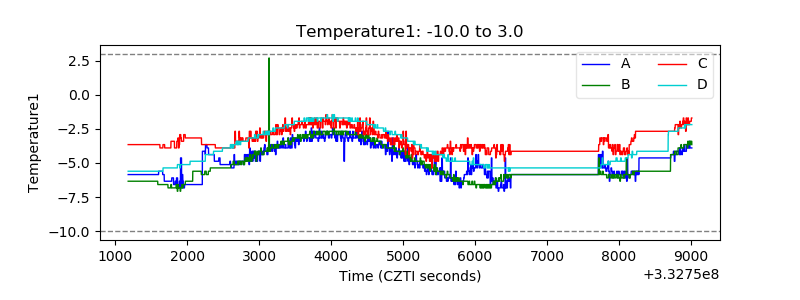 |
| Veto HV Monitor | 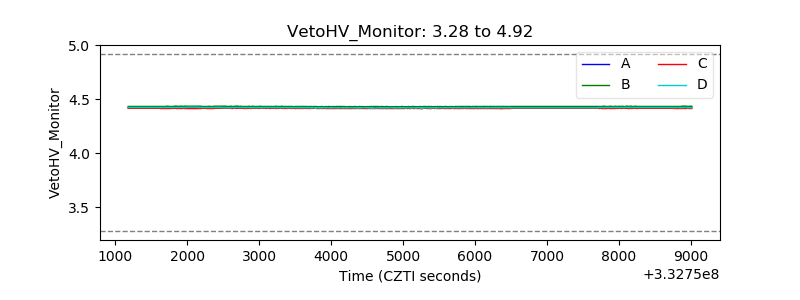 |
| Veto LLD | 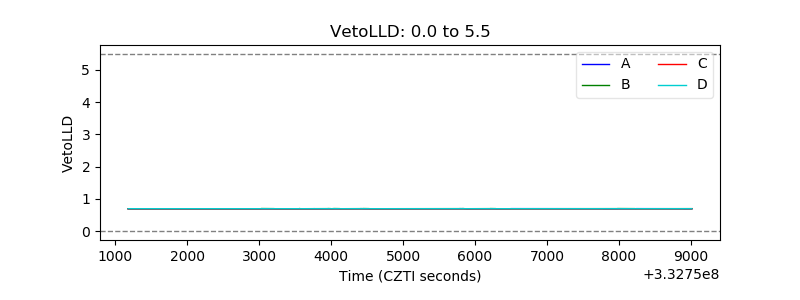 |
| Alpha Counter | 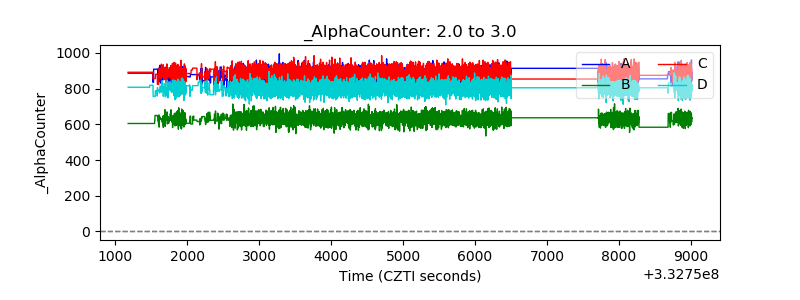 |
| _CPM_Rate | 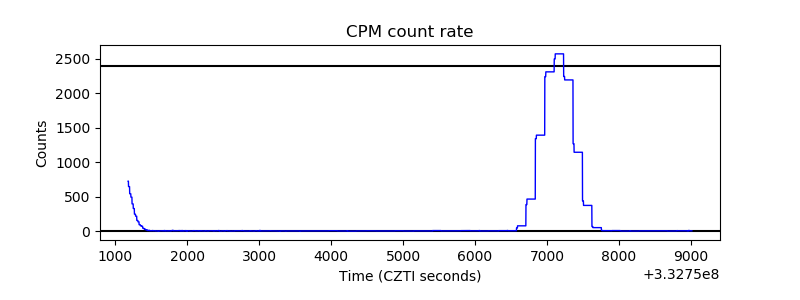 |
| CZT Counter | 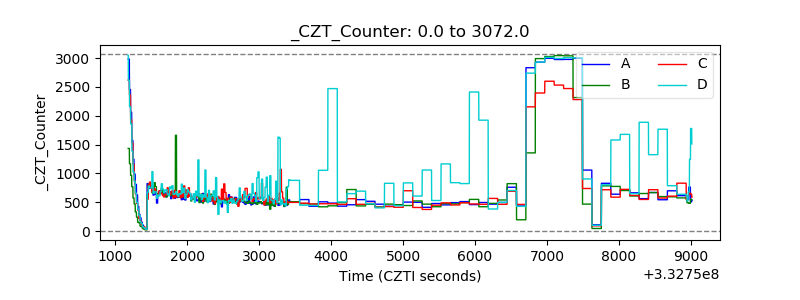 |
| +2.5 Volts monitor |  |
| +5 Volts monitor |  |
| _ROLL_ROT | 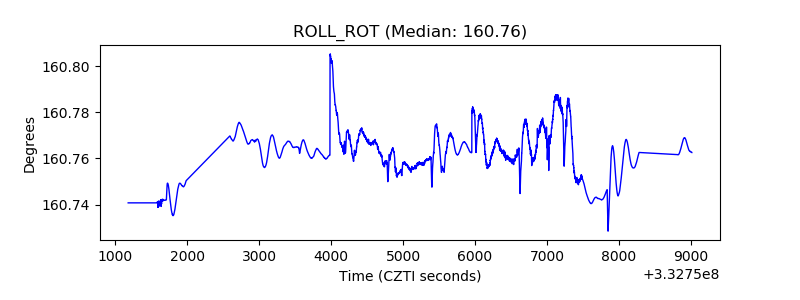 |
| _Roll_DEC | 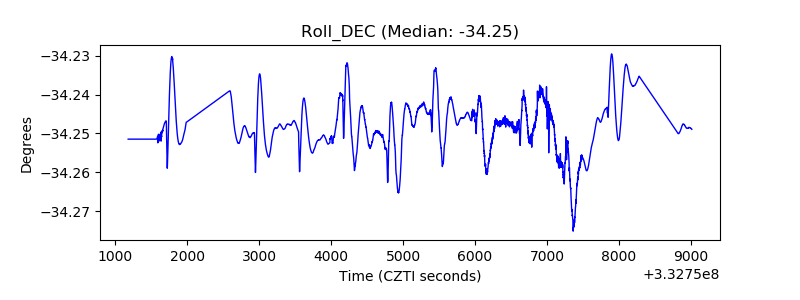 |
| _Roll_RA |  |
| Veto Counter | 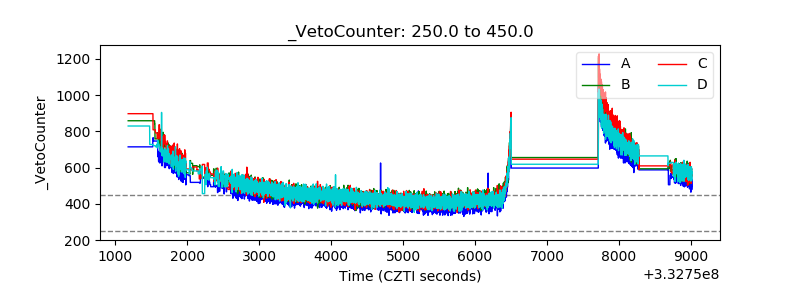 |