| Param | Original file | Final file |
|---|---|---|
| Filename | modeM0/AS1A07_068T01_9000003760_25982cztM0_level2.evt | modeM0/AS1A07_068T01_9000003760_25982cztM0_level2_quad_clean.evt |
| Size (bytes) | 1,787,791,680 | 373,832,640 |
| Size | 1.7 GB | 356.5 MB |
| Events in quadrant A | 10,919,806 | 2,576,197 |
| Events in quadrant B | 10,852,013 | 2,553,450 |
| Events in quadrant C | 11,694,880 | 2,417,846 |
| Events in quadrant D | 19,281,589 | 2,349,899 |
| Mode M0 | |||
|---|---|---|---|
| Quadrant | BADHDUFLAG | Total packets | Discarded packets |
| A | 0 | 45480 | 0 |
| B | 0 | 45307 | 0 |
| C | 0 | 48142 | 0 |
| D | 0 | 71326 | 0 |
| Mode M9 | |||
|---|---|---|---|
| Quadrant | BADHDUFLAG | Total packets | Discarded packets |
| A | 0 | 49 | 0 |
| B | 0 | 49 | 0 |
| C | 0 | 49 | 0 |
| D | 0 | 49 | 0 |
| Quadrant | Total seconds | Saturated seconds | Saturation percentage |
|---|---|---|---|
| A | 20713 | 281 | 1.356636% |
| B | 20714 | 336 | 1.622091% |
| C | 20713 | 493 | 2.380148% |
| D | 20714 | 1957 | 9.447717% |
Noise dominated data is calculated using 1-second bins in cleaned event files. If a bin has >2000 counts, and if more than 50% of those come from <1% of pixels, then it is considered to be noise-dominated and hence unusable.
| Quadrant | # 1 sec bins | Bins with >0 counts | Bins with >2000 counts | High rate bins dominated by noise | Noise dominated (total time) | Noise dominated (detector-on time) | Marked lightcurve |
|---|---|---|---|---|---|---|---|
| A | 25613 | 20714 | 0 | 0 | 0.00% | 0.00% | 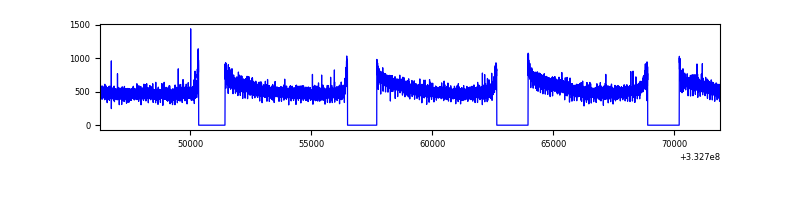 |
| B | 25614 | 20716 | 9 | 9 | 0.04% | 0.04% | 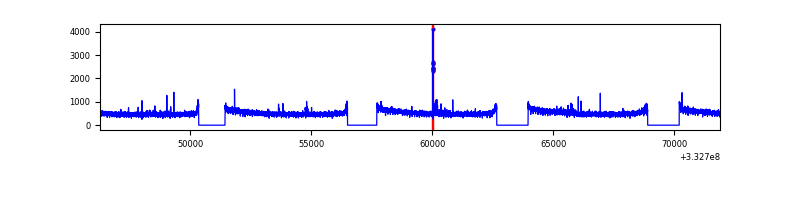 |
| C | 25614 | 20716 | 15 | 15 | 0.06% | 0.07% | 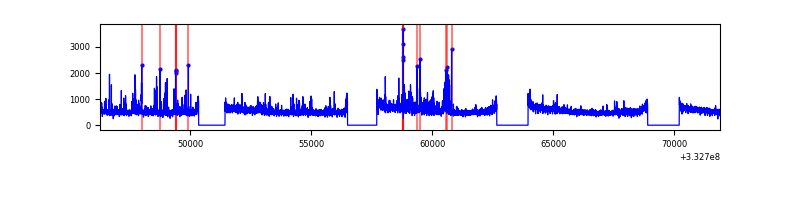 |
| D | 25614 | 20716 | 1436 | 1436 | 5.61% | 6.93% | 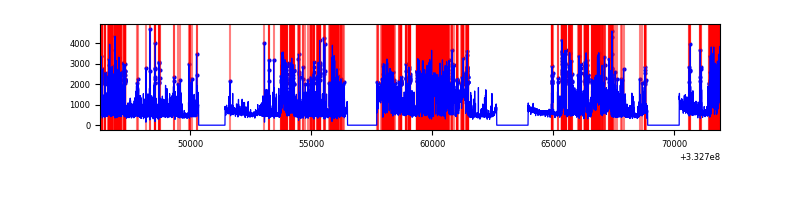 |
Top three noisy pixels from each quadrant. If the there are fewer than three noisy pixels in the level2.evt file, extra rows are filled as -1
| Pixel properties | Quadrant properties | ||||||
|---|---|---|---|---|---|---|---|
| Quadrant | DetID | PixID | Counts | Sigma | Mean | Median | Sigma |
| A | 10 | 229 | 32428 | 53.25 | 2827 | 2780 | 556.7 |
| A | 13 | 254 | 30102 | 49.07 | 2827 | 2780 | 556.7 |
| A | 0 | 226 | 24354 | 38.75 | 2827 | 2780 | 556.7 |
| B | 0 | 190 | 97344 | 185.17 | 2745 | 2691 | 511.2 |
| B | 12 | 111 | 61448 | 114.95 | 2745 | 2691 | 511.2 |
| B | 11 | 111 | 56004 | 104.3 | 2745 | 2691 | 511.2 |
| C | 3 | 233 | 844341 | 1398.8 | 2645 | 2664 | 601.7 |
| C | 14 | 238 | 433945 | 716.75 | 2645 | 2664 | 601.7 |
| C | 0 | 207 | 84146 | 135.42 | 2645 | 2664 | 601.7 |
| D | 1 | 52 | 7401673 | 11803.48 | 2666 | 2610 | 626.9 |
| D | 12 | 233 | 1761781 | 2806.35 | 2666 | 2610 | 626.9 |
| D | 2 | 234 | 71257 | 109.51 | 2666 | 2610 | 626.9 |
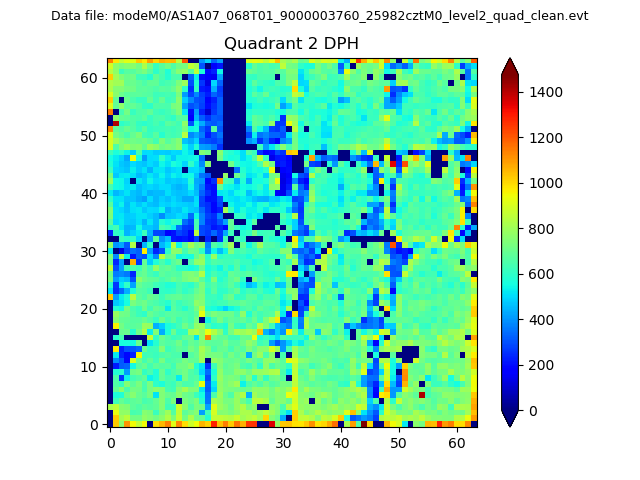
Histogram calculated using DETX and DETY for each event in the final _common_clean file
| Quadrant A | 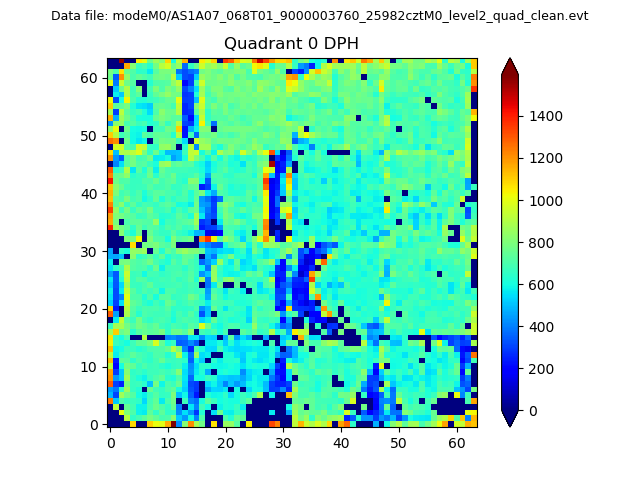 |
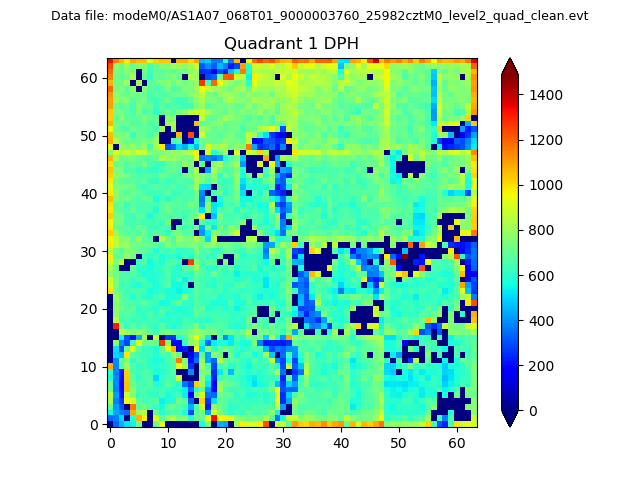 |
Quadrant B |
|---|---|---|---|
| Quadrant D | 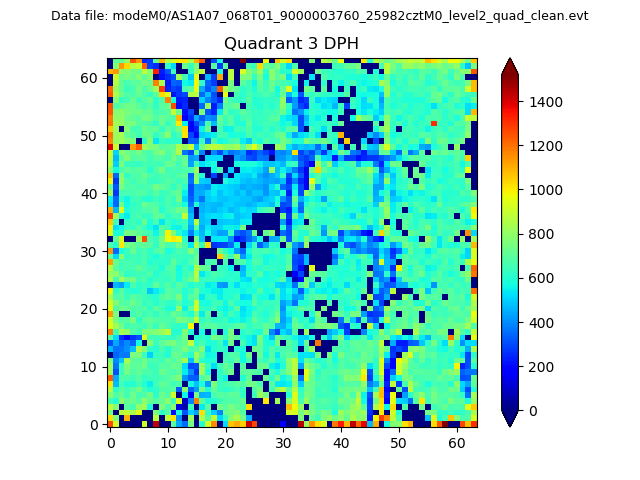 |
 |
Quadrant C |
| Plot type | Count rate plots | Images |
|---|---|---|
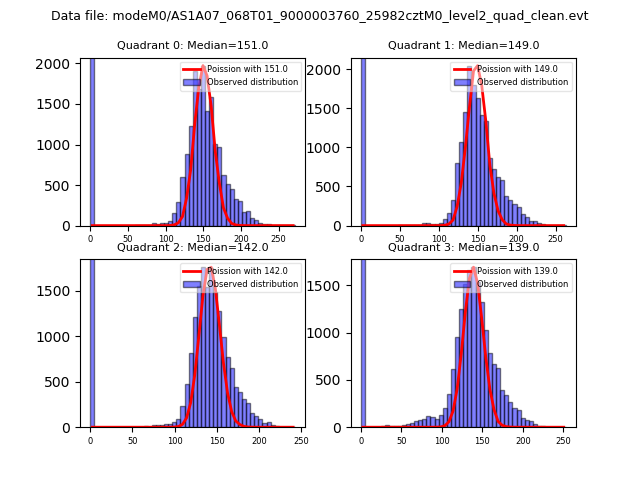
| Comparison with Poisson distribution Blue bars denote a histogram of data divided into 1 sec bins. Red curve is a Poisson curve with rate = median count rate of data. |
 |
 |
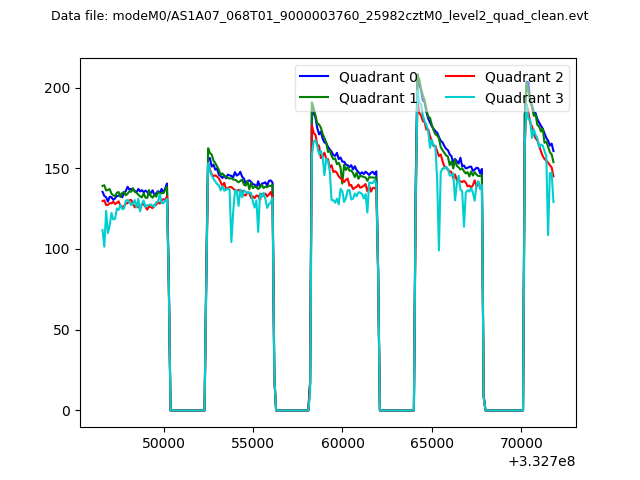
| Quadrant-wise count rates Data is divided into 100 sec bins |
 |
|
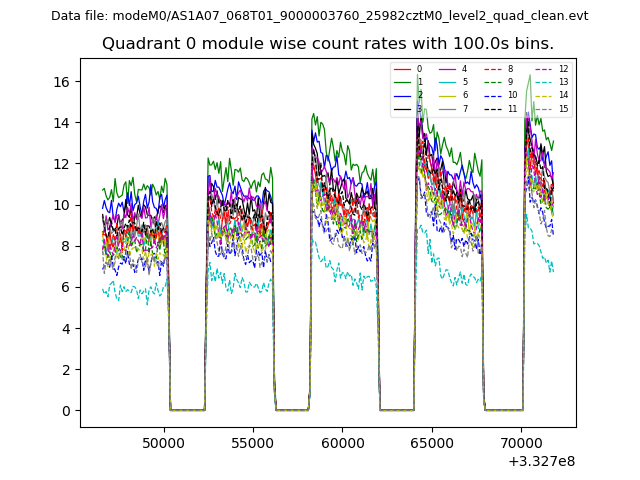
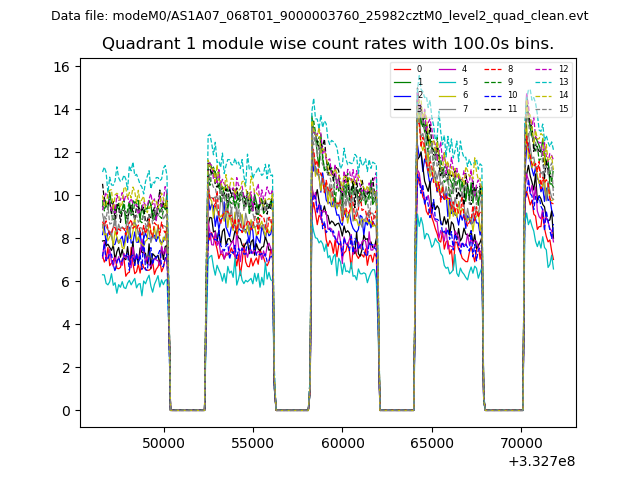
| Module-wise count rates for Quadrant A Data is divided into 100 sec bins |
 |
 |
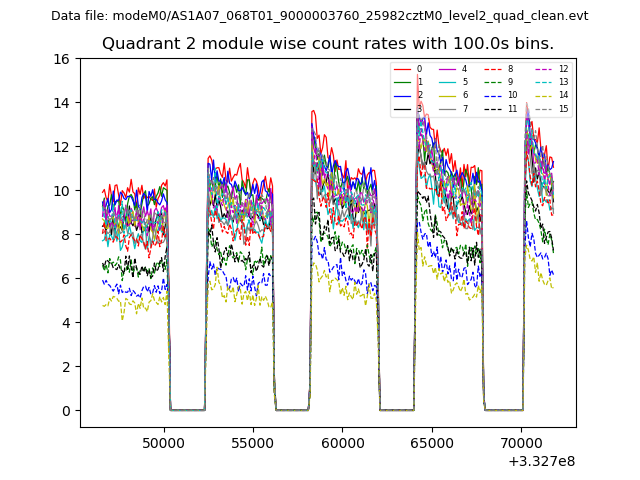
| Module-wise count rates for Quadrant B Data is divided into 100 sec bins |
 |
 |
| Module-wise count rates for Quadrant C Data is divided into 100 sec bins |
 |
 |
| Module-wise count rates for Quadrant D Data is divided into 100 sec bins |
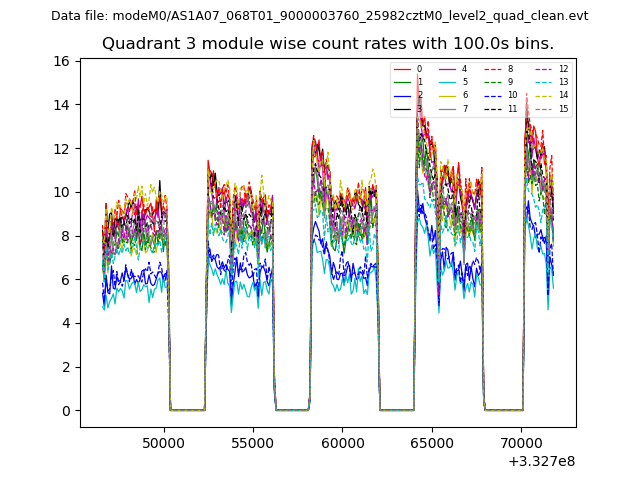 |
 |
| Parameter | Plot |
|---|---|
| CZT HV Monitor | 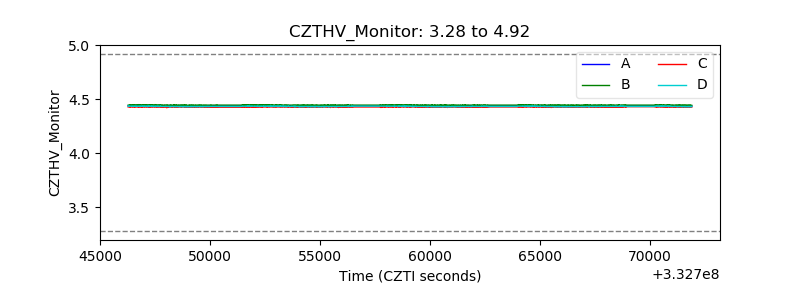 |
| D_VDD | 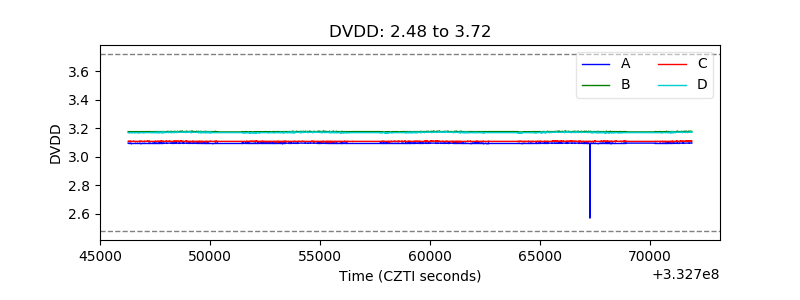 |
| Temperature 1 | 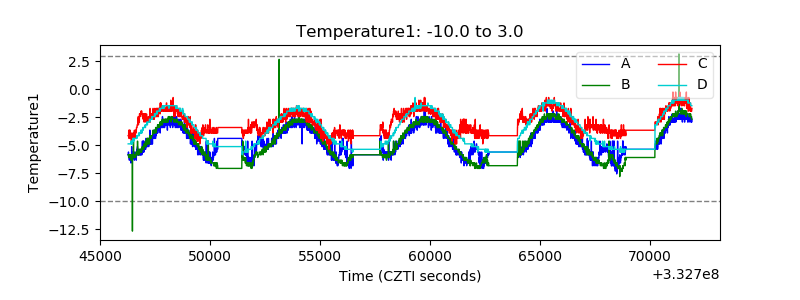 |
| Veto HV Monitor | 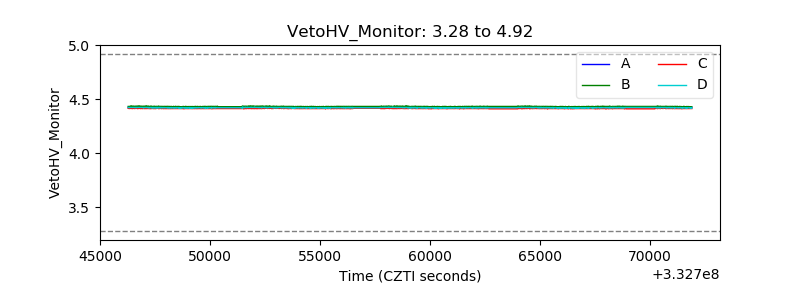 |
| Veto LLD | 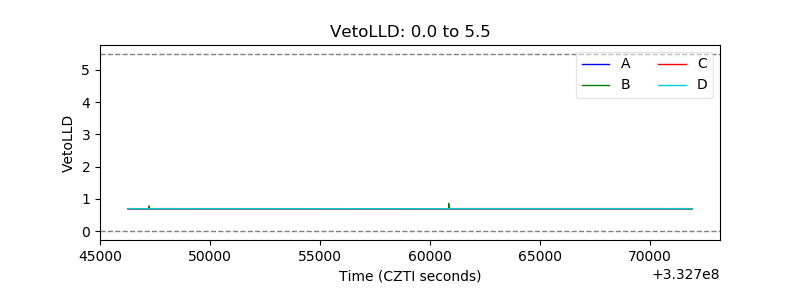 |
| Alpha Counter | 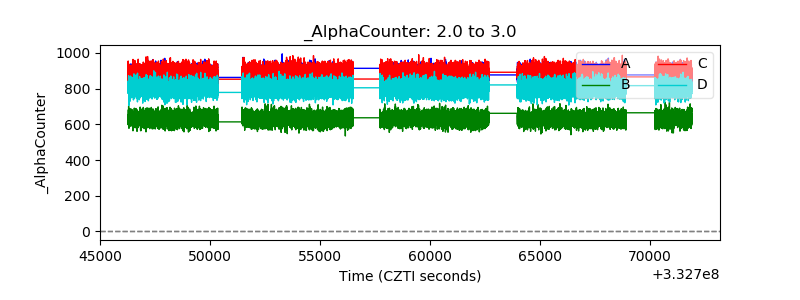 |
| _CPM_Rate | 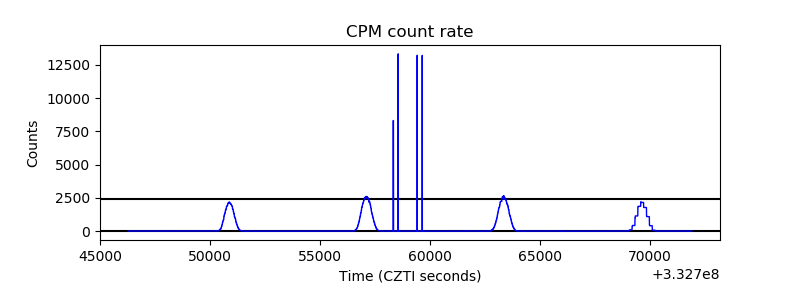 |
| CZT Counter | 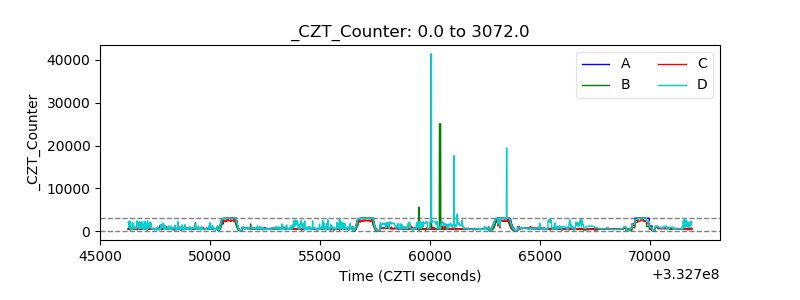 |
| +2.5 Volts monitor |  |
| +5 Volts monitor |  |
| _ROLL_ROT | 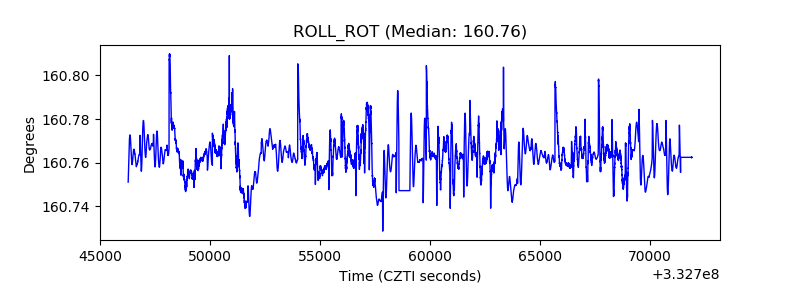 |
| _Roll_DEC | 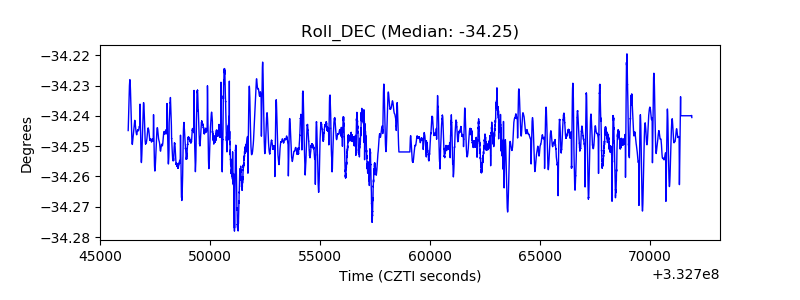 |
| _Roll_RA | 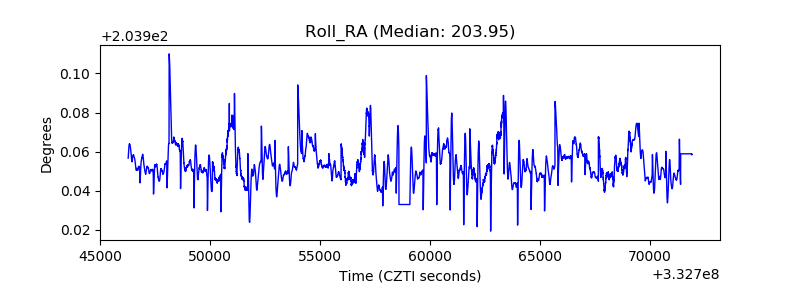 |
| Veto Counter | 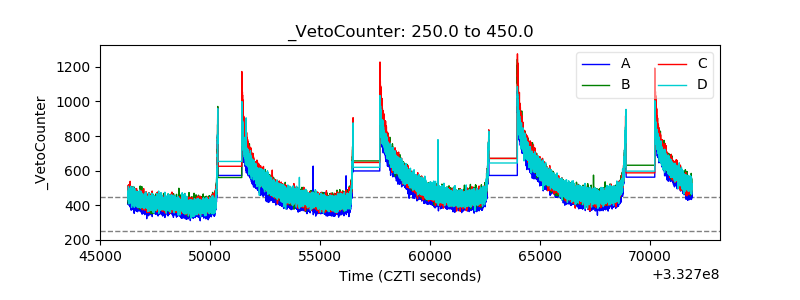 |