| Param | Original file | Final file |
|---|---|---|
| Filename | modeM0/AS1A07_068T01_9000003760_25983cztM0_level2.evt | modeM0/AS1A07_068T01_9000003760_25983cztM0_level2_quad_clean.evt |
| Size (bytes) | 502,848,000 | 107,006,400 |
| Size | 479.6 MB | 102.0 MB |
| Events in quadrant A | 3,170,841 | 739,984 |
| Events in quadrant B | 3,172,325 | 726,616 |
| Events in quadrant C | 3,126,542 | 681,945 |
| Events in quadrant D | 5,349,537 | 670,478 |
| Mode M0 | |||
|---|---|---|---|
| Quadrant | BADHDUFLAG | Total packets | Discarded packets |
| A | 0 | 13071 | 0 |
| B | 0 | 13108 | 0 |
| C | 0 | 13040 | 0 |
| D | 0 | 19981 | 0 |
| Mode M9 | |||
|---|---|---|---|
| Quadrant | BADHDUFLAG | Total packets | Discarded packets |
| A | 0 | 12 | 0 |
| B | 0 | 12 | 0 |
| C | 0 | 12 | 0 |
| D | 0 | 12 | 0 |
| Quadrant | Total seconds | Saturated seconds | Saturation percentage |
|---|---|---|---|
| A | 6035 | 88 | 1.458161% |
| B | 6036 | 85 | 1.408217% |
| C | 6036 | 135 | 2.236581% |
| D | 6036 | 397 | 6.577203% |
Noise dominated data is calculated using 1-second bins in cleaned event files. If a bin has >2000 counts, and if more than 50% of those come from <1% of pixels, then it is considered to be noise-dominated and hence unusable.
| Quadrant | # 1 sec bins | Bins with >0 counts | Bins with >2000 counts | High rate bins dominated by noise | Noise dominated (total time) | Noise dominated (detector-on time) | Marked lightcurve |
|---|---|---|---|---|---|---|---|
| A | 7330 | 6036 | 0 | 0 | 0.00% | 0.00% | 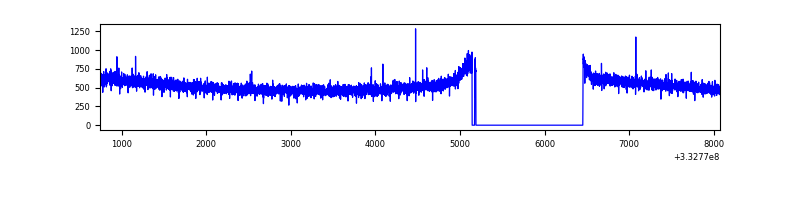 |
| B | 7331 | 6038 | 3 | 3 | 0.04% | 0.05% | 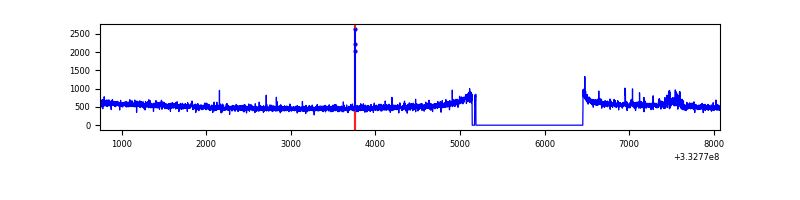 |
| C | 7331 | 6038 | 0 | 0 | 0.00% | 0.00% | 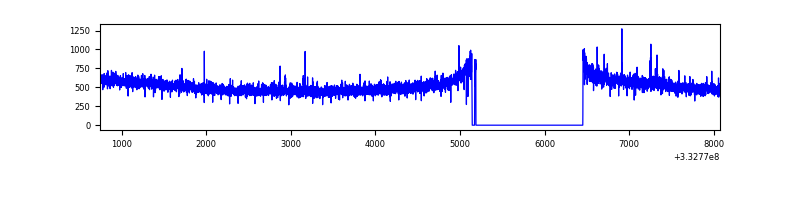 |
| D | 7331 | 6038 | 280 | 280 | 3.82% | 4.64% | 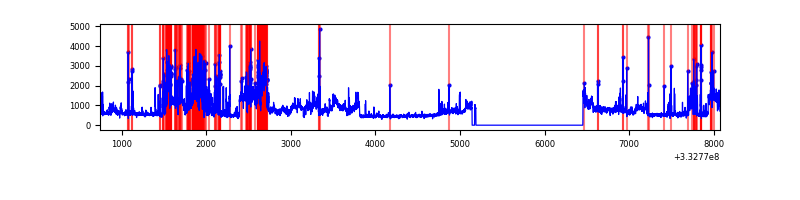 |
Top three noisy pixels from each quadrant. If the there are fewer than three noisy pixels in the level2.evt file, extra rows are filled as -1
| Pixel properties | Quadrant properties | ||||||
|---|---|---|---|---|---|---|---|
| Quadrant | DetID | PixID | Counts | Sigma | Mean | Median | Sigma |
| A | 13 | 254 | 8287 | 45.68 | 822 | 807 | 163.8 |
| A | 0 | 226 | 7190 | 38.98 | 822 | 807 | 163.8 |
| A | 3 | 137 | 6822 | 36.73 | 822 | 807 | 163.8 |
| B | 0 | 190 | 35884 | 233.56 | 795 | 778 | 150.3 |
| B | 0 | 229 | 22324 | 143.35 | 795 | 778 | 150.3 |
| B | 12 | 111 | 17443 | 110.87 | 795 | 778 | 150.3 |
| C | 14 | 238 | 126840 | 724.87 | 757 | 762 | 173.9 |
| C | 3 | 233 | 27365 | 152.95 | 757 | 762 | 173.9 |
| C | 0 | 207 | 19572 | 108.15 | 757 | 762 | 173.9 |
| D | 1 | 52 | 1659663 | 9003.74 | 773 | 755 | 184.2 |
| D | 12 | 233 | 630379 | 3417.29 | 773 | 755 | 184.2 |
| D | 2 | 153 | 131690 | 710.65 | 773 | 755 | 184.2 |
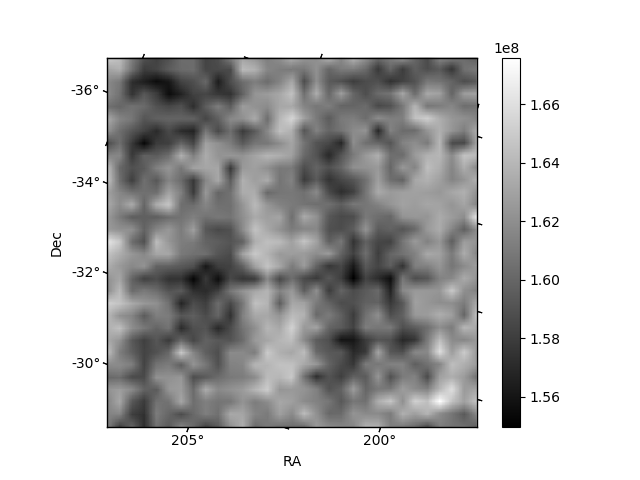
Histogram calculated using DETX and DETY for each event in the final _common_clean file
| Quadrant A | 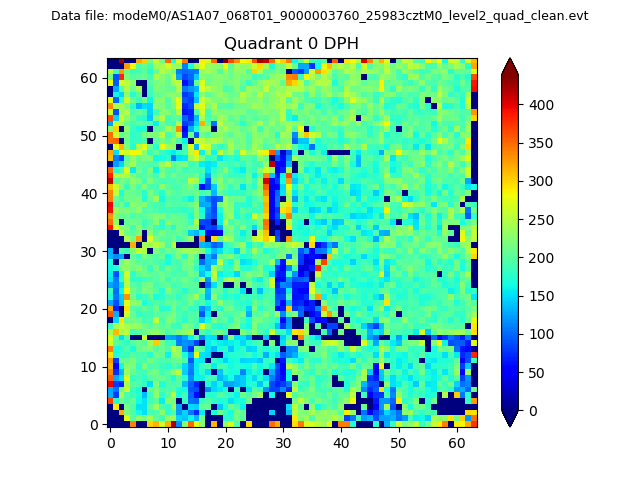 |
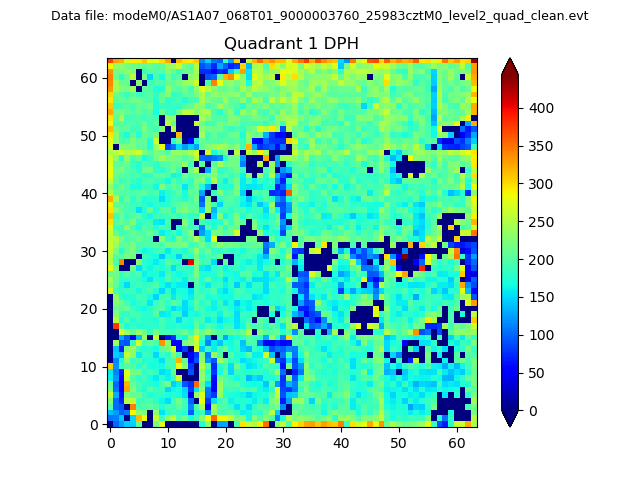 |
Quadrant B |
|---|---|---|---|
| Quadrant D | 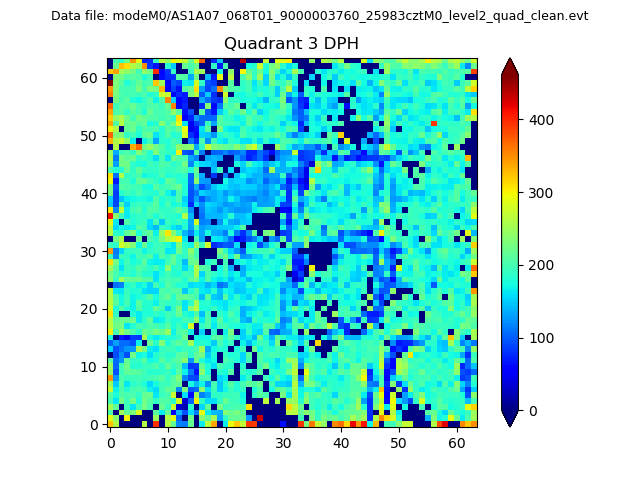 |
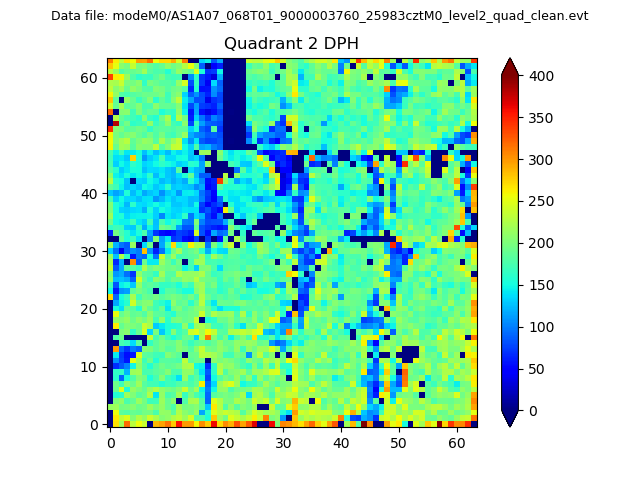 |
Quadrant C |
| Plot type | Count rate plots | Images |
|---|---|---|
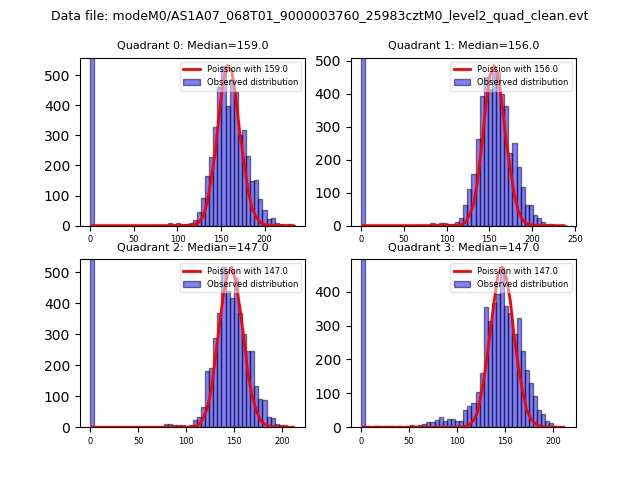
| Comparison with Poisson distribution Blue bars denote a histogram of data divided into 1 sec bins. Red curve is a Poisson curve with rate = median count rate of data. |
 |
 |
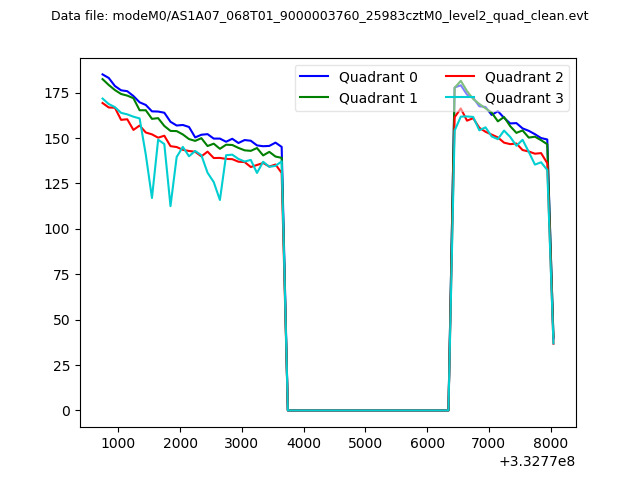
| Quadrant-wise count rates Data is divided into 100 sec bins |
 |
|
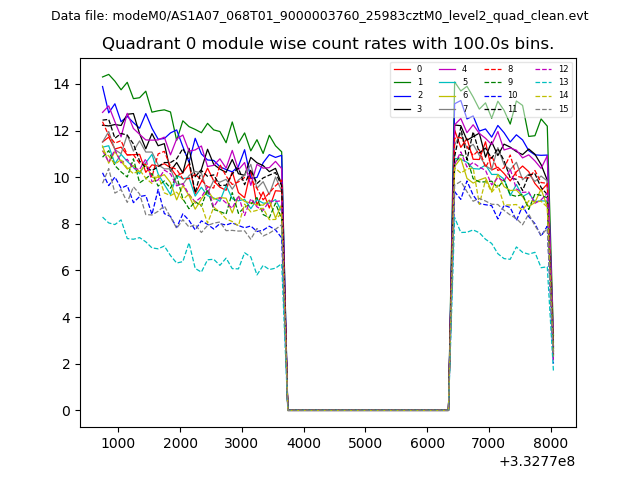
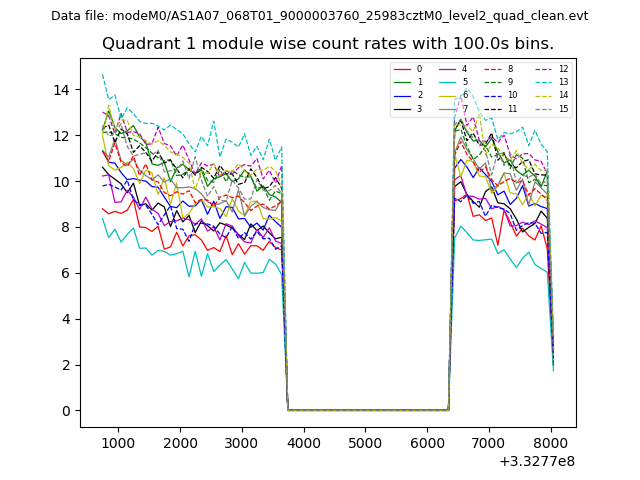
| Module-wise count rates for Quadrant A Data is divided into 100 sec bins |
 |
 |
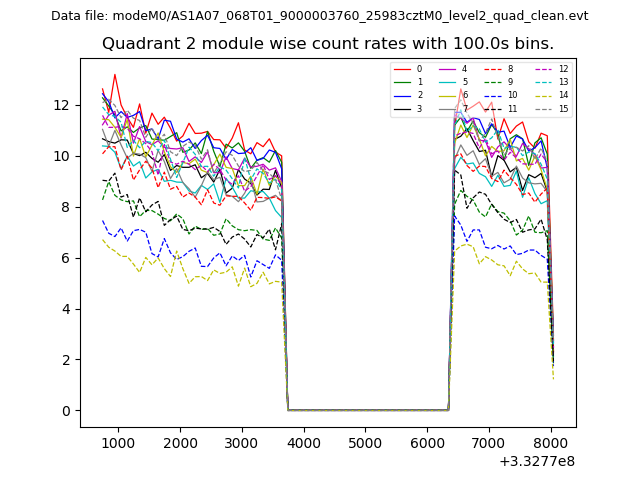
| Module-wise count rates for Quadrant B Data is divided into 100 sec bins |
 |
 |
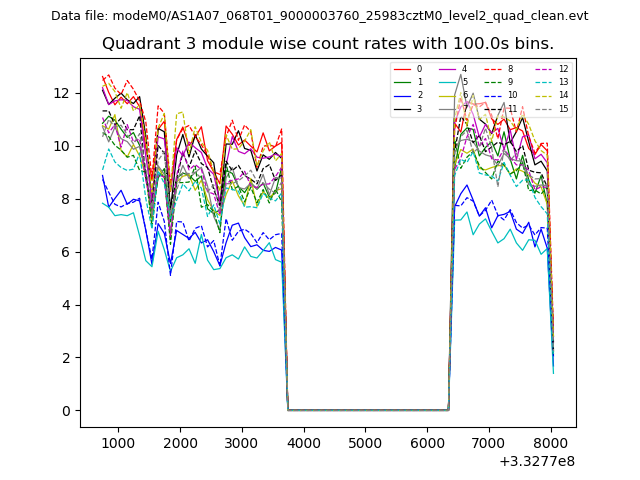
| Module-wise count rates for Quadrant C Data is divided into 100 sec bins |
 |
 |
| Module-wise count rates for Quadrant D Data is divided into 100 sec bins |
 |
 |
| Parameter | Plot |
|---|---|
| CZT HV Monitor | 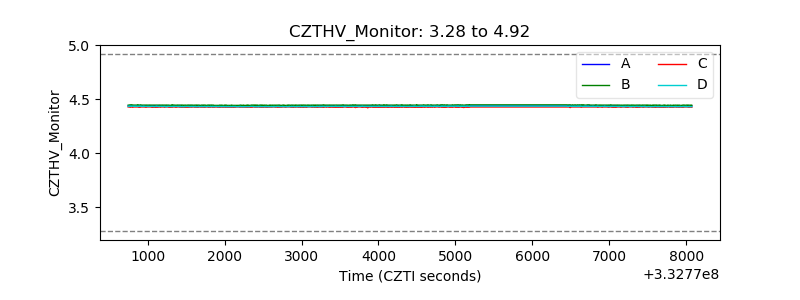 |
| D_VDD | 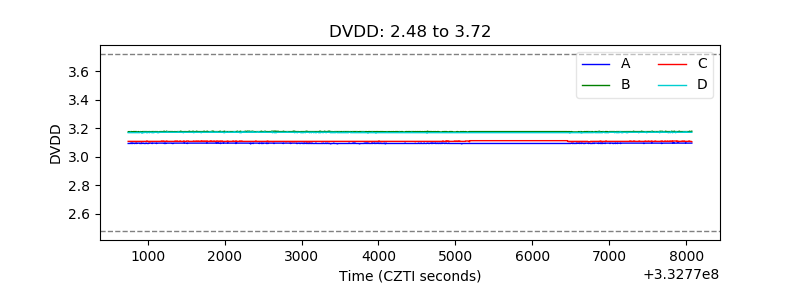 |
| Temperature 1 | 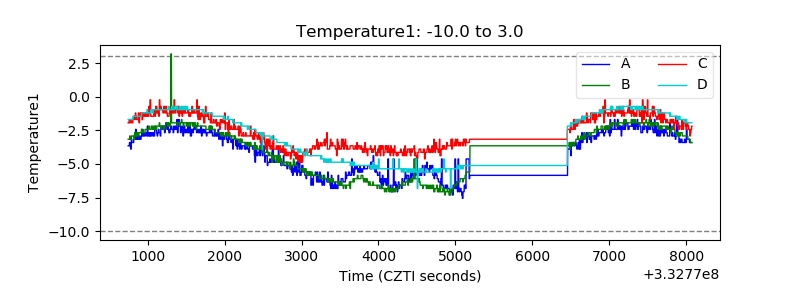 |
| Veto HV Monitor | 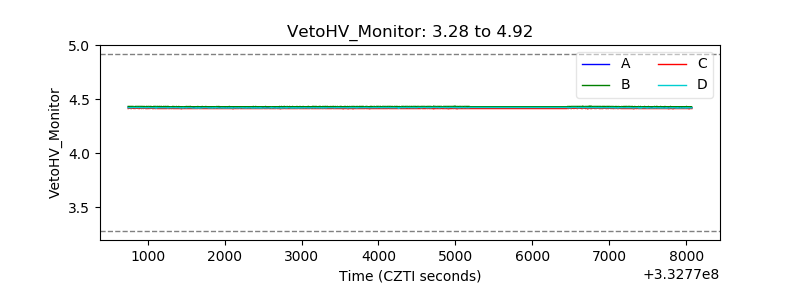 |
| Veto LLD | 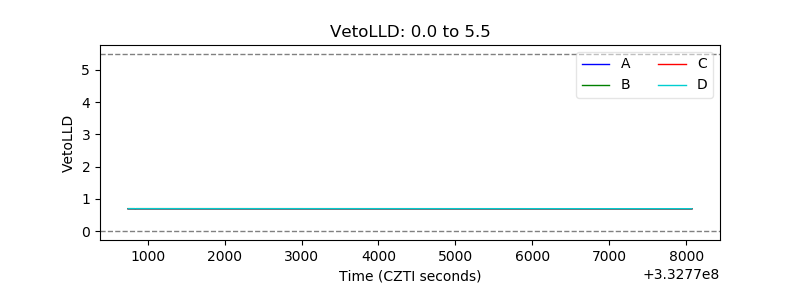 |
| Alpha Counter | 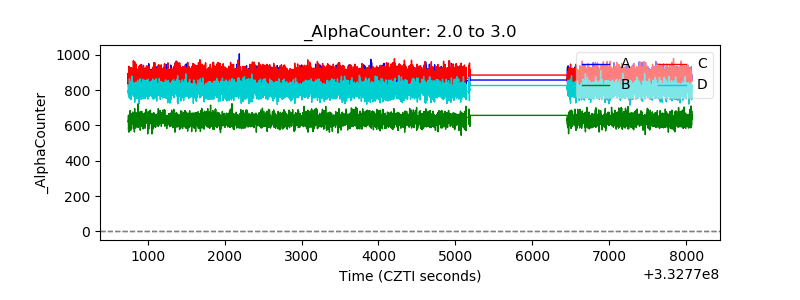 |
| _CPM_Rate | 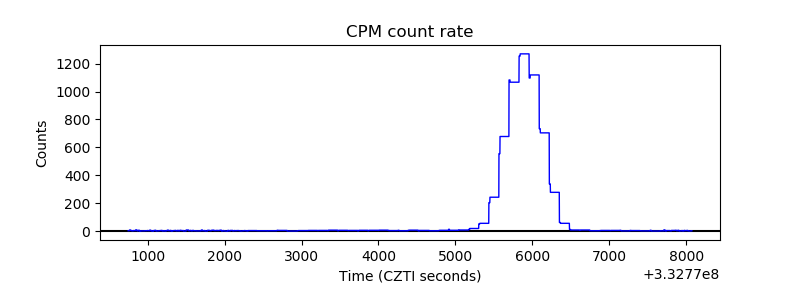 |
| CZT Counter |  |
| +2.5 Volts monitor |  |
| +5 Volts monitor | 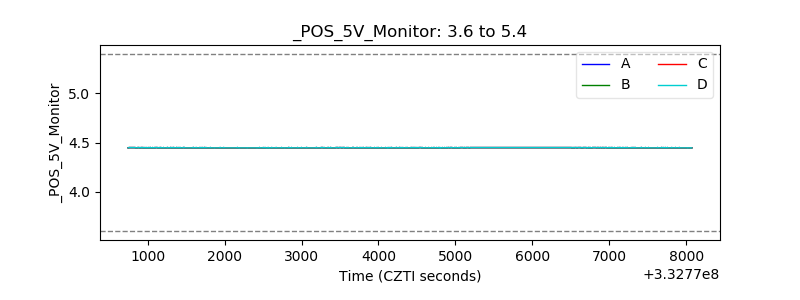 |
| _ROLL_ROT | 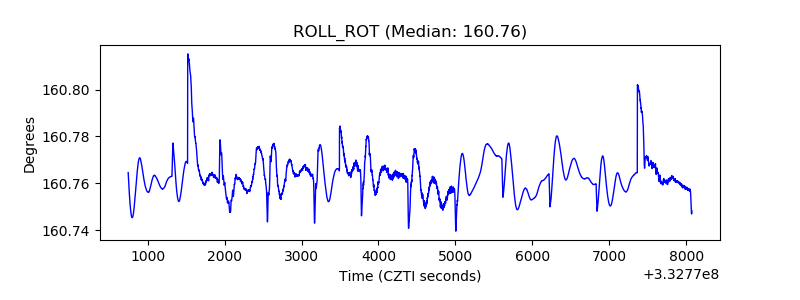 |
| _Roll_DEC | 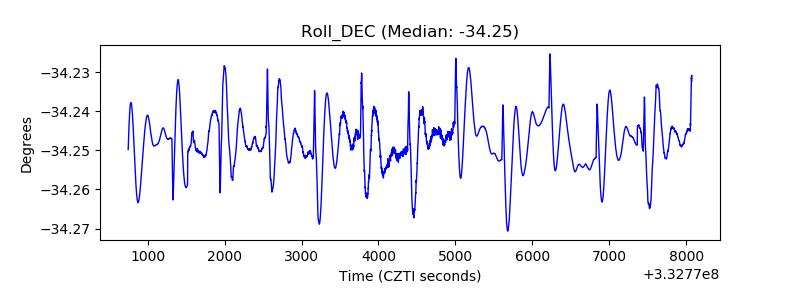 |
| _Roll_RA |  |
| Veto Counter | 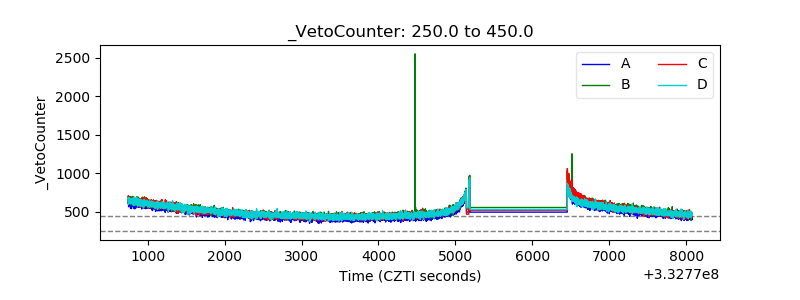 |