| Param | Original file | Final file |
|---|---|---|
| Filename | modeM0/AS1A07_068T01_9000003760_25984cztM0_level2.evt | modeM0/AS1A07_068T01_9000003760_25984cztM0_level2_quad_clean.evt |
| Size (bytes) | 427,728,960 | 86,385,600 |
| Size | 407.9 MB | 82.4 MB |
| Events in quadrant A | 2,924,646 | 571,426 |
| Events in quadrant B | 2,963,875 | 563,664 |
| Events in quadrant C | 2,926,651 | 530,520 |
| Events in quadrant D | 3,737,875 | 538,410 |
| Mode M0 | |||
|---|---|---|---|
| Quadrant | BADHDUFLAG | Total packets | Discarded packets |
| A | 0 | 12290 | 0 |
| B | 0 | 12495 | 0 |
| C | 0 | 12423 | 0 |
| D | 0 | 14982 | 0 |
| Mode M9 | |||
|---|---|---|---|
| Quadrant | BADHDUFLAG | Total packets | Discarded packets |
| A | 0 | 11 | 0 |
| B | 0 | 11 | 0 |
| C | 0 | 11 | 0 |
| D | 0 | 11 | 0 |
| Quadrant | Total seconds | Saturated seconds | Saturation percentage |
|---|---|---|---|
| A | 5896 | 54 | 0.915875% |
| B | 5896 | 66 | 1.119403% |
| C | 5897 | 90 | 1.526200% |
| D | 5897 | 103 | 1.746651% |
Noise dominated data is calculated using 1-second bins in cleaned event files. If a bin has >2000 counts, and if more than 50% of those come from <1% of pixels, then it is considered to be noise-dominated and hence unusable.
| Quadrant | # 1 sec bins | Bins with >0 counts | Bins with >2000 counts | High rate bins dominated by noise | Noise dominated (total time) | Noise dominated (detector-on time) | Marked lightcurve |
|---|---|---|---|---|---|---|---|
| A | 7036 | 5897 | 0 | 0 | 0.00% | 0.00% |  |
| B | 7036 | 5897 | 0 | 0 | 0.00% | 0.00% |  |
| C | 7037 | 5898 | 0 | 0 | 0.00% | 0.00% | 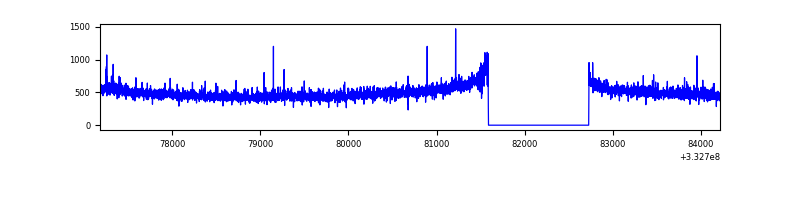 |
| D | 7037 | 5898 | 83 | 83 | 1.18% | 1.41% | 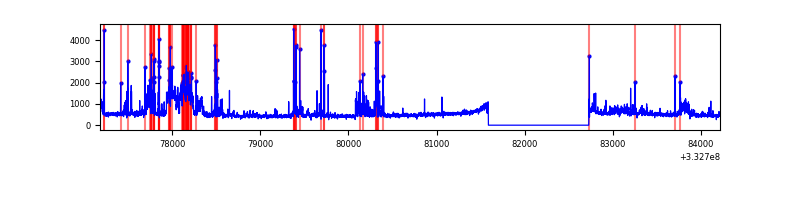 |
Top three noisy pixels from each quadrant. If the there are fewer than three noisy pixels in the level2.evt file, extra rows are filled as -1
| Pixel properties | Quadrant properties | ||||||
|---|---|---|---|---|---|---|---|
| Quadrant | DetID | PixID | Counts | Sigma | Mean | Median | Sigma |
| A | 13 | 254 | 8491 | 50.84 | 759 | 743 | 152.4 |
| A | 3 | 137 | 6820 | 39.87 | 759 | 743 | 152.4 |
| A | 0 | 226 | 6537 | 38.01 | 759 | 743 | 152.4 |
| B | 0 | 190 | 44911 | 311.83 | 743 | 724 | 141.7 |
| B | 0 | 229 | 19624 | 133.38 | 743 | 724 | 141.7 |
| B | 12 | 111 | 16866 | 113.92 | 743 | 724 | 141.7 |
| C | 14 | 238 | 116553 | 700.8 | 706 | 712 | 165.3 |
| C | 3 | 233 | 34581 | 204.9 | 706 | 712 | 165.3 |
| C | 0 | 207 | 24520 | 144.03 | 706 | 712 | 165.3 |
| D | 1 | 52 | 643168 | 3692.01 | 724 | 705 | 174.0 |
| D | 12 | 233 | 227210 | 1301.65 | 724 | 705 | 174.0 |
| D | 10 | 230 | 58365 | 331.35 | 724 | 705 | 174.0 |
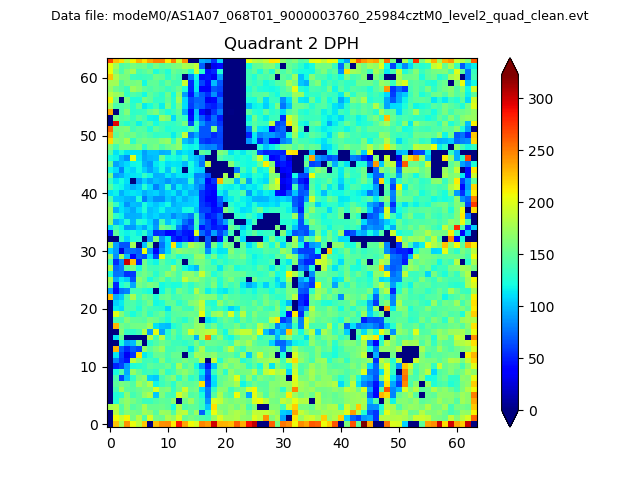
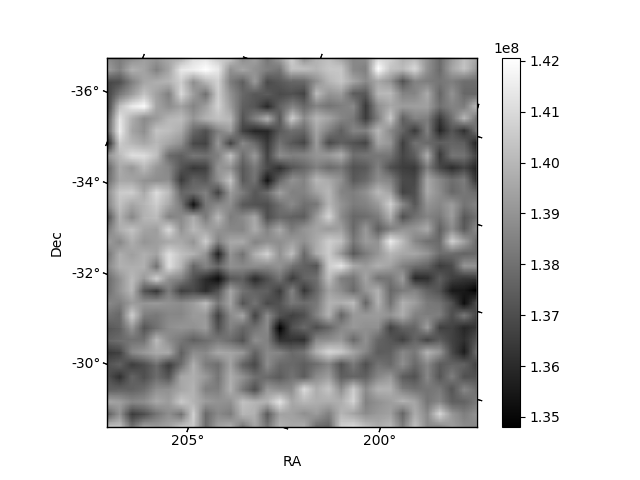
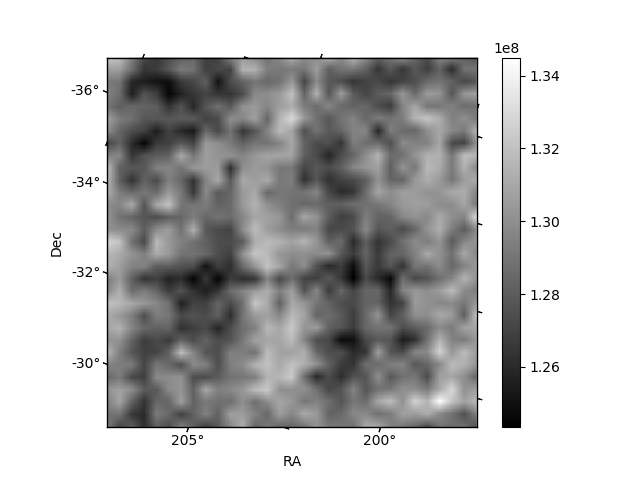
Histogram calculated using DETX and DETY for each event in the final _common_clean file
| Quadrant A | 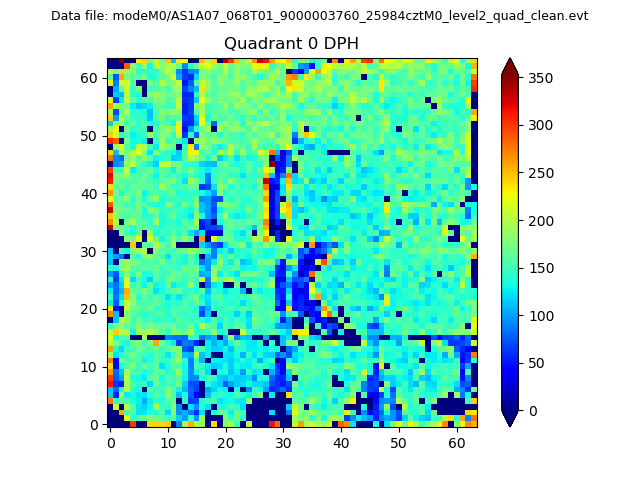 |
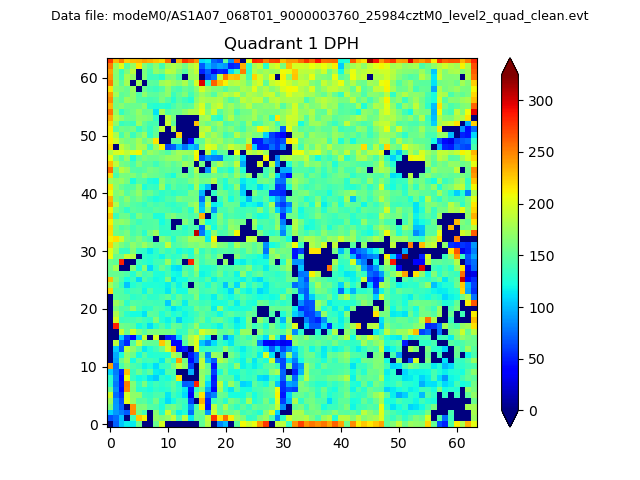 |
Quadrant B |
|---|---|---|---|
| Quadrant D | 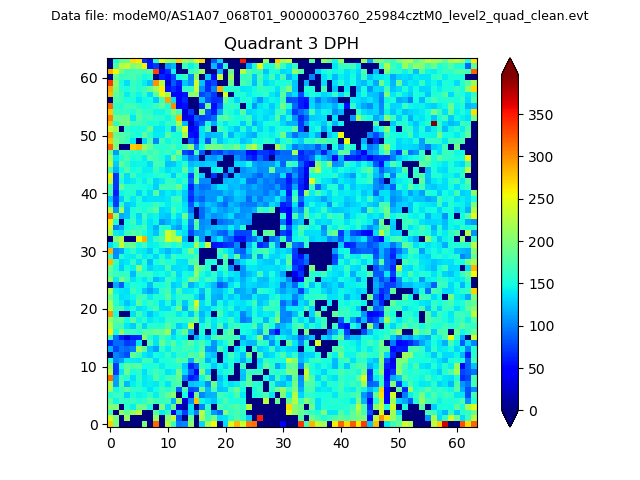 |
 |
Quadrant C |
| Plot type | Count rate plots | Images |
|---|---|---|
| Comparison with Poisson distribution Blue bars denote a histogram of data divided into 1 sec bins. Red curve is a Poisson curve with rate = median count rate of data. |
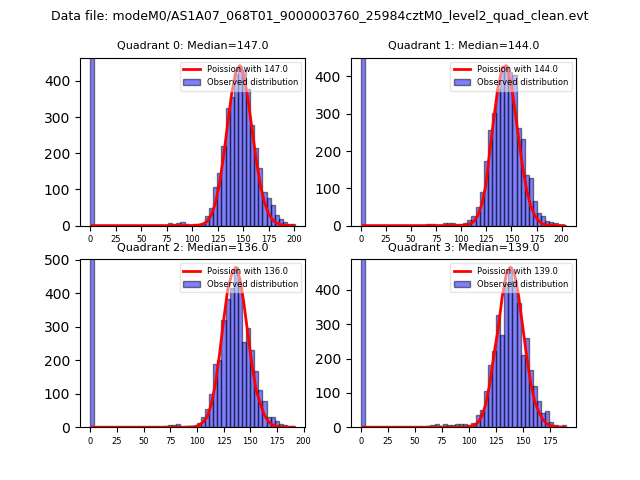 |
 |
| Quadrant-wise count rates Data is divided into 100 sec bins |
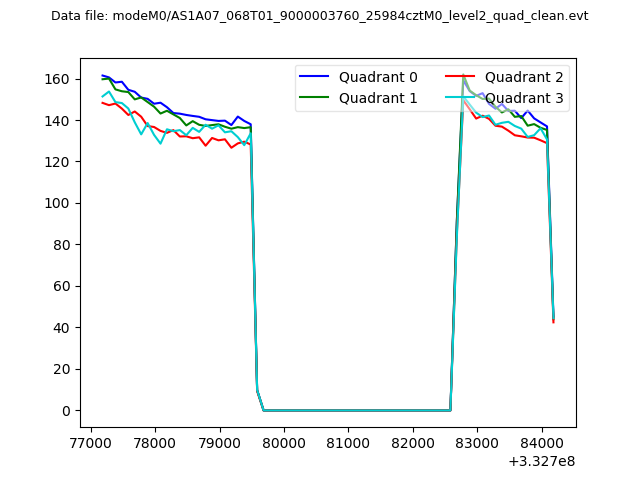 |
|
| Module-wise count rates for Quadrant A Data is divided into 100 sec bins |
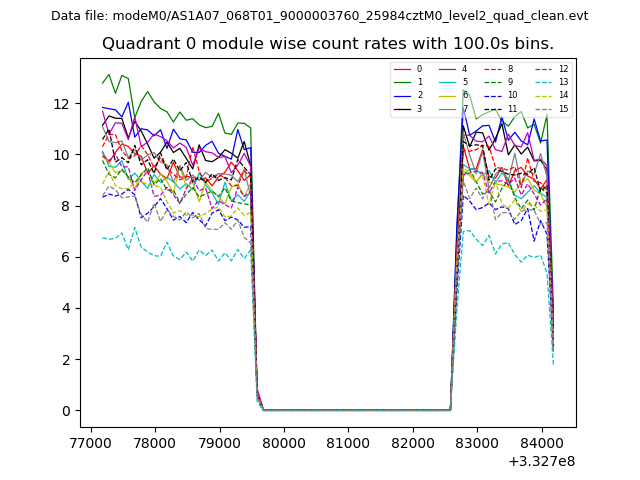 |
 |
| Module-wise count rates for Quadrant B Data is divided into 100 sec bins |
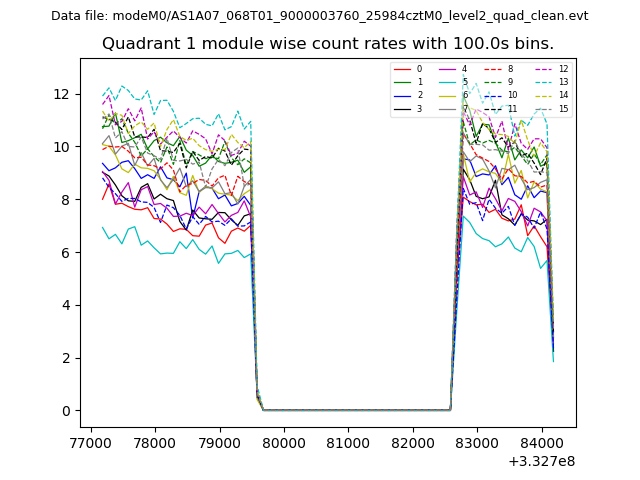 |
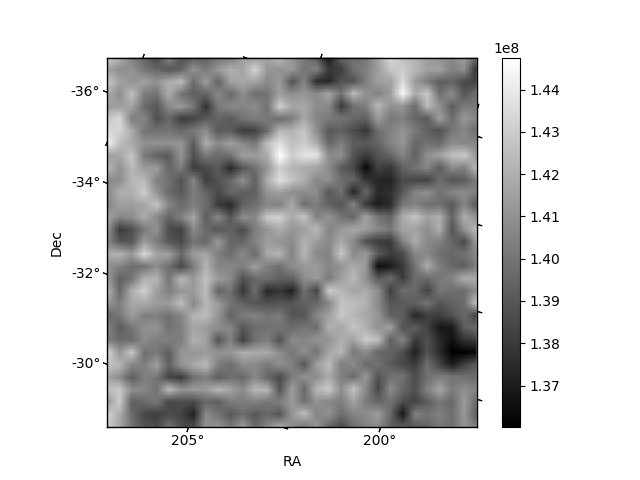 |
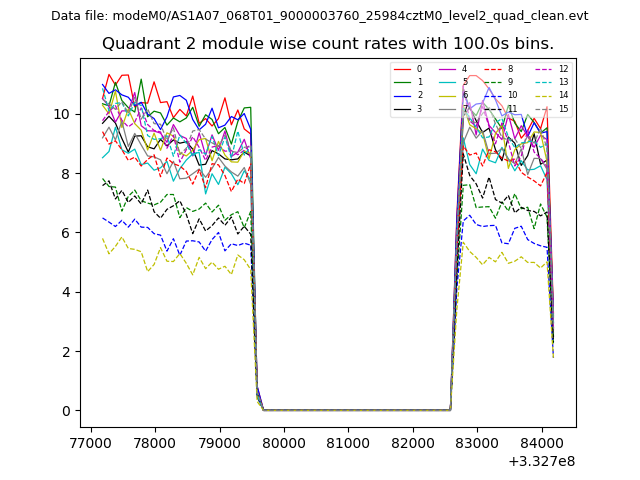
| Module-wise count rates for Quadrant C Data is divided into 100 sec bins |
 |
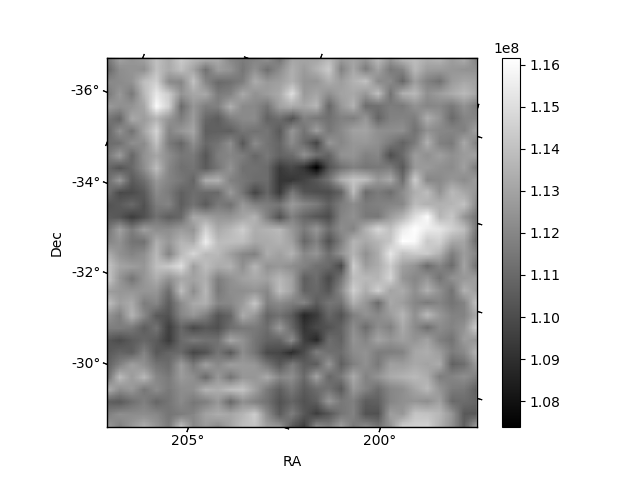 |
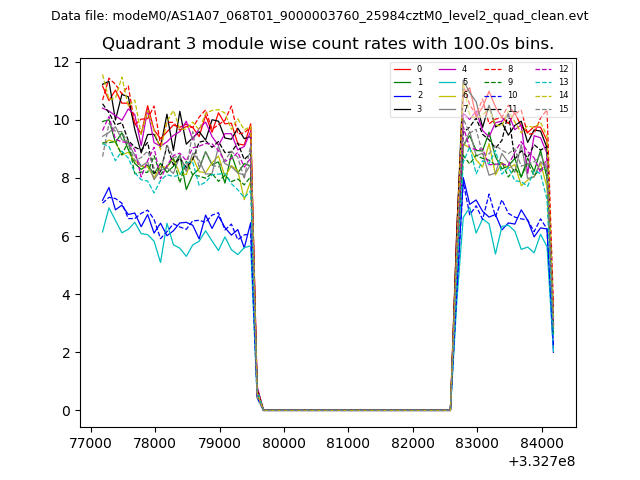
| Module-wise count rates for Quadrant D Data is divided into 100 sec bins |
 |
 |
| Parameter | Plot |
|---|---|
| CZT HV Monitor | 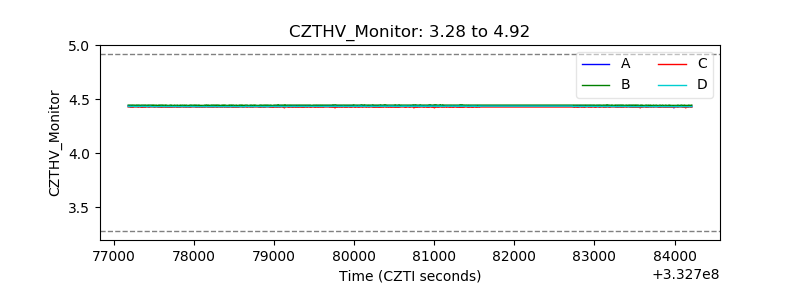 |
| D_VDD |  |
| Temperature 1 | 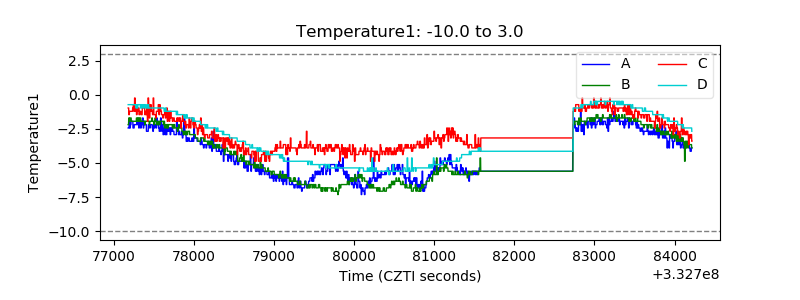 |
| Veto HV Monitor | 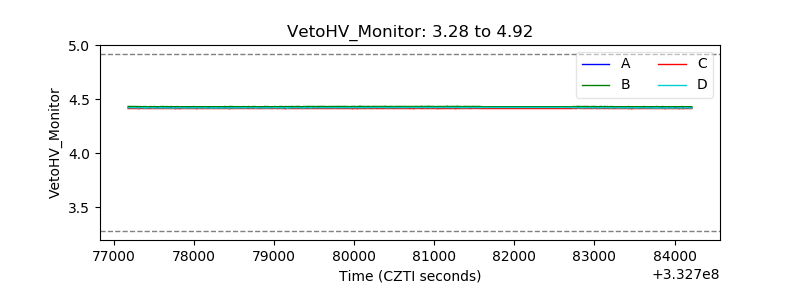 |
| Veto LLD | 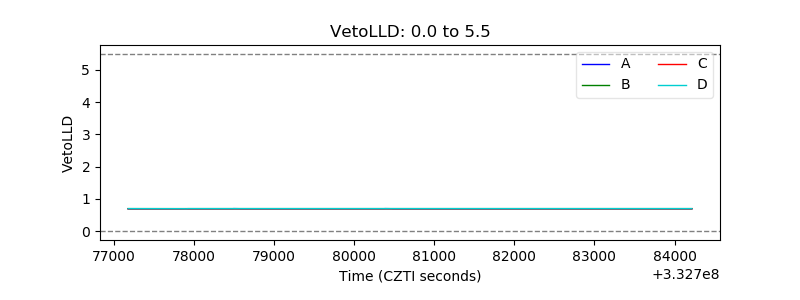 |
| Alpha Counter | 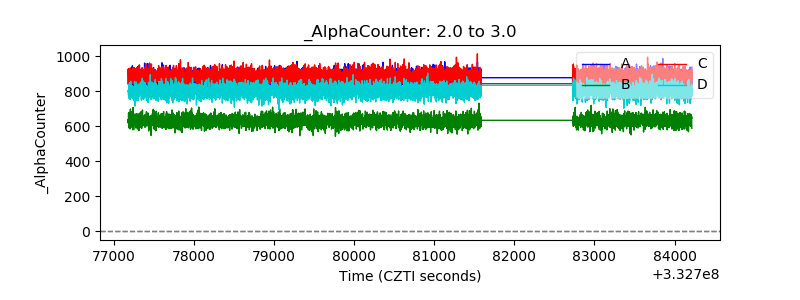 |
| _CPM_Rate | 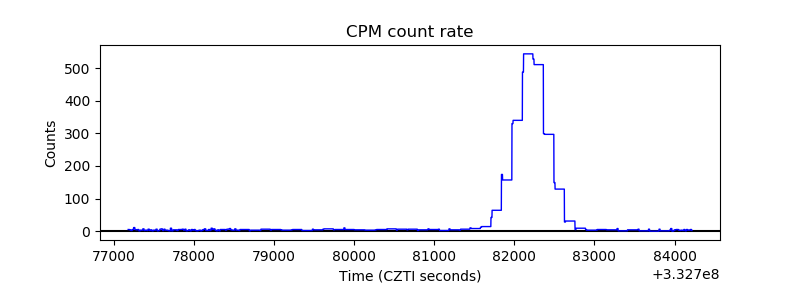 |
| CZT Counter | 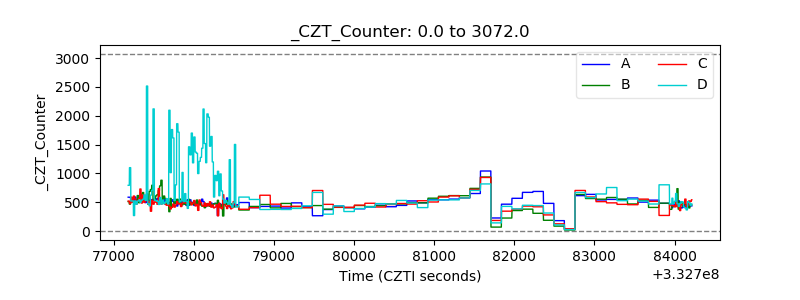 |
| +2.5 Volts monitor |  |
| +5 Volts monitor |  |
| _ROLL_ROT | 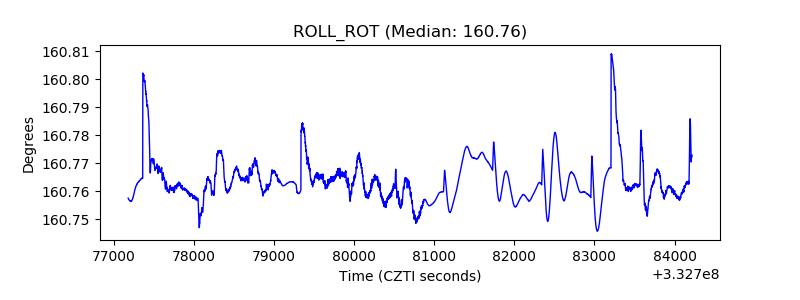 |
| _Roll_DEC | 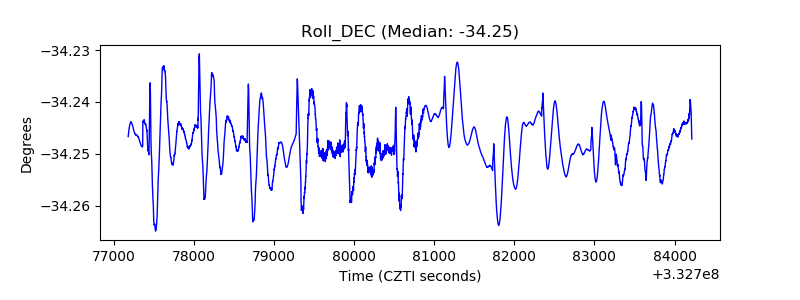 |
| _Roll_RA | 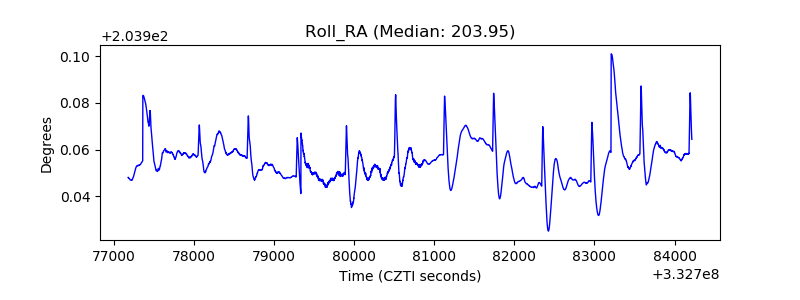 |
| Veto Counter | 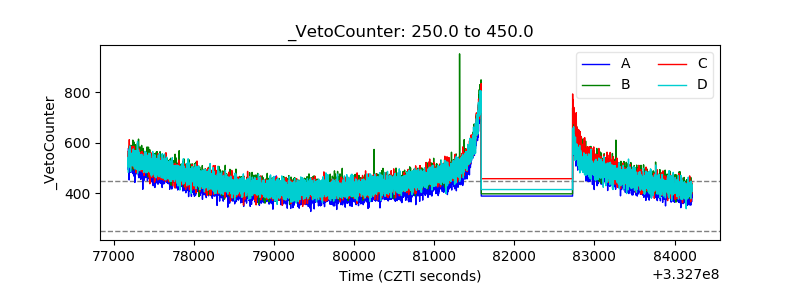 |