| Param | Original file | Final file |
|---|---|---|
| Filename | modeM0/AS1A07_068T01_9000003760_25986cztM0_level2.evt | modeM0/AS1A07_068T01_9000003760_25986cztM0_level2_quad_clean.evt |
| Size (bytes) | 1,244,583,360 | 216,129,600 |
| Size | 1.2 GB | 206.1 MB |
| Events in quadrant A | 8,742,618 | 1,393,978 |
| Events in quadrant B | 7,917,230 | 1,395,086 |
| Events in quadrant C | 7,893,015 | 1,324,815 |
| Events in quadrant D | 12,037,626 | 1,306,936 |
| Mode M0 | |||
|---|---|---|---|
| Quadrant | BADHDUFLAG | Total packets | Discarded packets |
| A | 0 | 36517 | 0 |
| B | 0 | 33954 | 0 |
| C | 0 | 34066 | 0 |
| D | 0 | 46754 | 0 |
| Mode M9 | |||
|---|---|---|---|
| Quadrant | BADHDUFLAG | Total packets | Discarded packets |
| A | 0 | 23 | 0 |
| B | 0 | 23 | 0 |
| C | 0 | 23 | 0 |
| D | 0 | 23 | 0 |
| Quadrant | Total seconds | Saturated seconds | Saturation percentage |
|---|---|---|---|
| A | 16302 | 289 | 1.772789% |
| B | 16310 | 144 | 0.882894% |
| C | 16307 | 208 | 1.275526% |
| D | 16308 | 732 | 4.488595% |
Noise dominated data is calculated using 1-second bins in cleaned event files. If a bin has >2000 counts, and if more than 50% of those come from <1% of pixels, then it is considered to be noise-dominated and hence unusable.
| Quadrant | # 1 sec bins | Bins with >0 counts | Bins with >2000 counts | High rate bins dominated by noise | Noise dominated (total time) | Noise dominated (detector-on time) | Marked lightcurve |
|---|---|---|---|---|---|---|---|
| A | 18673 | 16322 | 94 | 94 | 0.50% | 0.58% | 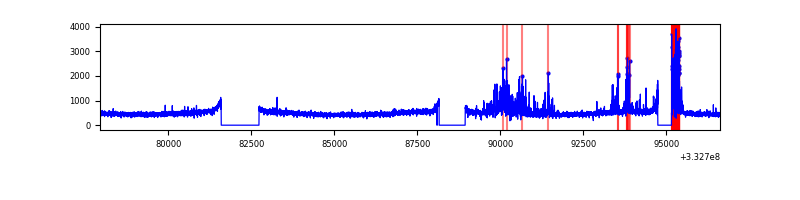 |
| B | 18673 | 16322 | 1 | 1 | 0.01% | 0.01% | 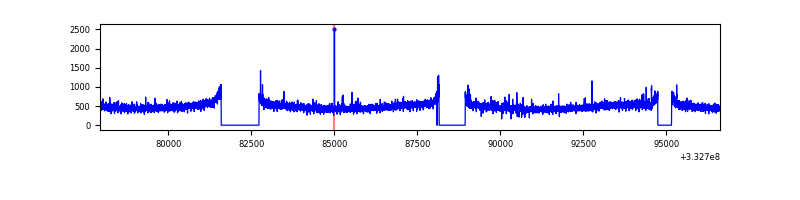 |
| C | 18673 | 16322 | 0 | 0 | 0.00% | 0.00% | 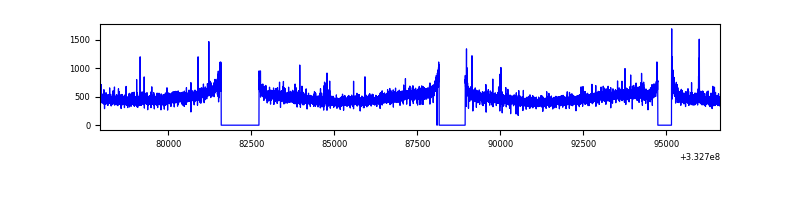 |
| D | 18673 | 16321 | 618 | 618 | 3.31% | 3.79% | 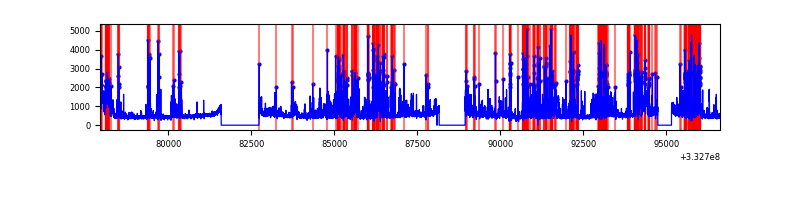 |
Top three noisy pixels from each quadrant. If the there are fewer than three noisy pixels in the level2.evt file, extra rows are filled as -1
| Pixel properties | Quadrant properties | ||||||
|---|---|---|---|---|---|---|---|
| Quadrant | DetID | PixID | Counts | Sigma | Mean | Median | Sigma |
| A | 0 | 13 | 955685 | 2361.3 | 2021 | 1979 | 403.9 |
| A | 13 | 254 | 24322 | 55.32 | 2021 | 1979 | 403.9 |
| A | 3 | 137 | 18858 | 41.79 | 2021 | 1979 | 403.9 |
| B | 12 | 111 | 46955 | 118.17 | 2003 | 1954 | 380.8 |
| B | 0 | 190 | 42419 | 106.26 | 2003 | 1954 | 380.8 |
| B | 11 | 111 | 41849 | 104.76 | 2003 | 1954 | 380.8 |
| C | 14 | 238 | 309800 | 692.89 | 1909 | 1925 | 444.3 |
| C | 0 | 207 | 86245 | 189.77 | 1909 | 1925 | 444.3 |
| C | 3 | 233 | 63392 | 138.33 | 1909 | 1925 | 444.3 |
| D | 1 | 52 | 3254483 | 7174.33 | 1906 | 1861 | 453.4 |
| D | 12 | 233 | 1190228 | 2621.19 | 1906 | 1861 | 453.4 |
| D | 10 | 230 | 224620 | 491.34 | 1906 | 1861 | 453.4 |
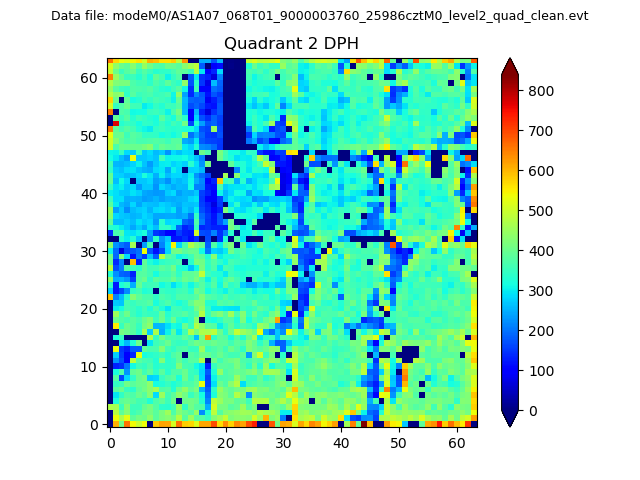
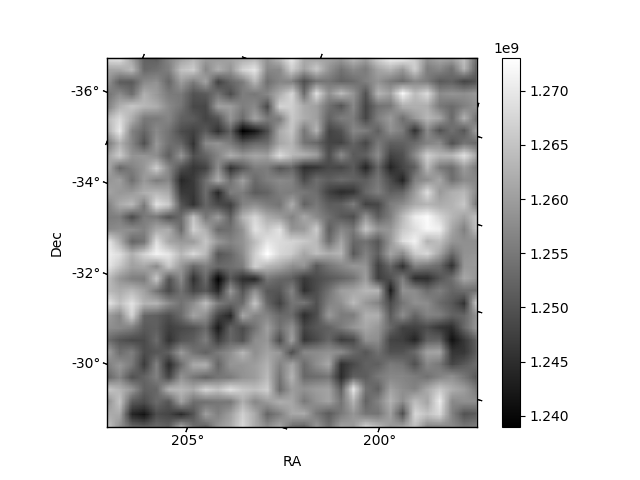
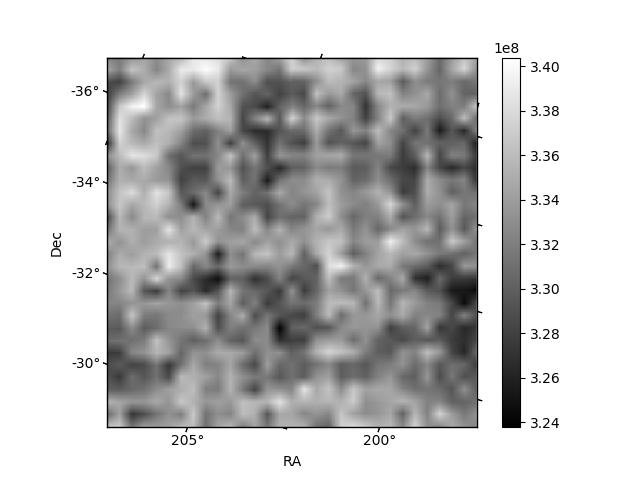
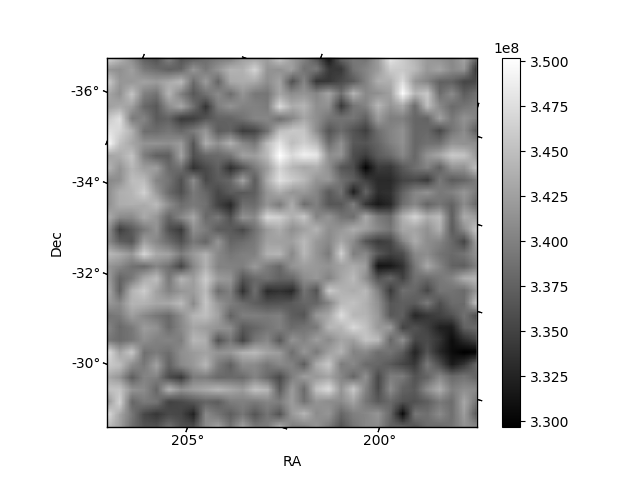
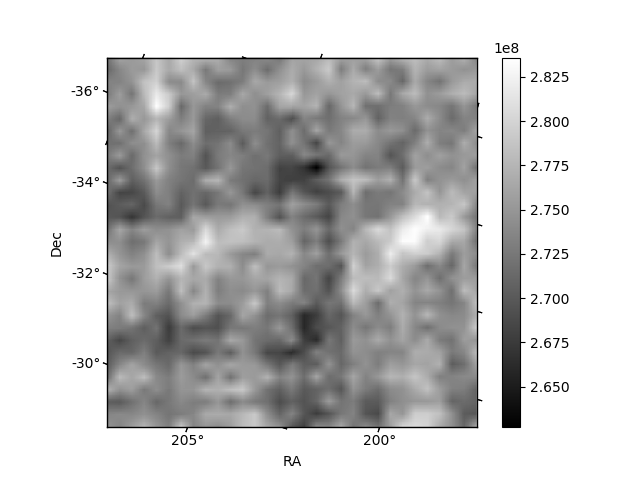
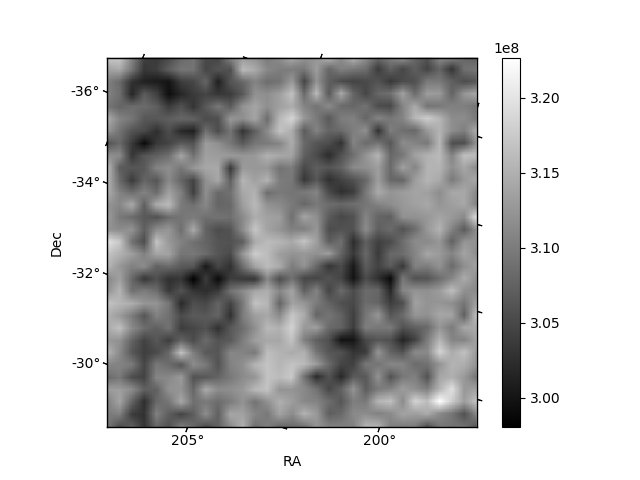
Histogram calculated using DETX and DETY for each event in the final _common_clean file
| Quadrant A | 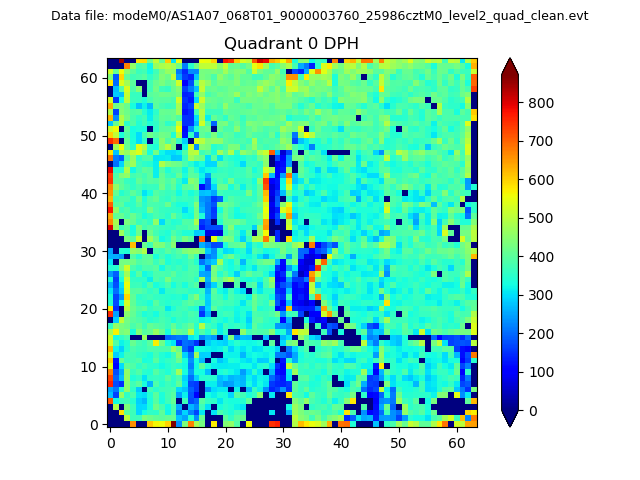 |
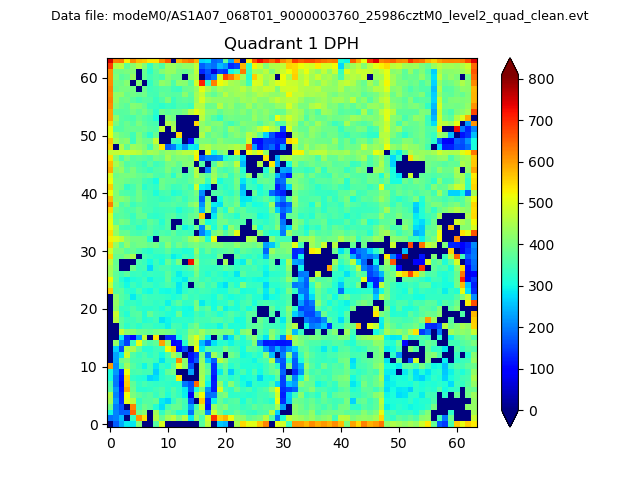 |
Quadrant B |
|---|---|---|---|
| Quadrant D | 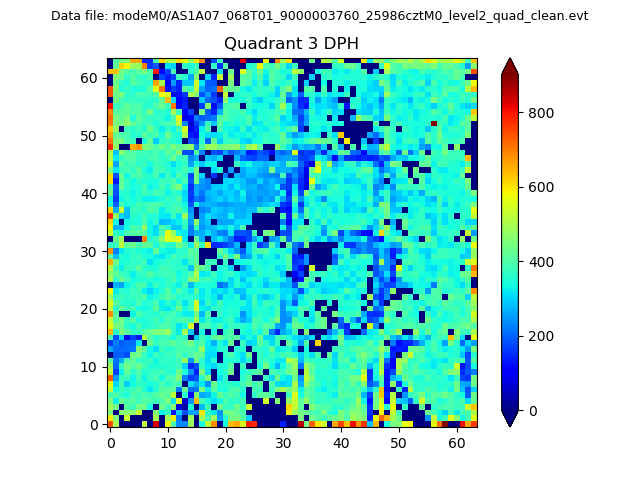 |
 |
Quadrant C |
| Plot type | Count rate plots | Images |
|---|---|---|
| Comparison with Poisson distribution Blue bars denote a histogram of data divided into 1 sec bins. Red curve is a Poisson curve with rate = median count rate of data. |
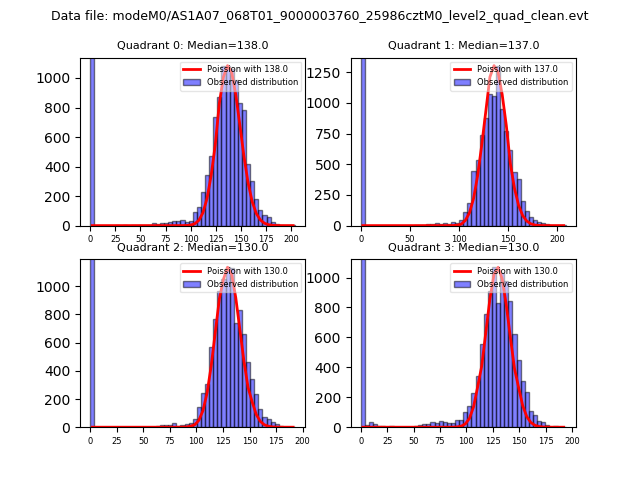 |
 |
| Quadrant-wise count rates Data is divided into 100 sec bins |
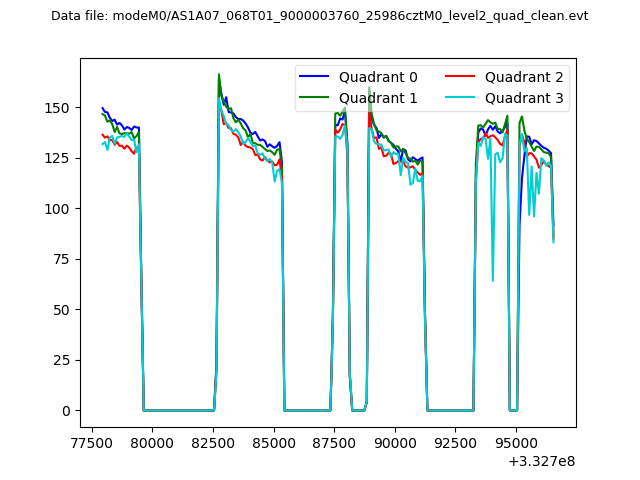 |
|
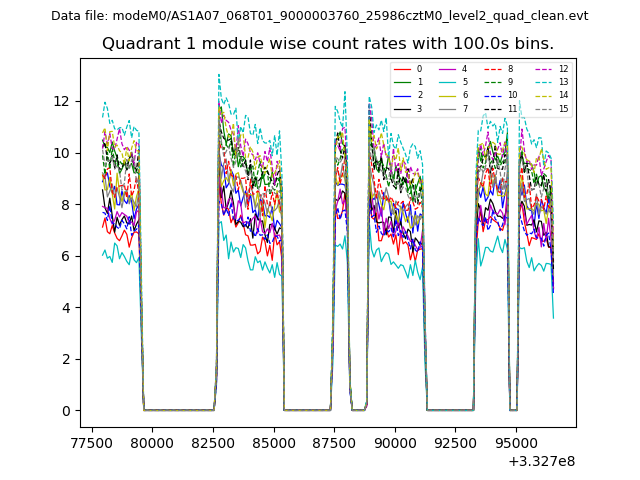
| Module-wise count rates for Quadrant A Data is divided into 100 sec bins |
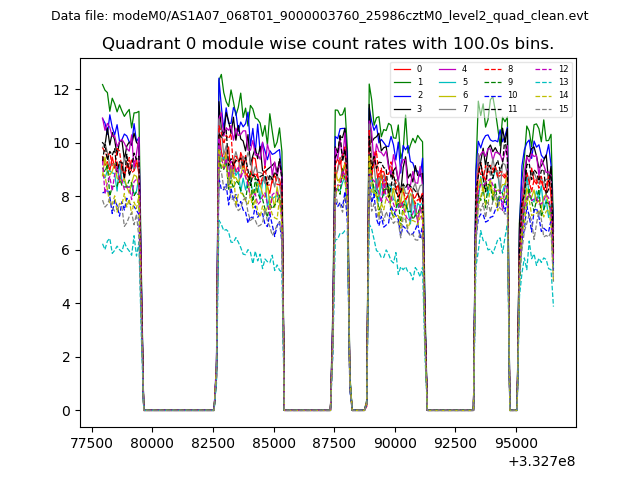 |
 |
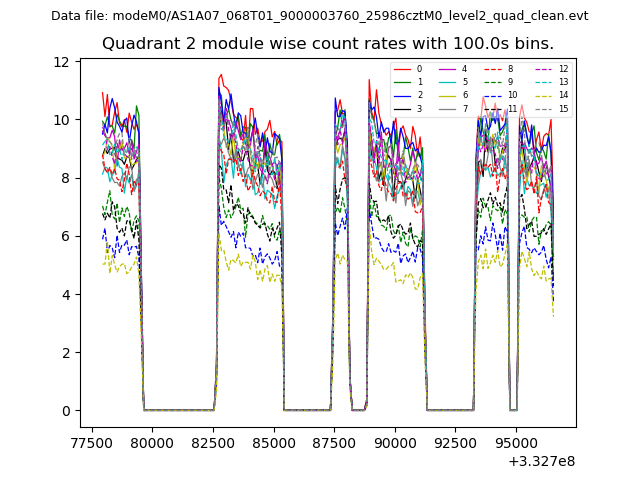
| Module-wise count rates for Quadrant B Data is divided into 100 sec bins |
 |
 |
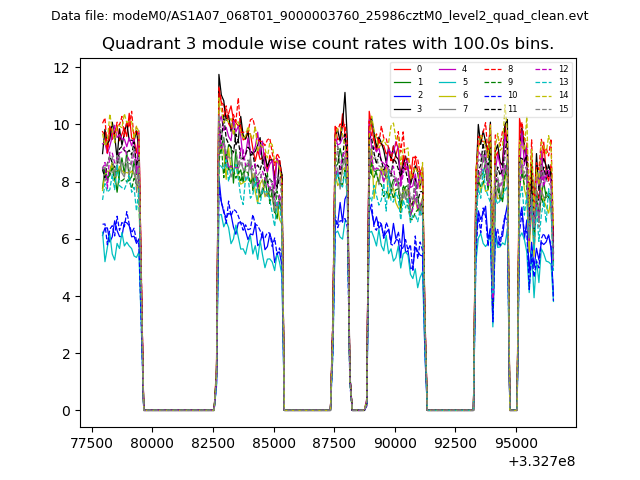
| Module-wise count rates for Quadrant C Data is divided into 100 sec bins |
 |
 |
| Module-wise count rates for Quadrant D Data is divided into 100 sec bins |
 |
 |
| Parameter | Plot |
|---|---|
| CZT HV Monitor | 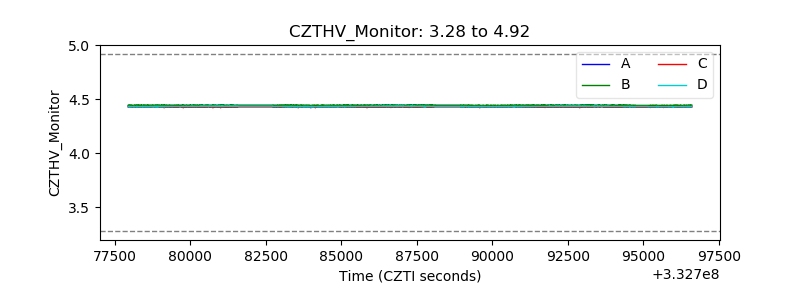 |
| D_VDD | 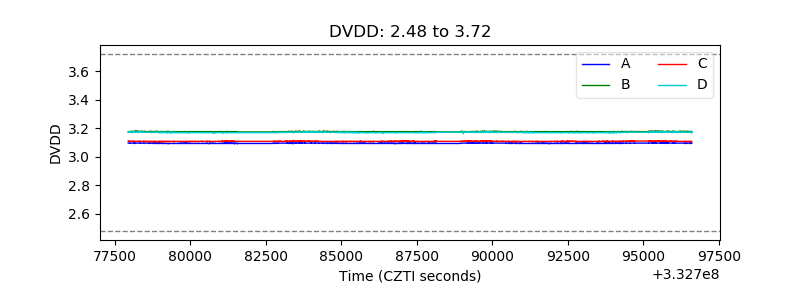 |
| Temperature 1 |  |
| Veto HV Monitor | 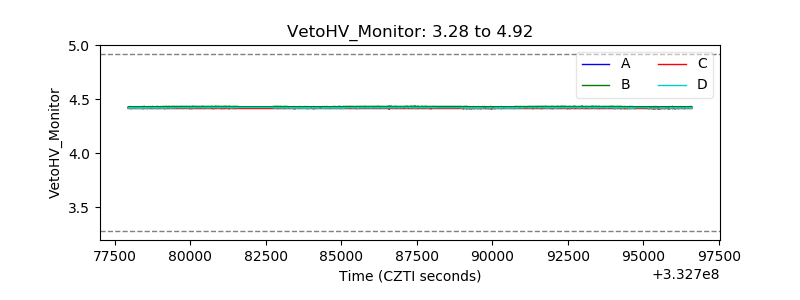 |
| Veto LLD | 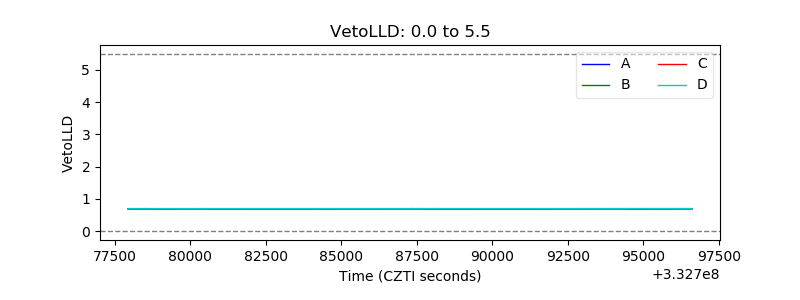 |
| Alpha Counter | 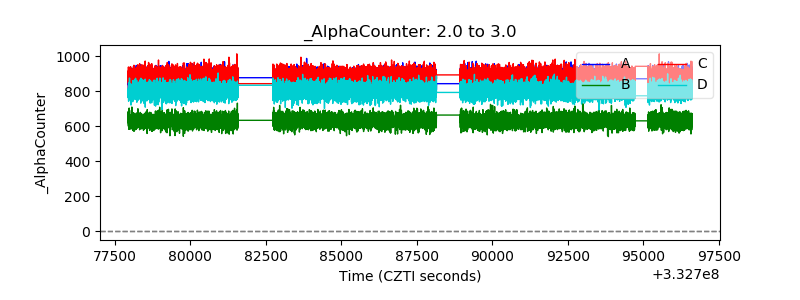 |
| _CPM_Rate | 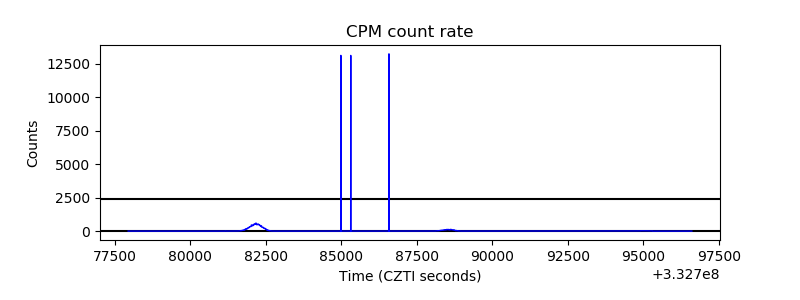 |
| CZT Counter | 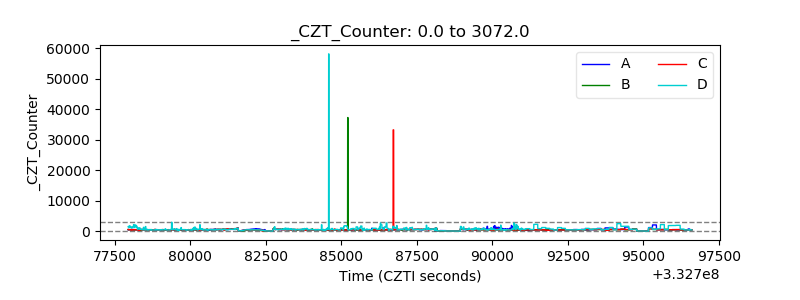 |
| +2.5 Volts monitor |  |
| +5 Volts monitor |  |
| _ROLL_ROT | 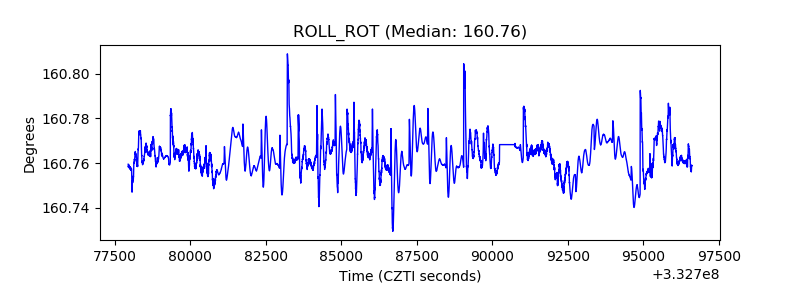 |
| _Roll_DEC | 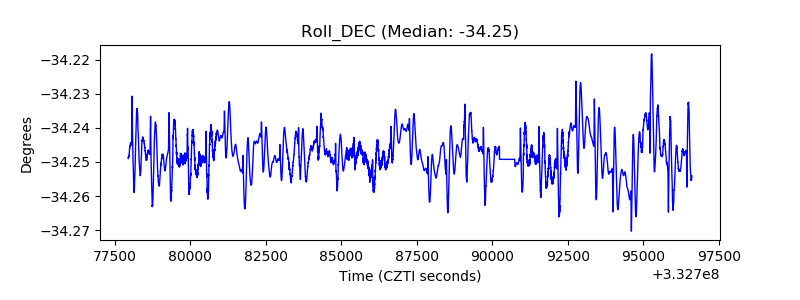 |
| _Roll_RA | 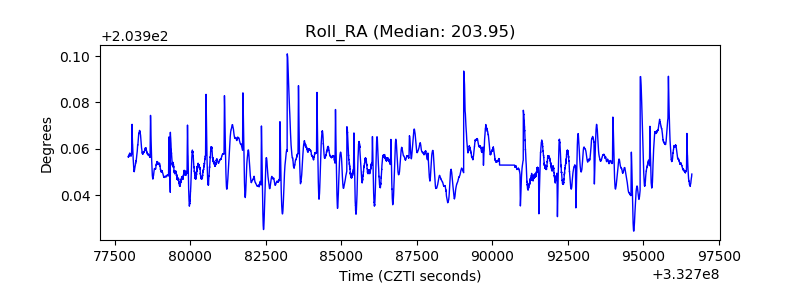 |
| Veto Counter | 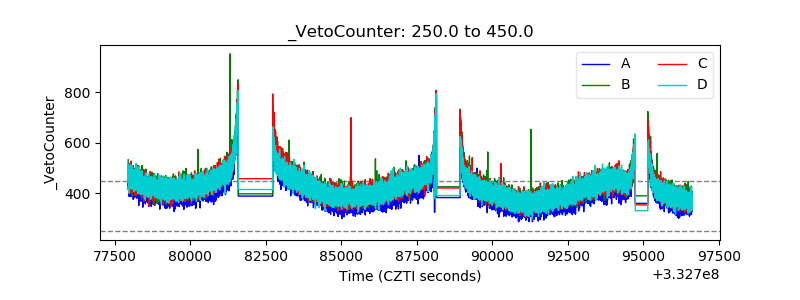 |