| Param | Original file | Final file |
|---|---|---|
| Filename | modeM0/AS1A07_068T01_9000003760_25987cztM0_level2.evt | modeM0/AS1A07_068T01_9000003760_25987cztM0_level2_quad_clean.evt |
| Size (bytes) | 575,956,800 | 113,094,720 |
| Size | 549.3 MB | 107.9 MB |
| Events in quadrant A | 3,942,075 | 743,510 |
| Events in quadrant B | 3,709,545 | 748,620 |
| Events in quadrant C | 3,703,118 | 710,376 |
| Events in quadrant D | 5,565,643 | 687,078 |
| Mode M0 | |||
|---|---|---|---|
| Quadrant | BADHDUFLAG | Total packets | Discarded packets |
| A | 0 | 16820 | 0 |
| B | 0 | 16035 | 0 |
| C | 0 | 16043 | 0 |
| D | 0 | 21899 | 0 |
| Mode M9 | |||
|---|---|---|---|
| Quadrant | BADHDUFLAG | Total packets | Discarded packets |
| A | 0 | 7 | 0 |
| B | 0 | 7 | 0 |
| C | 0 | 7 | 0 |
| D | 0 | 7 | 0 |
| Quadrant | Total seconds | Saturated seconds | Saturation percentage |
|---|---|---|---|
| A | 7699 | 231 | 3.000390% |
| B | 7696 | 97 | 1.260395% |
| C | 7701 | 107 | 1.389430% |
| D | 7698 | 561 | 7.287607% |
Noise dominated data is calculated using 1-second bins in cleaned event files. If a bin has >2000 counts, and if more than 50% of those come from <1% of pixels, then it is considered to be noise-dominated and hence unusable.
| Quadrant | # 1 sec bins | Bins with >0 counts | Bins with >2000 counts | High rate bins dominated by noise | Noise dominated (total time) | Noise dominated (detector-on time) | Marked lightcurve |
|---|---|---|---|---|---|---|---|
| A | 8378 | 7704 | 81 | 81 | 0.97% | 1.05% | 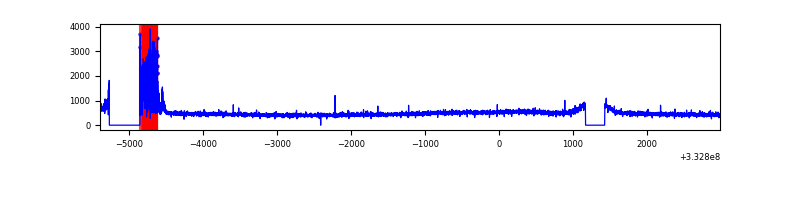 |
| B | 8378 | 7705 | 1 | 1 | 0.01% | 0.01% | 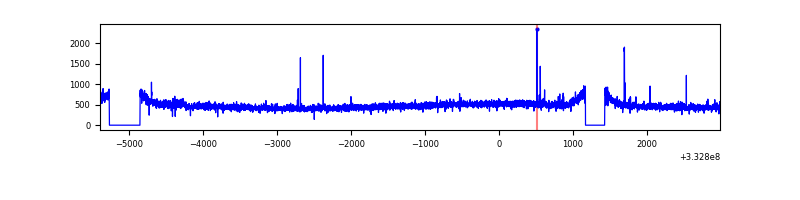 |
| C | 8377 | 7704 | 2 | 2 | 0.02% | 0.03% |  |
| D | 8378 | 7705 | 448 | 448 | 5.35% | 5.81% | 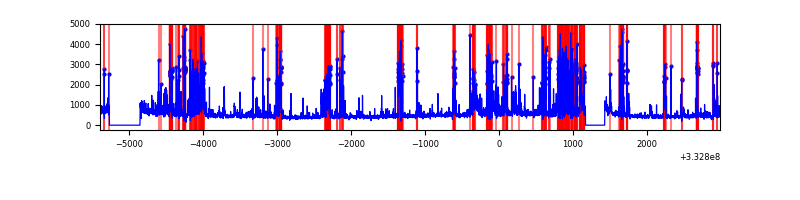 |
Top three noisy pixels from each quadrant. If the there are fewer than three noisy pixels in the level2.evt file, extra rows are filled as -1
| Pixel properties | Quadrant properties | ||||||
|---|---|---|---|---|---|---|---|
| Quadrant | DetID | PixID | Counts | Sigma | Mean | Median | Sigma |
| A | 0 | 13 | 319746 | 1676.43 | 939 | 920 | 190.2 |
| A | 13 | 254 | 12227 | 59.45 | 939 | 920 | 190.2 |
| A | 3 | 137 | 8919 | 42.06 | 939 | 920 | 190.2 |
| B | 0 | 190 | 24342 | 130.54 | 934 | 911 | 179.5 |
| B | 12 | 111 | 22186 | 118.52 | 934 | 911 | 179.5 |
| B | 11 | 111 | 19685 | 104.59 | 934 | 911 | 179.5 |
| C | 14 | 238 | 143571 | 685.54 | 890 | 895 | 208.1 |
| C | 0 | 207 | 43783 | 206.07 | 890 | 895 | 208.1 |
| C | 3 | 233 | 34997 | 163.86 | 890 | 895 | 208.1 |
| D | 1 | 52 | 2015073 | 9538.17 | 880 | 858 | 211.2 |
| D | 12 | 233 | 123417 | 580.37 | 880 | 858 | 211.2 |
| D | 7 | 80 | 42122 | 195.4 | 880 | 858 | 211.2 |
Histogram calculated using DETX and DETY for each event in the final _common_clean file
| Quadrant A |  |
 |
Quadrant B |
|---|---|---|---|
| Quadrant D |  |
 |
Quadrant C |
| Plot type | Count rate plots | Images |
|---|---|---|
| Comparison with Poisson distribution Blue bars denote a histogram of data divided into 1 sec bins. Red curve is a Poisson curve with rate = median count rate of data. |
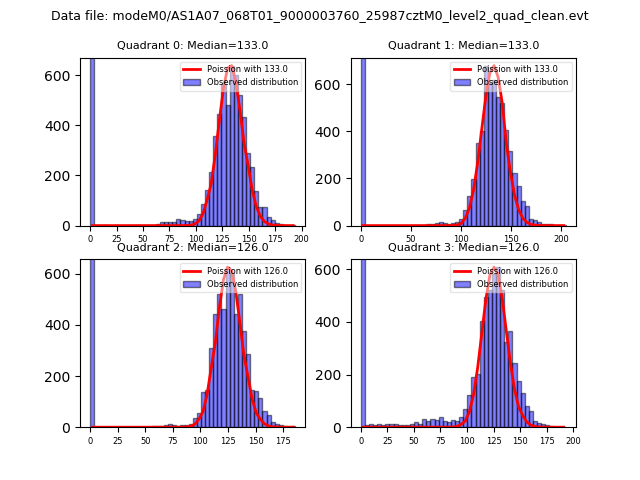 |
 |
| Quadrant-wise count rates Data is divided into 100 sec bins |
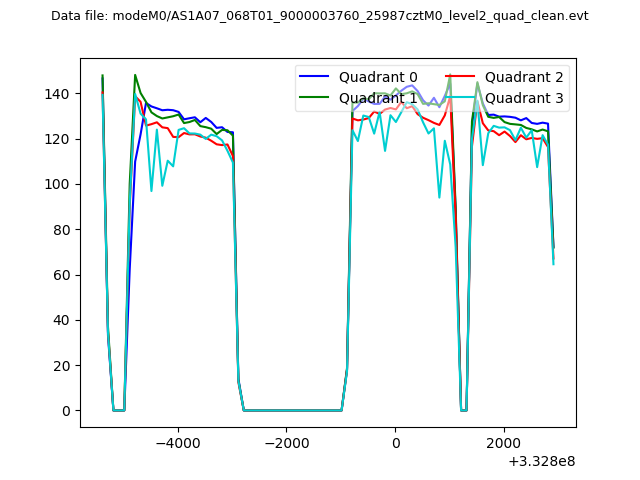 |
|
| Module-wise count rates for Quadrant A Data is divided into 100 sec bins |
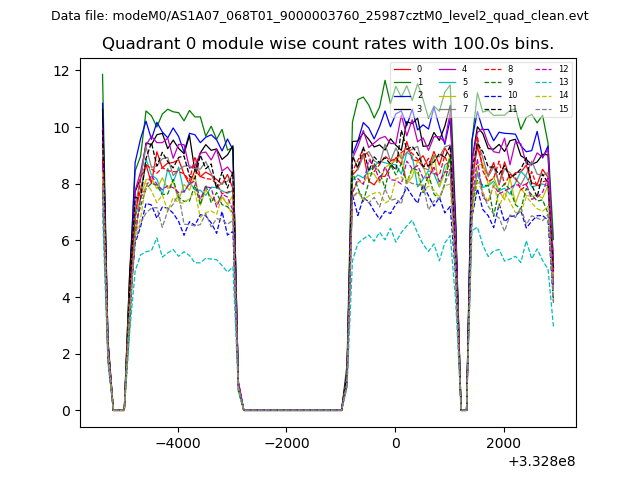 |
 |
| Module-wise count rates for Quadrant B Data is divided into 100 sec bins |
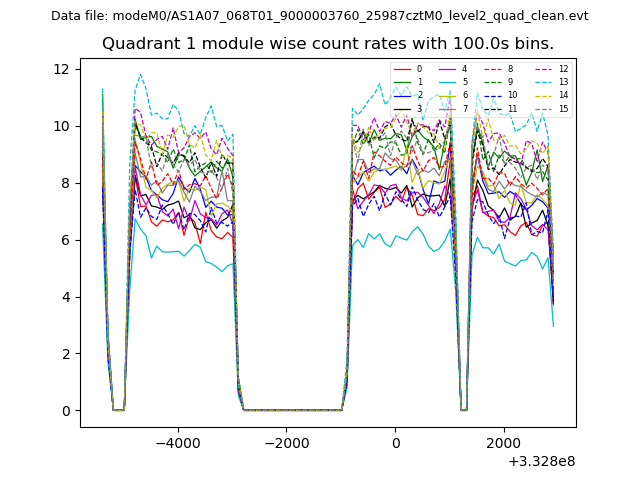 |
 |
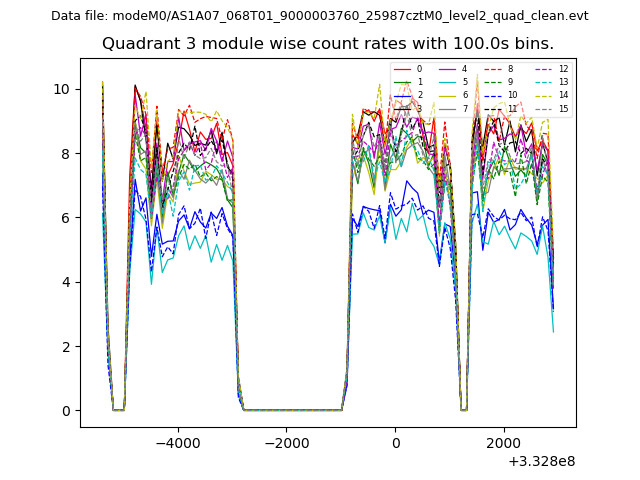
| Module-wise count rates for Quadrant C Data is divided into 100 sec bins |
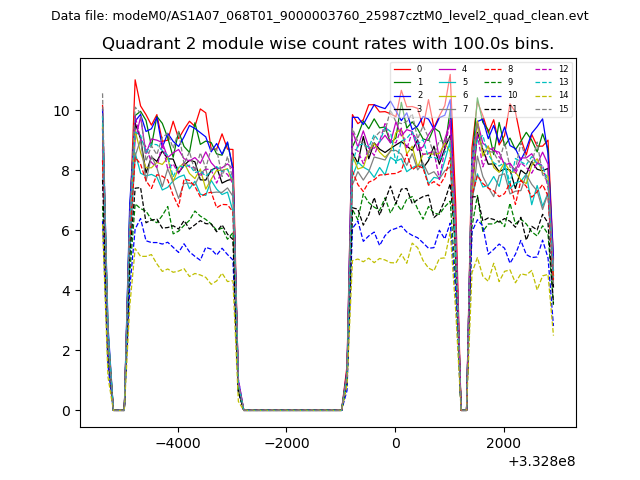 |
 |
| Module-wise count rates for Quadrant D Data is divided into 100 sec bins |
 |
 |
| Parameter | Plot |
|---|---|
| CZT HV Monitor | 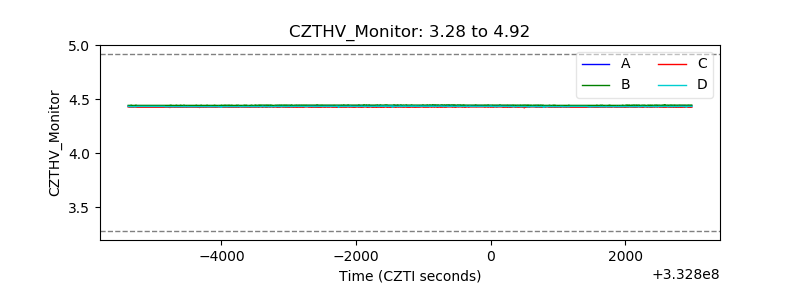 |
| D_VDD |  |
| Temperature 1 |  |
| Veto HV Monitor |  |
| Veto LLD |  |
| Alpha Counter | 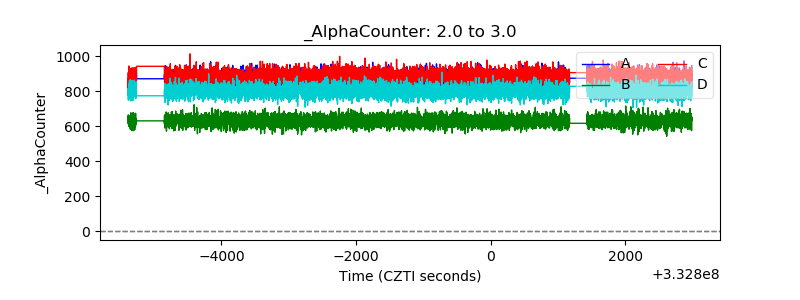 |
| _CPM_Rate | 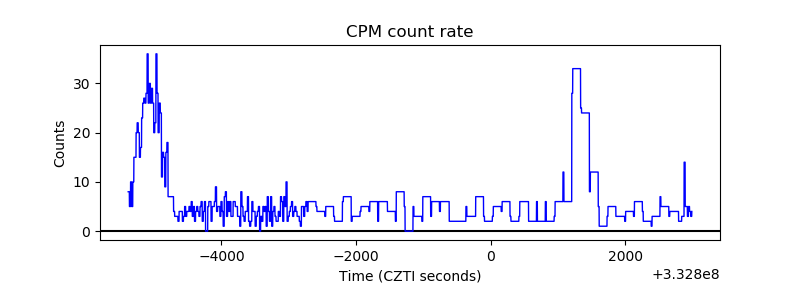 |
| CZT Counter |  |
| +2.5 Volts monitor |  |
| +5 Volts monitor |  |
| _ROLL_ROT |  |
| _Roll_DEC |  |
| _Roll_RA |  |
| Veto Counter | 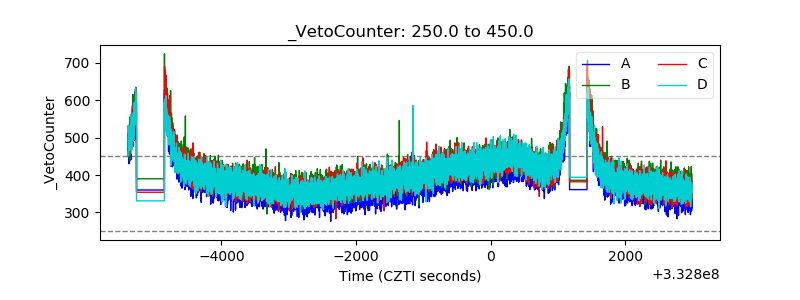 |