| Param | Original file | Final file |
|---|---|---|
| Filename | modeM0/AS1A07_068T01_9000003760_25988cztM0_level2.evt | modeM0/AS1A07_068T01_9000003760_25988cztM0_level2_quad_clean.evt |
| Size (bytes) | 551,923,200 | 106,966,080 |
| Size | 526.4 MB | 102.0 MB |
| Events in quadrant A | 3,651,679 | 702,052 |
| Events in quadrant B | 3,730,520 | 695,145 |
| Events in quadrant C | 3,736,247 | 663,184 |
| Events in quadrant D | 5,071,887 | 641,649 |
| Mode M0 | |||
|---|---|---|---|
| Quadrant | BADHDUFLAG | Total packets | Discarded packets |
| A | 0 | 15933 | 0 |
| B | 0 | 16132 | 0 |
| C | 0 | 16111 | 0 |
| D | 0 | 20183 | 0 |
| Mode M9 | |||
|---|---|---|---|
| Quadrant | BADHDUFLAG | Total packets | Discarded packets |
| A | 0 | 7 | 0 |
| B | 0 | 7 | 0 |
| C | 0 | 7 | 0 |
| D | 0 | 7 | 0 |
| Quadrant | Total seconds | Saturated seconds | Saturation percentage |
|---|---|---|---|
| A | 7718 | 107 | 1.386370% |
| B | 7706 | 131 | 1.699974% |
| C | 7735 | 135 | 1.745314% |
| D | 7712 | 507 | 6.574170% |
Noise dominated data is calculated using 1-second bins in cleaned event files. If a bin has >2000 counts, and if more than 50% of those come from <1% of pixels, then it is considered to be noise-dominated and hence unusable.
| Quadrant | # 1 sec bins | Bins with >0 counts | Bins with >2000 counts | High rate bins dominated by noise | Noise dominated (total time) | Noise dominated (detector-on time) | Marked lightcurve |
|---|---|---|---|---|---|---|---|
| A | 8469 | 7795 | 0 | 0 | 0.00% | 0.00% | 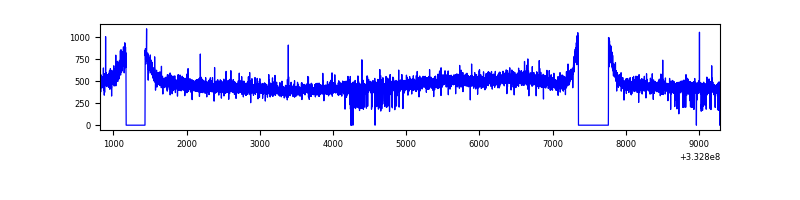 |
| B | 8470 | 7792 | 1 | 1 | 0.01% | 0.01% | 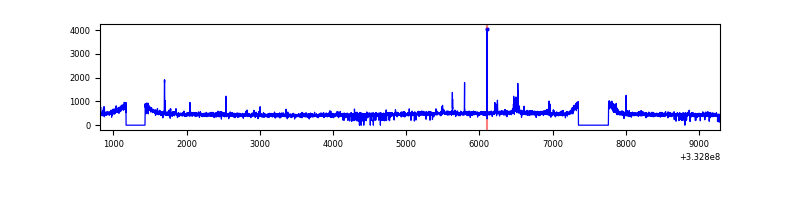 |
| C | 8470 | 7798 | 0 | 0 | 0.00% | 0.00% | 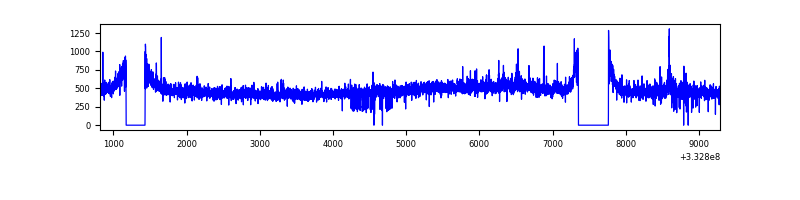 |
| D | 8469 | 7793 | 403 | 403 | 4.76% | 5.17% | 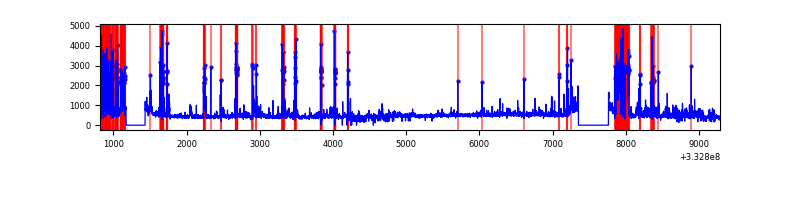 |
Top three noisy pixels from each quadrant. If the there are fewer than three noisy pixels in the level2.evt file, extra rows are filled as -1
| Pixel properties | Quadrant properties | ||||||
|---|---|---|---|---|---|---|---|
| Quadrant | DetID | PixID | Counts | Sigma | Mean | Median | Sigma |
| A | 13 | 254 | 12090 | 58.19 | 947 | 925 | 191.9 |
| A | 3 | 137 | 8945 | 41.8 | 947 | 925 | 191.9 |
| A | 0 | 226 | 8063 | 37.2 | 947 | 925 | 191.9 |
| B | 15 | 33 | 32951 | 178.11 | 933 | 908 | 179.9 |
| B | 12 | 111 | 22275 | 118.77 | 933 | 908 | 179.9 |
| B | 11 | 111 | 19782 | 104.91 | 933 | 908 | 179.9 |
| C | 14 | 238 | 144505 | 687.42 | 893 | 896 | 208.9 |
| C | 3 | 233 | 63393 | 299.16 | 893 | 896 | 208.9 |
| C | 0 | 207 | 51257 | 241.06 | 893 | 896 | 208.9 |
| D | 1 | 52 | 1637457 | 7771.01 | 881 | 859 | 210.6 |
| D | 12 | 233 | 51779 | 241.78 | 881 | 859 | 210.6 |
| D | 2 | 234 | 30934 | 142.8 | 881 | 859 | 210.6 |
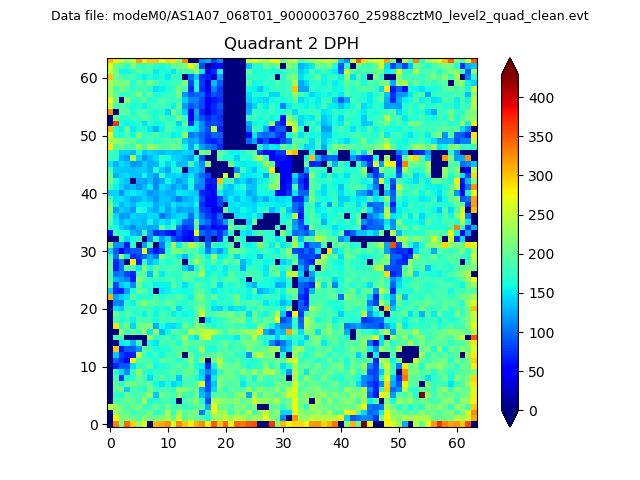
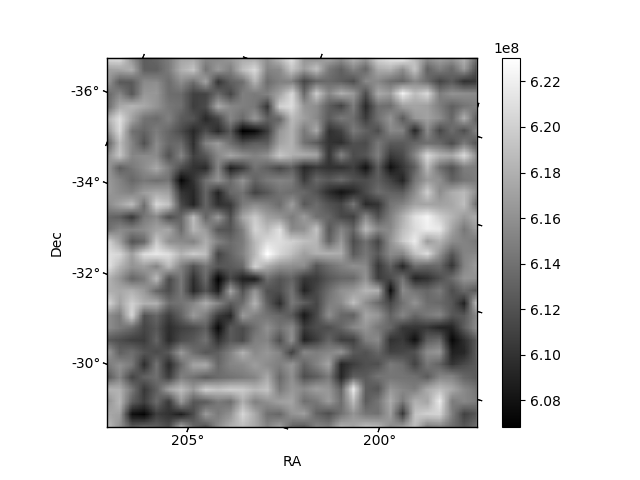
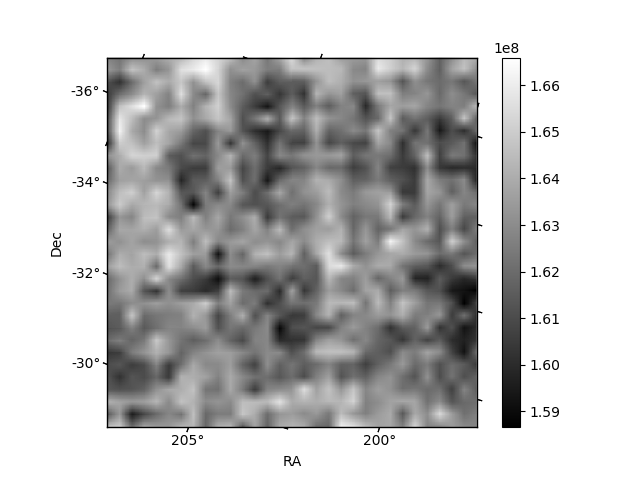
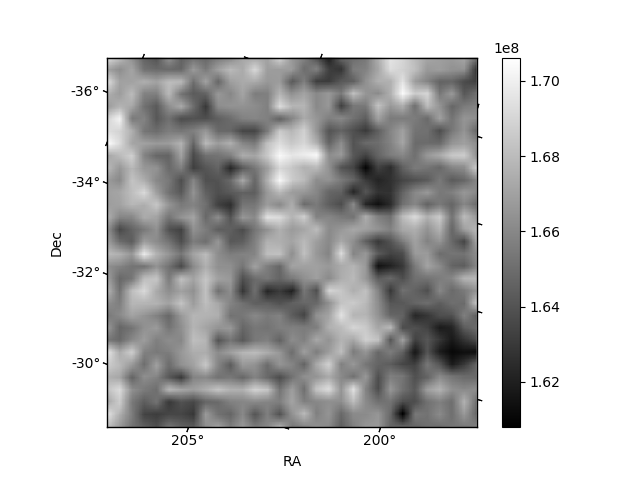
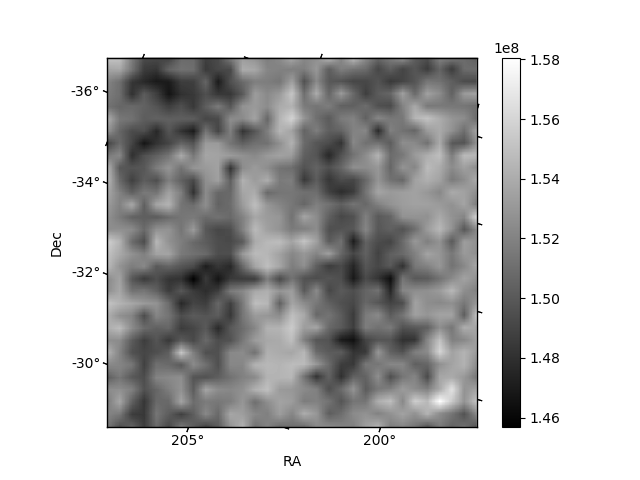
Histogram calculated using DETX and DETY for each event in the final _common_clean file
| Quadrant A | 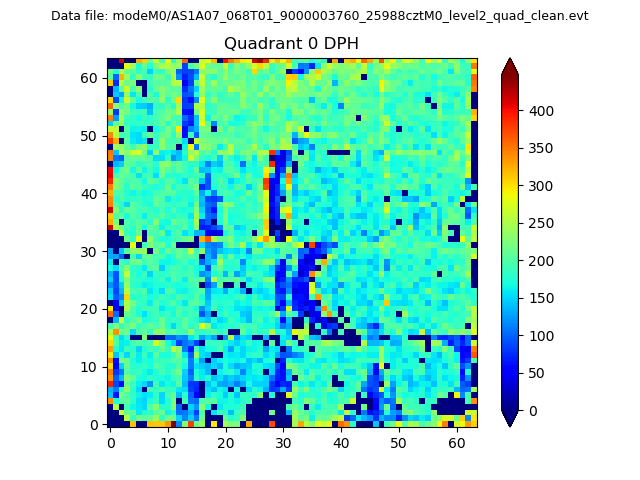 |
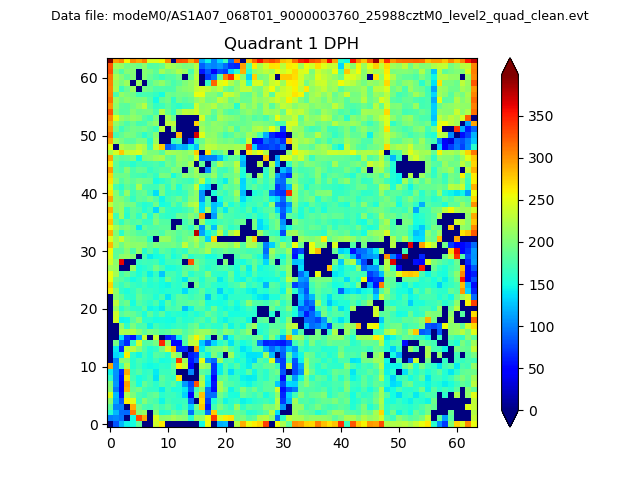 |
Quadrant B |
|---|---|---|---|
| Quadrant D | 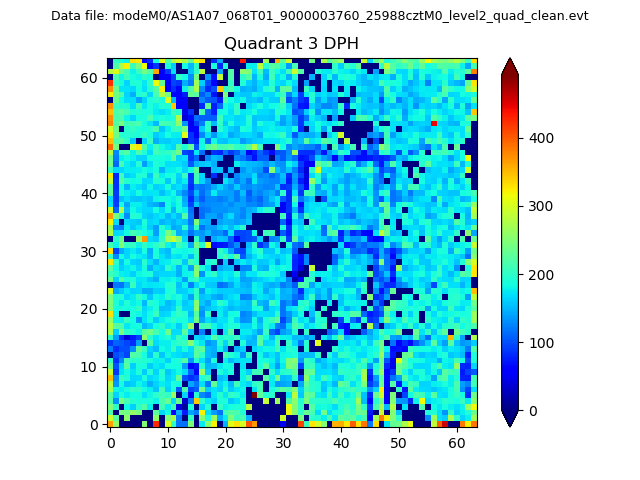 |
 |
Quadrant C |
| Plot type | Count rate plots | Images |
|---|---|---|
| Comparison with Poisson distribution Blue bars denote a histogram of data divided into 1 sec bins. Red curve is a Poisson curve with rate = median count rate of data. |
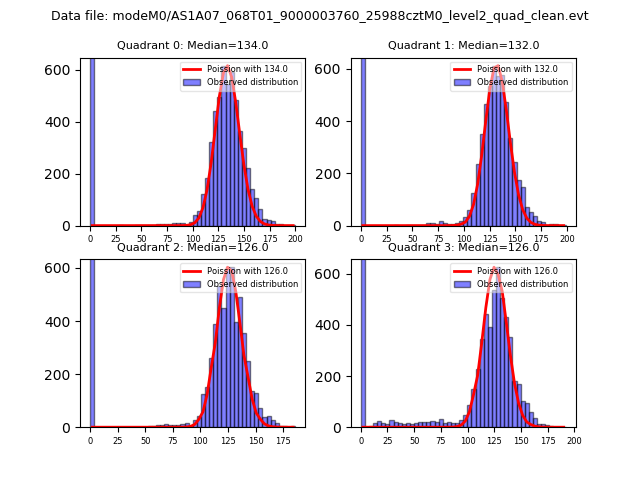 |
 |
| Quadrant-wise count rates Data is divided into 100 sec bins |
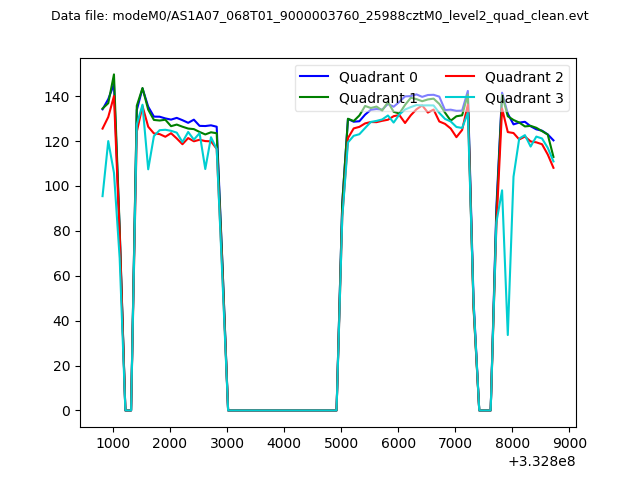 |
|
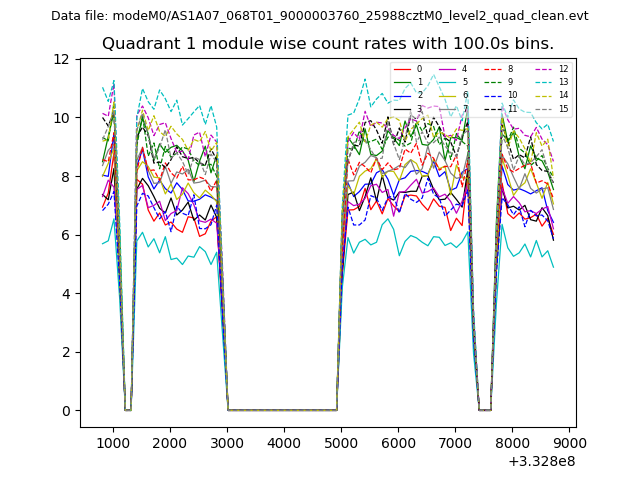
| Module-wise count rates for Quadrant A Data is divided into 100 sec bins |
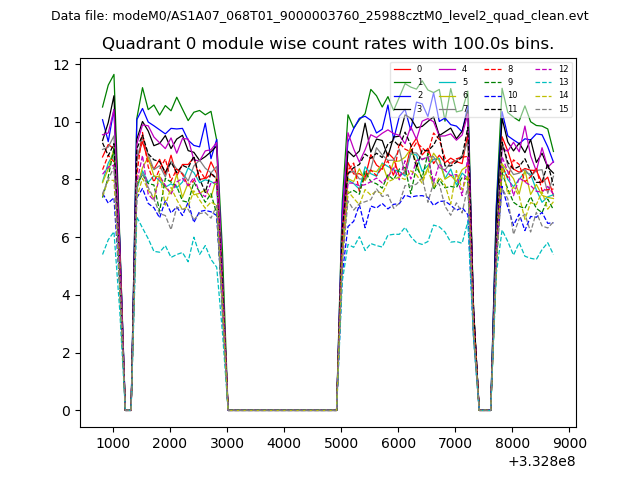 |
 |
| Module-wise count rates for Quadrant B Data is divided into 100 sec bins |
 |
 |
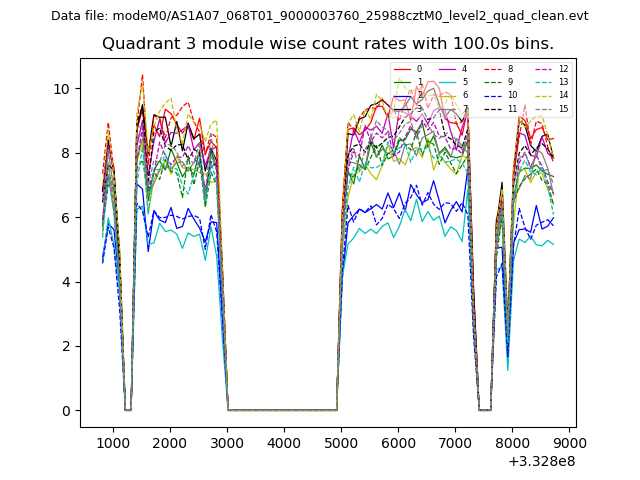
| Module-wise count rates for Quadrant C Data is divided into 100 sec bins |
 |
 |
| Module-wise count rates for Quadrant D Data is divided into 100 sec bins |
 |
 |
| Parameter | Plot |
|---|---|
| CZT HV Monitor |  |
| D_VDD | 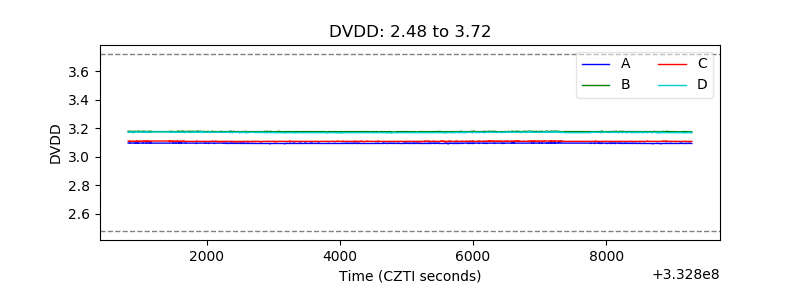 |
| Temperature 1 | 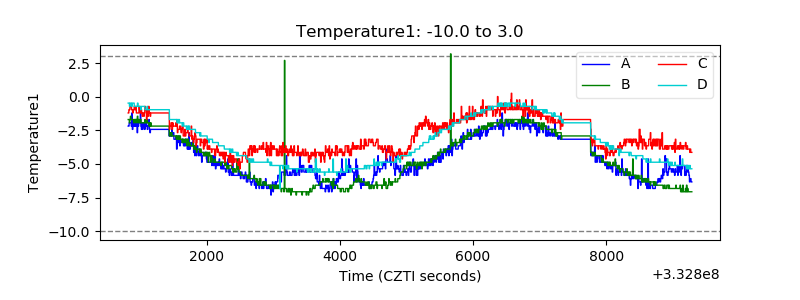 |
| Veto HV Monitor | 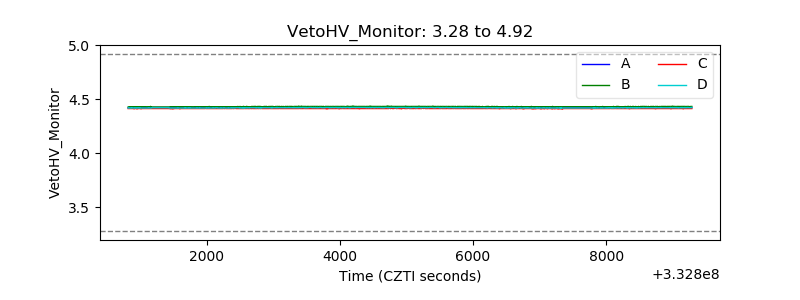 |
| Veto LLD | 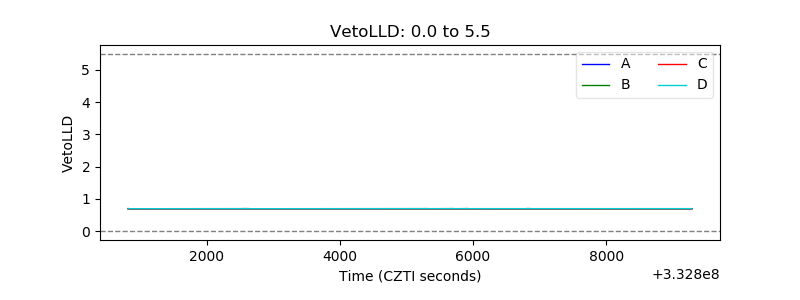 |
| Alpha Counter | 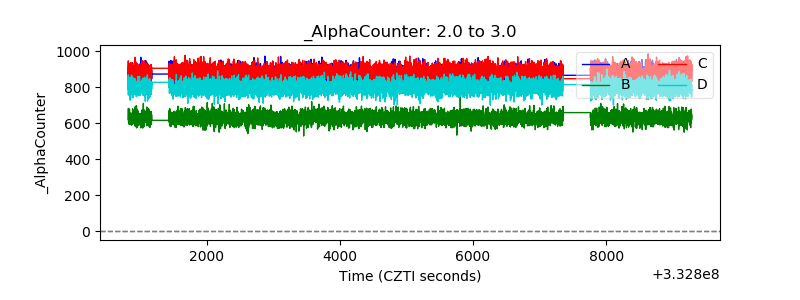 |
| _CPM_Rate | 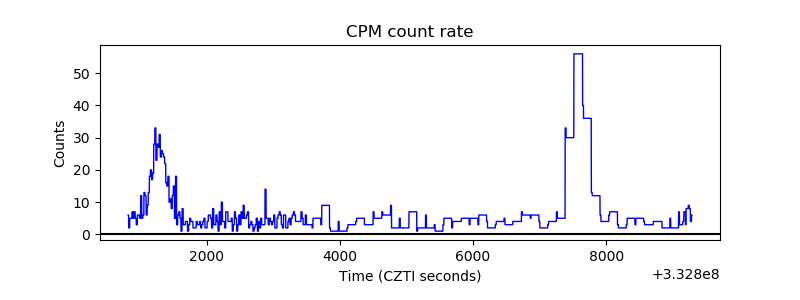 |
| CZT Counter | 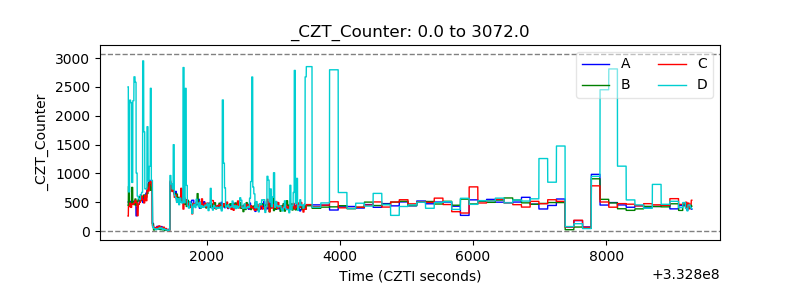 |
| +2.5 Volts monitor |  |
| +5 Volts monitor |  |
| _ROLL_ROT | 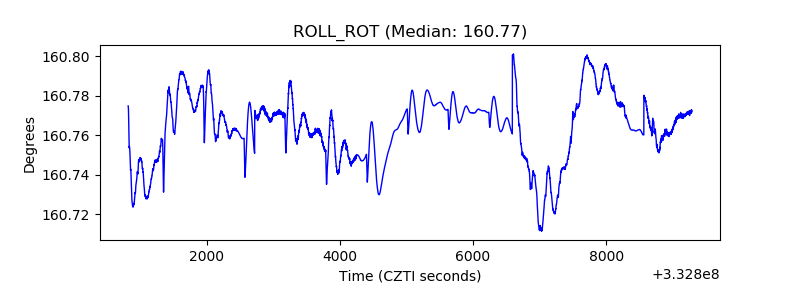 |
| _Roll_DEC | 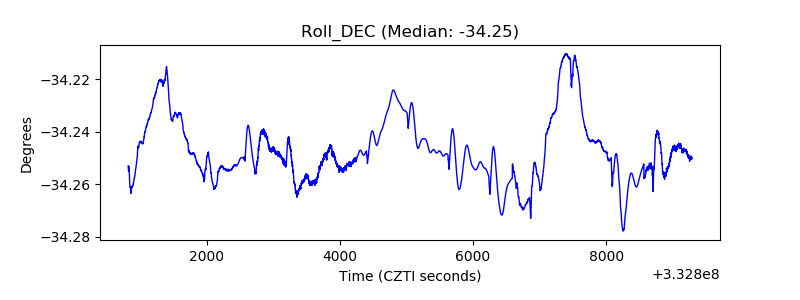 |
| _Roll_RA | 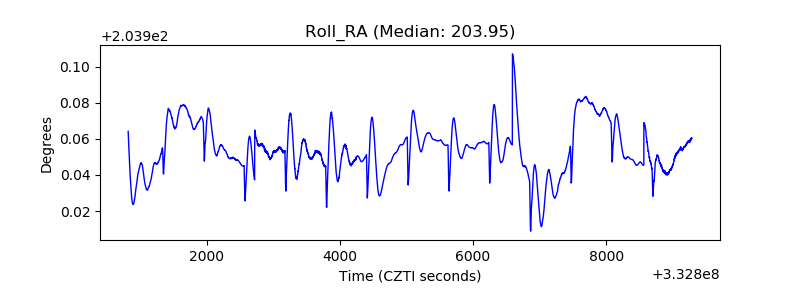 |
| Veto Counter | 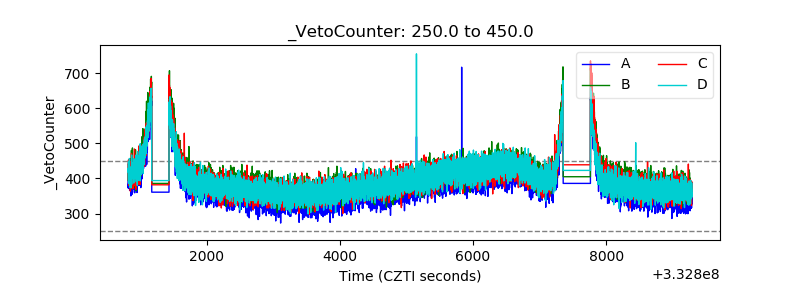 |