| Param | Original file | Final file |
|---|---|---|
| Filename | modeM0/AS1A07_068T01_9000003760_25990cztM0_level2.evt | modeM0/AS1A07_068T01_9000003760_25990cztM0_level2_quad_clean.evt |
| Size (bytes) | 253,848,960 | 38,099,520 |
| Size | 242.1 MB | 36.3 MB |
| Events in quadrant A | 1,717,370 | 229,849 |
| Events in quadrant B | 1,754,114 | 232,871 |
| Events in quadrant C | 1,745,017 | 215,759 |
| Events in quadrant D | 2,201,367 | 196,251 |
| Mode M0 | |||
|---|---|---|---|
| Quadrant | BADHDUFLAG | Total packets | Discarded packets |
| A | 0 | 7802 | 0 |
| B | 0 | 7815 | 0 |
| C | 0 | 7788 | 0 |
| D | 0 | 9179 | 0 |
| Mode M9 | |||
|---|---|---|---|
| Quadrant | BADHDUFLAG | Total packets | Discarded packets |
| A | 0 | 12 | 5 |
| B | 0 | 11 | 1 |
| C | 0 | 11 | 3 |
| D | 0 | 12 | 6 |
| Quadrant | Total seconds | Saturated seconds | Saturation percentage |
|---|---|---|---|
| A | 3846 | 8 | 0.208008% |
| B | 3848 | 19 | 0.493763% |
| C | 3830 | 26 | 0.678851% |
| D | 3762 | 154 | 4.093567% |
Noise dominated data is calculated using 1-second bins in cleaned event files. If a bin has >2000 counts, and if more than 50% of those come from <1% of pixels, then it is considered to be noise-dominated and hence unusable.
| Quadrant | # 1 sec bins | Bins with >0 counts | Bins with >2000 counts | High rate bins dominated by noise | Noise dominated (total time) | Noise dominated (detector-on time) | Marked lightcurve |
|---|---|---|---|---|---|---|---|
| A | 10243 | 4138 | 0 | 0 | 0.00% | 0.00% | 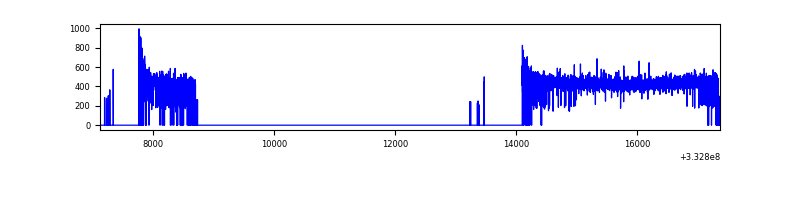 |
| B | 10145 | 4118 | 0 | 0 | 0.00% | 0.00% | 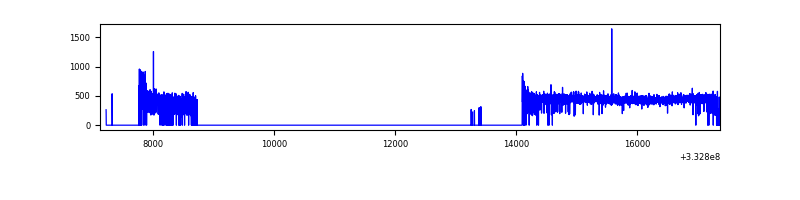 |
| C | 10142 | 4107 | 0 | 0 | 0.00% | 0.00% | 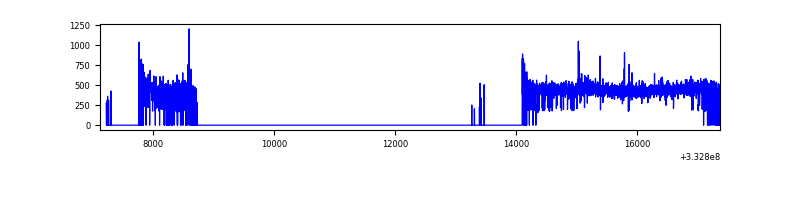 |
| D | 10141 | 4069 | 128 | 128 | 1.26% | 3.15% | 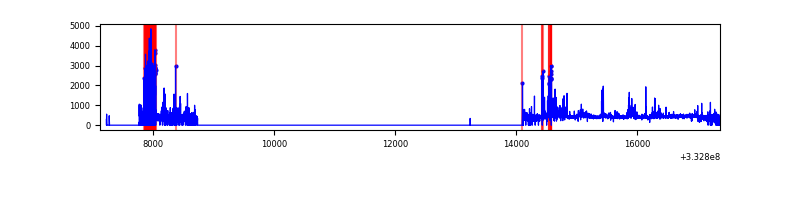 |
Top three noisy pixels from each quadrant. If the there are fewer than three noisy pixels in the level2.evt file, extra rows are filled as -1
| Pixel properties | Quadrant properties | ||||||
|---|---|---|---|---|---|---|---|
| Quadrant | DetID | PixID | Counts | Sigma | Mean | Median | Sigma |
| A | 13 | 254 | 5906 | 59.7 | 445 | 435 | 91.6 |
| A | 3 | 137 | 4240 | 41.52 | 445 | 435 | 91.6 |
| A | 0 | 226 | 3695 | 35.57 | 445 | 435 | 91.6 |
| B | 12 | 111 | 10999 | 121.75 | 446 | 435 | 86.8 |
| B | 11 | 111 | 9563 | 105.2 | 446 | 435 | 86.8 |
| B | 14 | 111 | 9138 | 100.3 | 446 | 435 | 86.8 |
| C | 14 | 238 | 67758 | 666.34 | 423 | 426 | 101.0 |
| C | 3 | 233 | 20944 | 203.05 | 423 | 426 | 101.0 |
| C | 2 | 16 | 8678 | 81.67 | 423 | 426 | 101.0 |
| D | 1 | 52 | 652741 | 6588.63 | 406 | 395 | 99.0 |
| D | 2 | 234 | 13214 | 129.47 | 406 | 395 | 99.0 |
| D | 12 | 233 | 5089 | 47.41 | 406 | 395 | 99.0 |
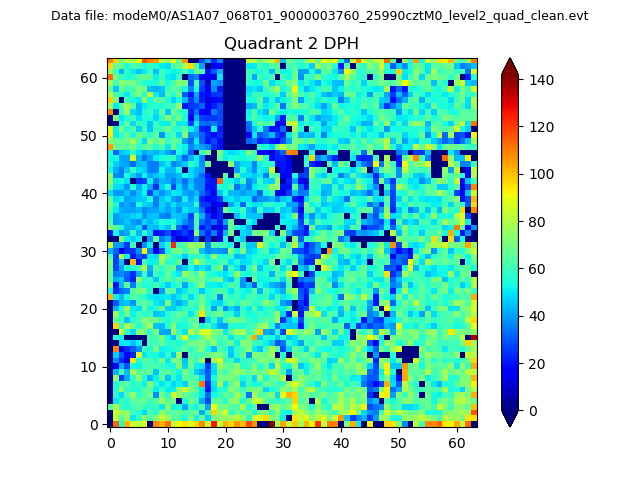
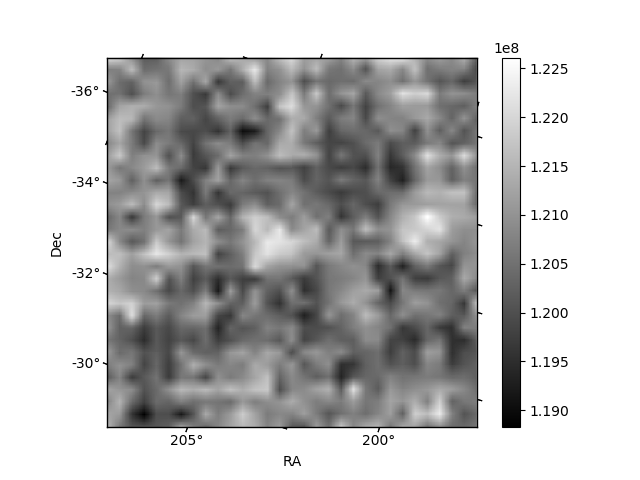
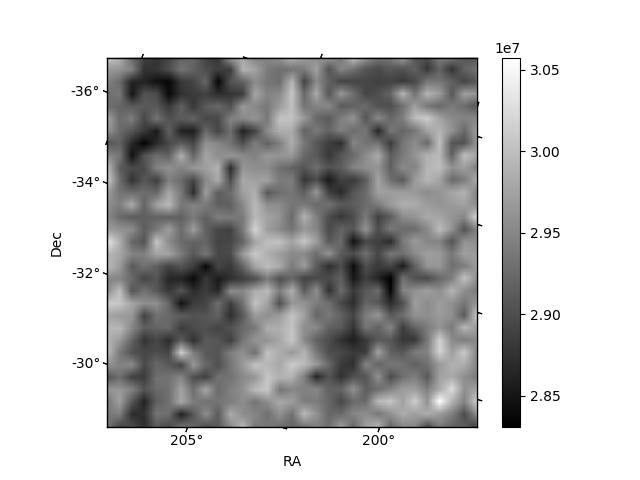
Histogram calculated using DETX and DETY for each event in the final _common_clean file
| Quadrant A | 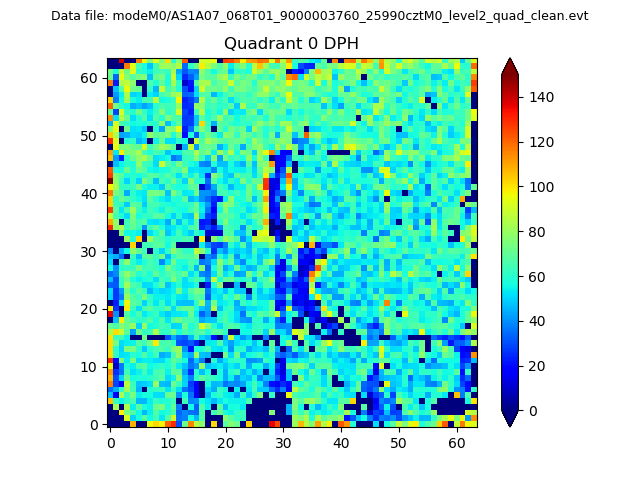 |
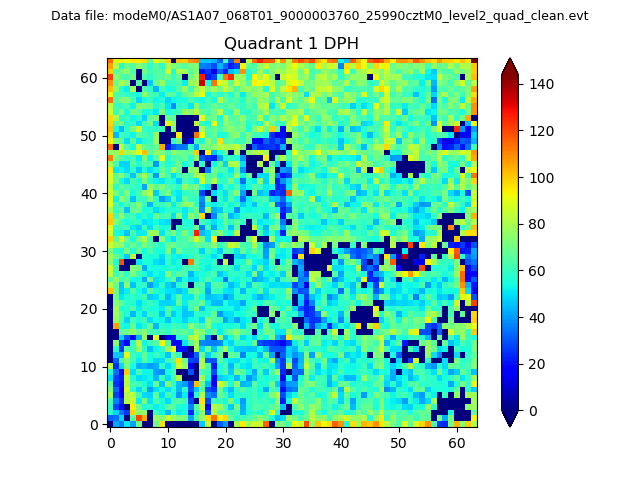 |
Quadrant B |
|---|---|---|---|
| Quadrant D | 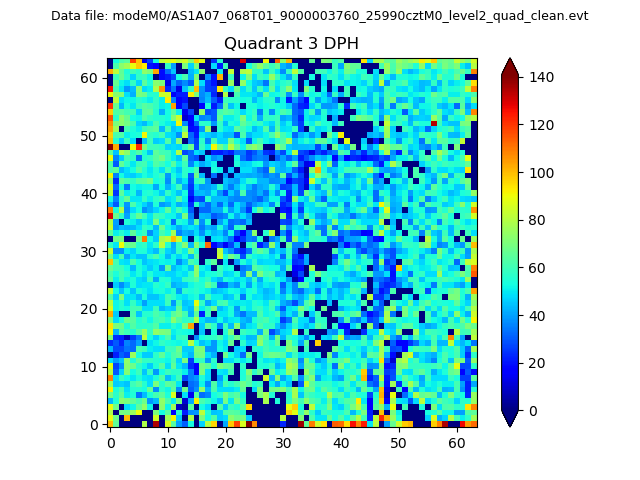 |
 |
Quadrant C |
| Plot type | Count rate plots | Images |
|---|---|---|
| Comparison with Poisson distribution Blue bars denote a histogram of data divided into 1 sec bins. Red curve is a Poisson curve with rate = median count rate of data. |
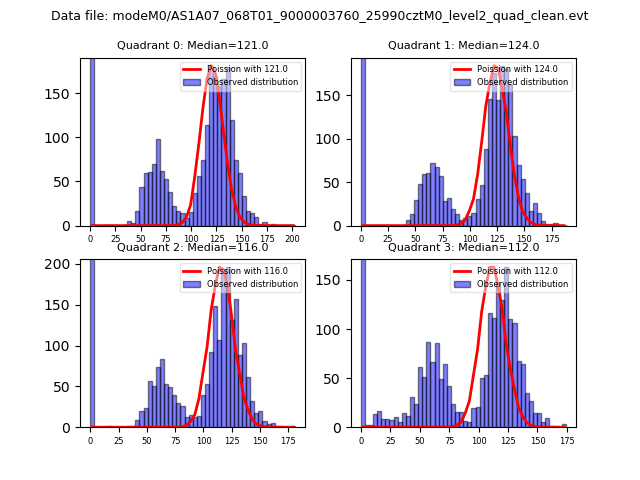 |
 |
| Quadrant-wise count rates Data is divided into 100 sec bins |
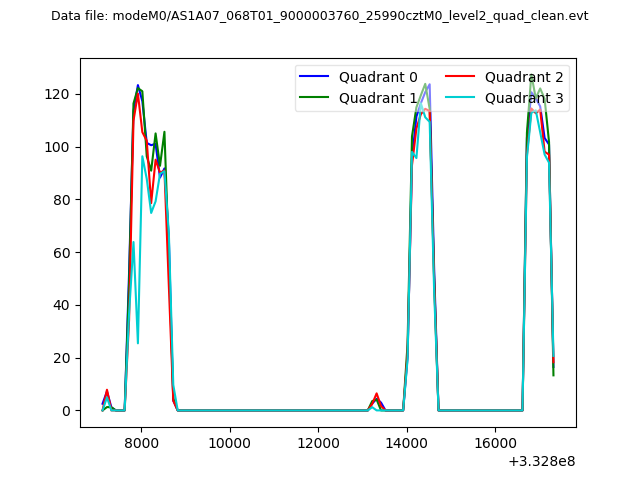 |
|
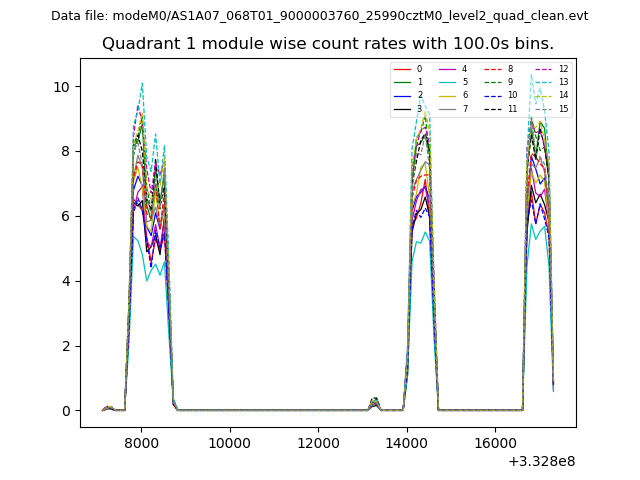
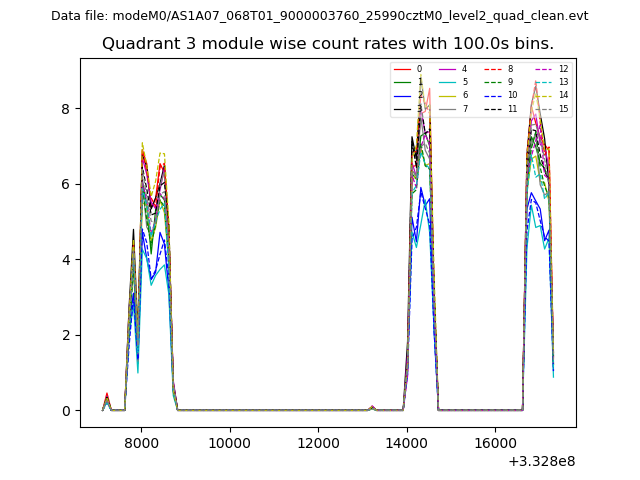
| Module-wise count rates for Quadrant A Data is divided into 100 sec bins |
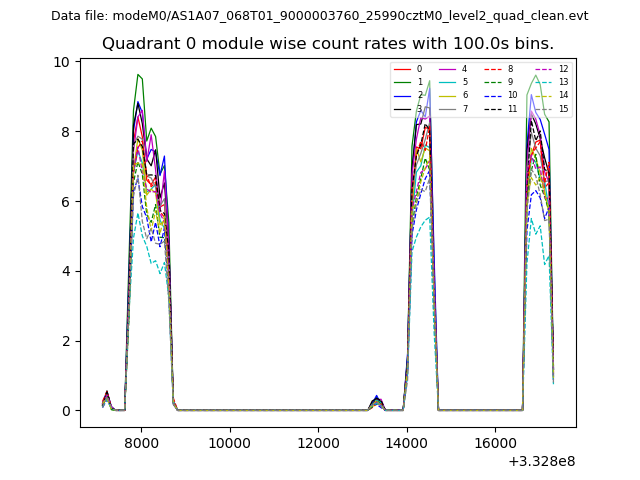 |
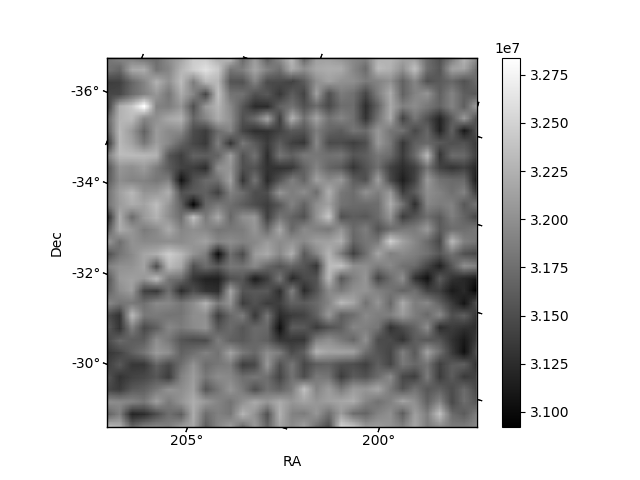 |
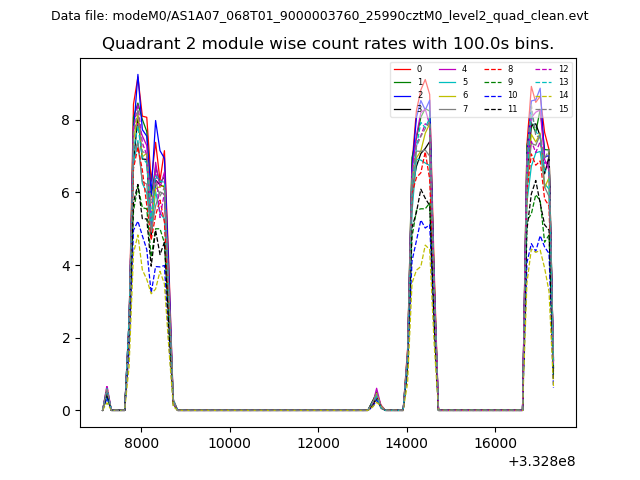
| Module-wise count rates for Quadrant B Data is divided into 100 sec bins |
 |
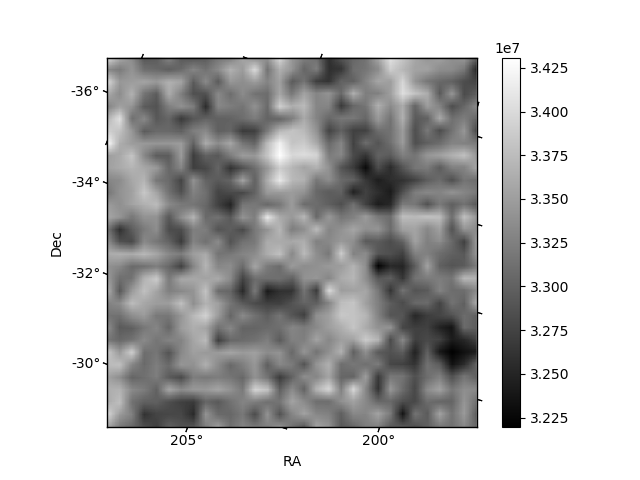 |
| Module-wise count rates for Quadrant C Data is divided into 100 sec bins |
 |
 |
| Module-wise count rates for Quadrant D Data is divided into 100 sec bins |
 |
 |
| Parameter | Plot |
|---|---|
| CZT HV Monitor | 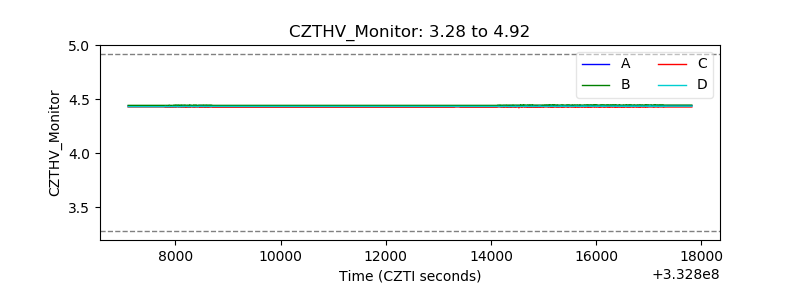 |
| D_VDD | 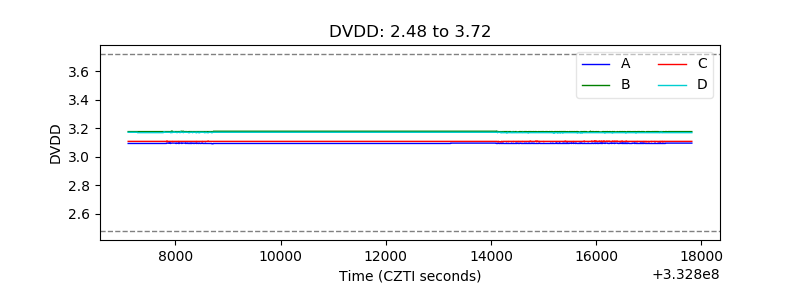 |
| Temperature 1 | 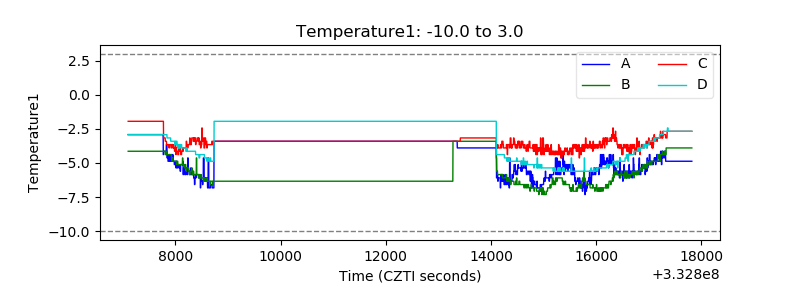 |
| Veto HV Monitor |  |
| Veto LLD | 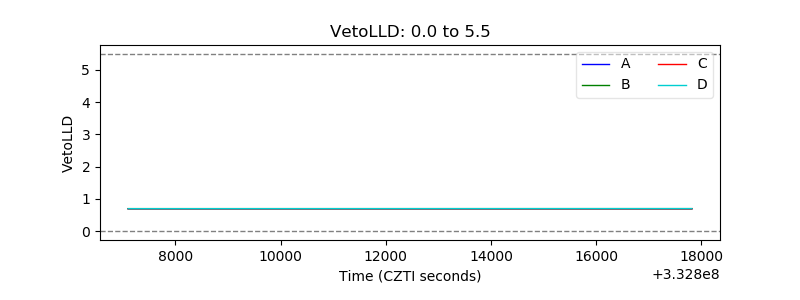 |
| Alpha Counter | 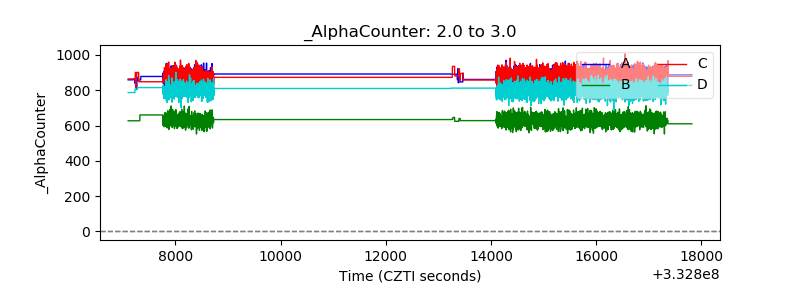 |
| _CPM_Rate | 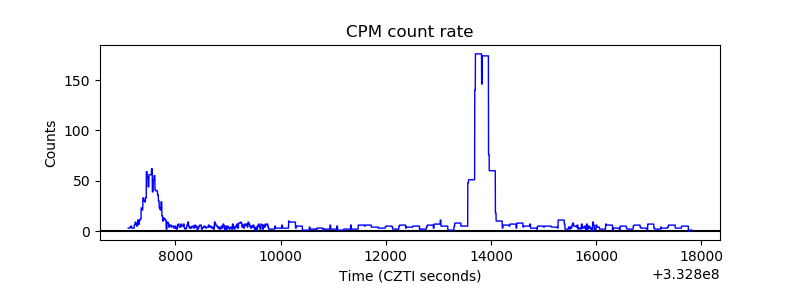 |
| CZT Counter | 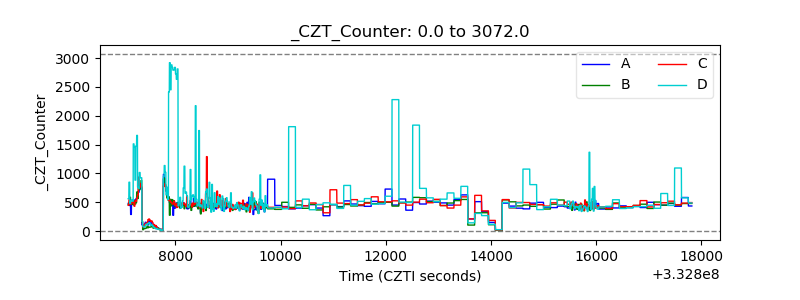 |
| +2.5 Volts monitor |  |
| +5 Volts monitor | 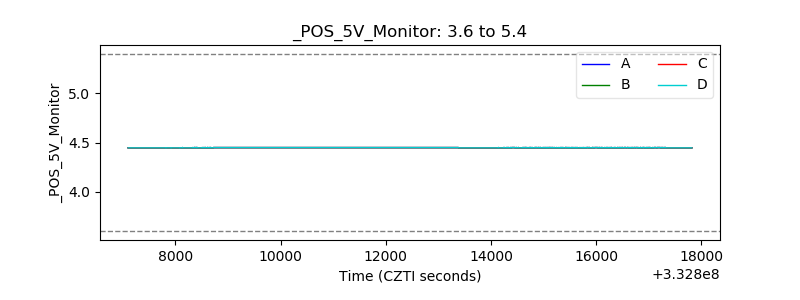 |
| _ROLL_ROT | 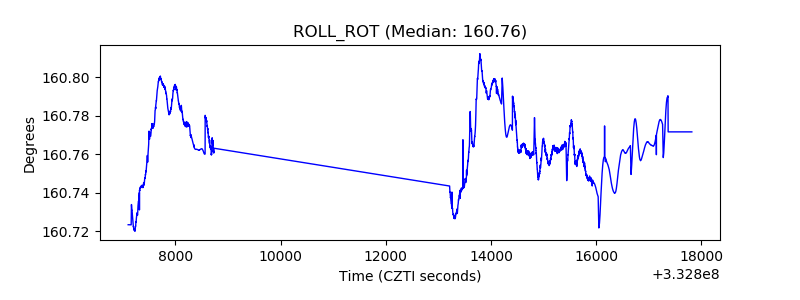 |
| _Roll_DEC | 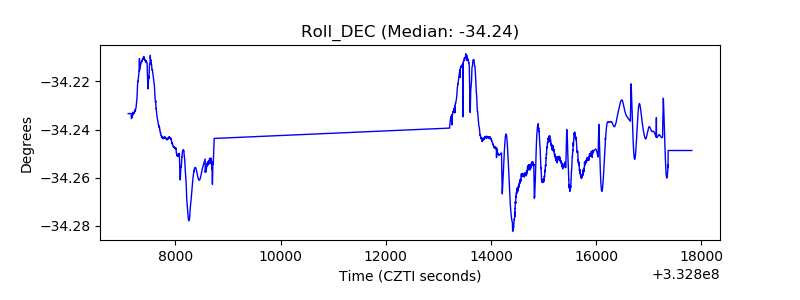 |
| _Roll_RA | 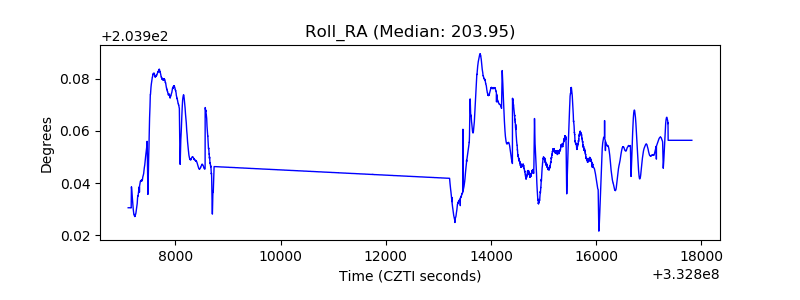 |
| Veto Counter | 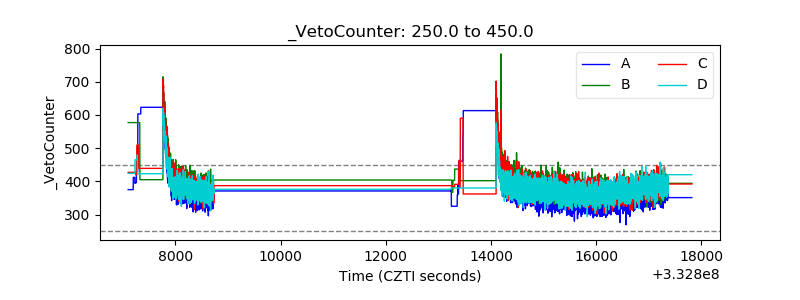 |