| Param | Original file | Final file |
|---|---|---|
| Filename | modeM0/AS1A07_068T01_9000003760_25992cztM0_level2.evt | modeM0/AS1A07_068T01_9000003760_25992cztM0_level2_quad_clean.evt |
| Size (bytes) | 3,191,091,840 | 567,604,800 |
| Size | 3.0 GB | 541.3 MB |
| Events in quadrant A | 22,130,051 | 3,625,285 |
| Events in quadrant B | 21,616,492 | 3,629,260 |
| Events in quadrant C | 21,443,987 | 3,456,857 |
| Events in quadrant D | 28,428,314 | 3,404,427 |
| Mode M0 | |||
|---|---|---|---|
| Quadrant | BADHDUFLAG | Total packets | Discarded packets |
| A | 0 | 94727 | 0 |
| B | 0 | 92814 | 0 |
| C | 0 | 92323 | 0 |
| D | 0 | 114362 | 0 |
| Mode M9 | |||
|---|---|---|---|
| Quadrant | BADHDUFLAG | Total packets | Discarded packets |
| A | 0 | 53 | 0 |
| B | 0 | 53 | 0 |
| C | 0 | 53 | 0 |
| D | 0 | 53 | 0 |
| Quadrant | Total seconds | Saturated seconds | Saturation percentage |
|---|---|---|---|
| A | 44783 | 459 | 1.024943% |
| B | 44778 | 368 | 0.821832% |
| C | 44780 | 483 | 1.078607% |
| D | 44775 | 1693 | 3.781128% |
Noise dominated data is calculated using 1-second bins in cleaned event files. If a bin has >2000 counts, and if more than 50% of those come from <1% of pixels, then it is considered to be noise-dominated and hence unusable.
| Quadrant | # 1 sec bins | Bins with >0 counts | Bins with >2000 counts | High rate bins dominated by noise | Noise dominated (total time) | Noise dominated (detector-on time) | Marked lightcurve |
|---|---|---|---|---|---|---|---|
| A | 50787 | 44826 | 109 | 109 | 0.21% | 0.24% | 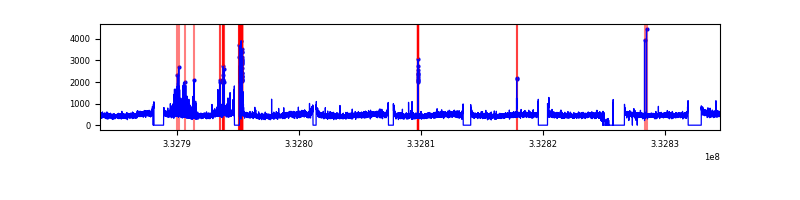 |
| B | 50787 | 44813 | 14 | 14 | 0.03% | 0.03% | 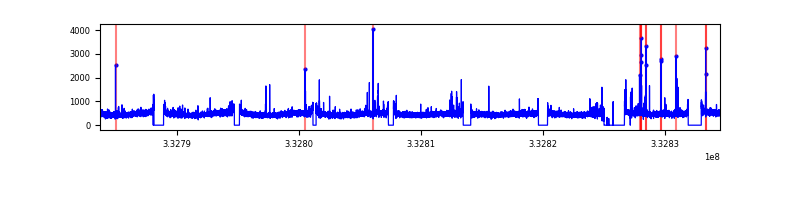 |
| C | 50787 | 44815 | 2 | 2 | 0.00% | 0.00% | 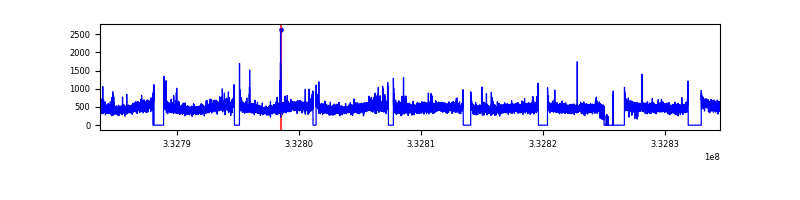 |
| D | 50788 | 44814 | 1348 | 1348 | 2.65% | 3.01% | 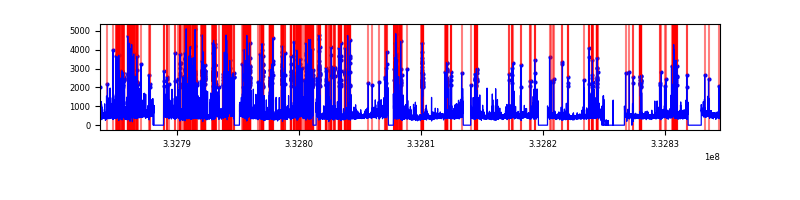 |
Top three noisy pixels from each quadrant. If the there are fewer than three noisy pixels in the level2.evt file, extra rows are filled as -1
| Pixel properties | Quadrant properties | ||||||
|---|---|---|---|---|---|---|---|
| Quadrant | DetID | PixID | Counts | Sigma | Mean | Median | Sigma |
| A | 0 | 13 | 971688 | 887.25 | 5474 | 5360 | 1089.1 |
| A | 8 | 255 | 74248 | 63.25 | 5474 | 5360 | 1089.1 |
| A | 13 | 254 | 65523 | 55.24 | 5474 | 5360 | 1089.1 |
| B | 10 | 245 | 184673 | 175.28 | 5416 | 5280 | 1023.5 |
| B | 12 | 111 | 128829 | 120.71 | 5416 | 5280 | 1023.5 |
| B | 11 | 111 | 115506 | 107.7 | 5416 | 5280 | 1023.5 |
| C | 14 | 238 | 841964 | 695.72 | 5191 | 5224 | 1202.7 |
| C | 3 | 233 | 189328 | 153.08 | 5191 | 5224 | 1202.7 |
| C | 0 | 207 | 174438 | 140.7 | 5191 | 5224 | 1202.7 |
| D | 1 | 52 | 6716975 | 5441.36 | 5201 | 5073 | 1233.5 |
| D | 12 | 233 | 1369325 | 1106.0 | 5201 | 5073 | 1233.5 |
| D | 7 | 80 | 367359 | 293.71 | 5201 | 5073 | 1233.5 |
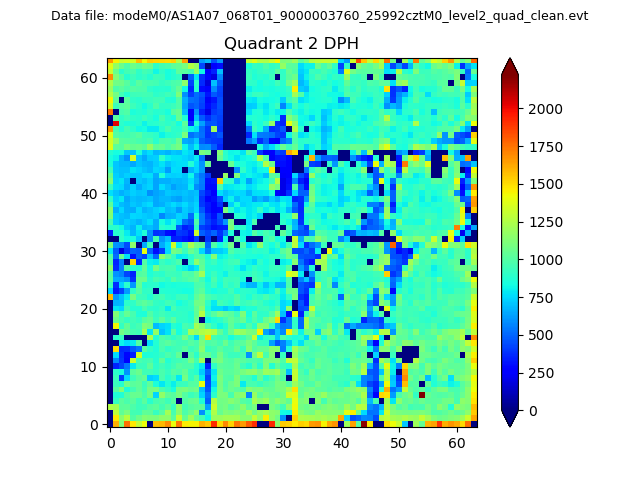
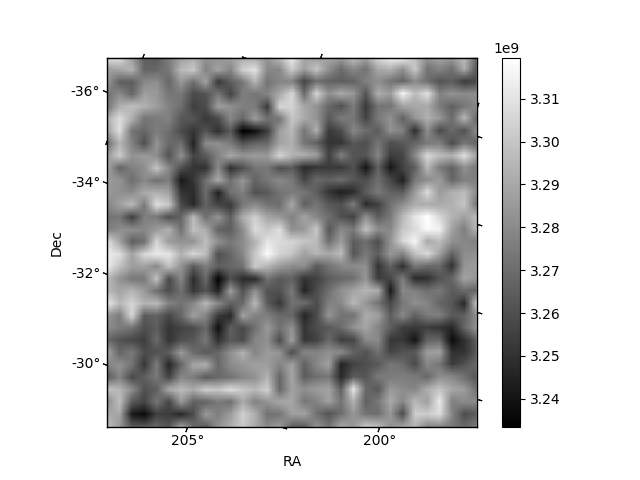
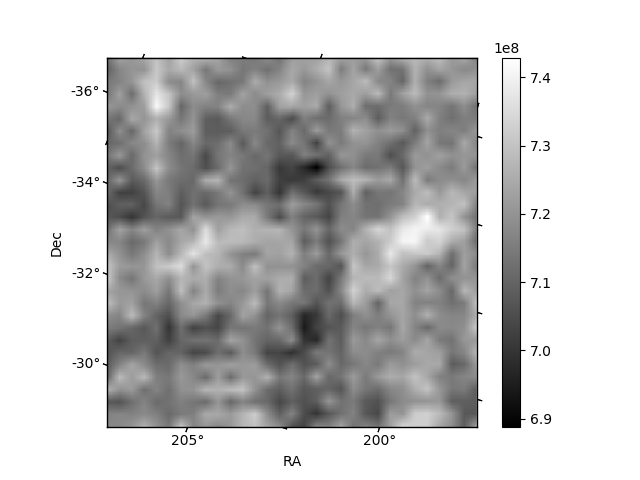
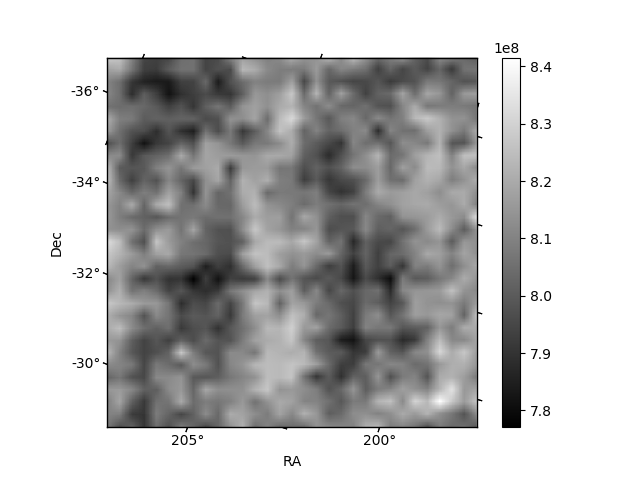
Histogram calculated using DETX and DETY for each event in the final _common_clean file
| Quadrant A | 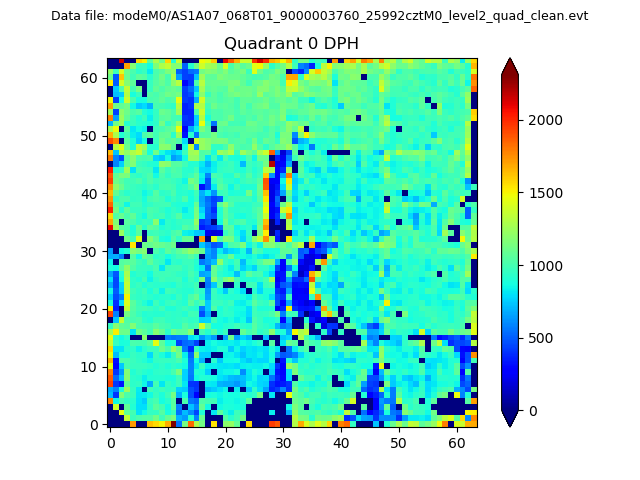 |
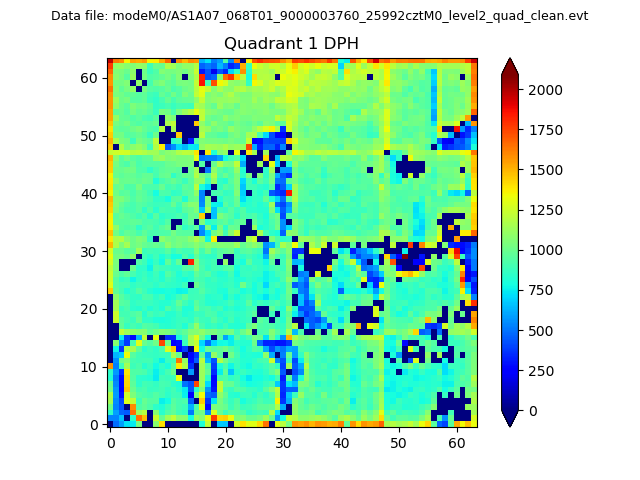 |
Quadrant B |
|---|---|---|---|
| Quadrant D | 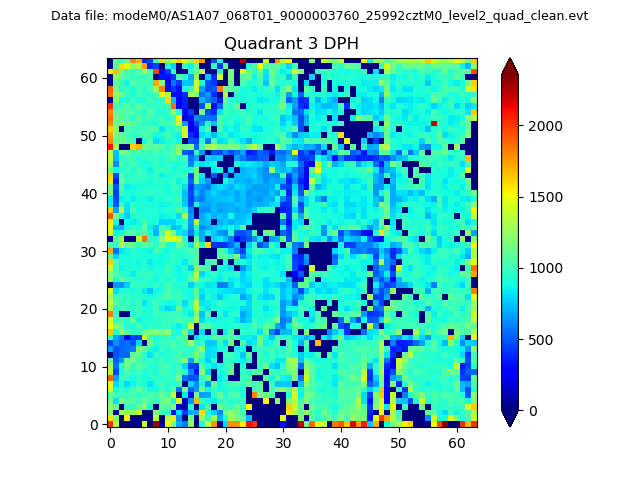 |
 |
Quadrant C |
| Plot type | Count rate plots | Images |
|---|---|---|
| Comparison with Poisson distribution Blue bars denote a histogram of data divided into 1 sec bins. Red curve is a Poisson curve with rate = median count rate of data. |
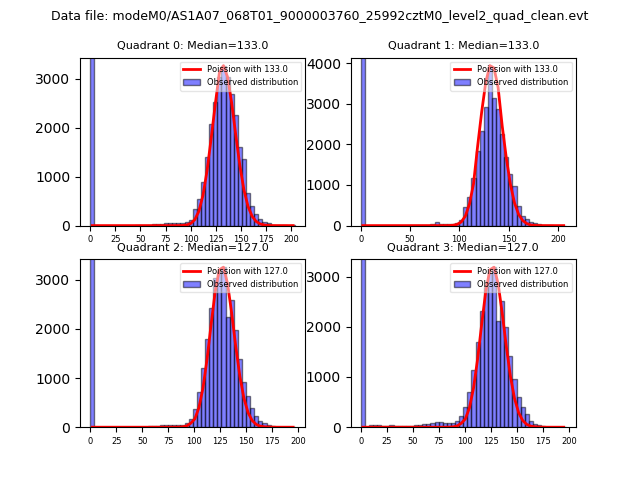 |
 |
| Quadrant-wise count rates Data is divided into 100 sec bins |
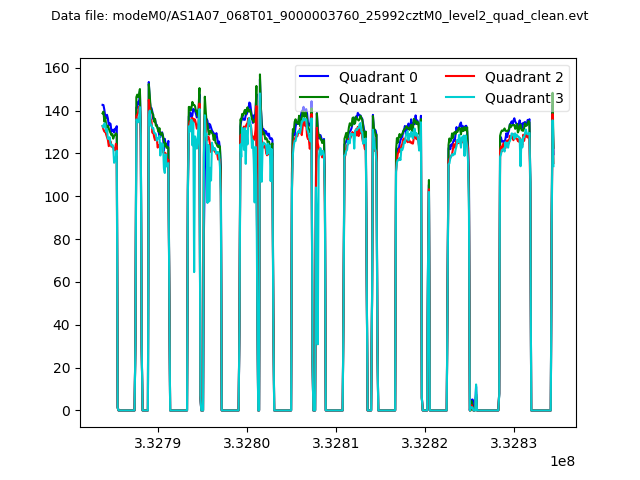 |
|
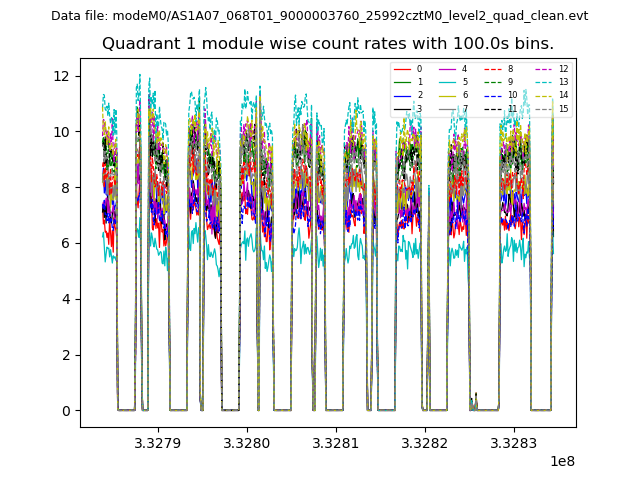
| Module-wise count rates for Quadrant A Data is divided into 100 sec bins |
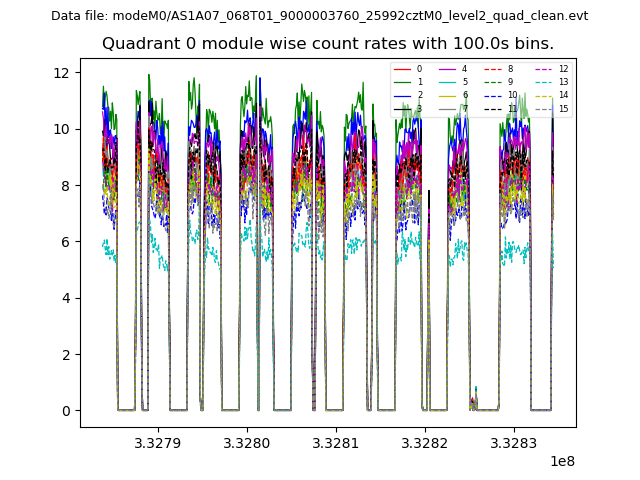 |
 |
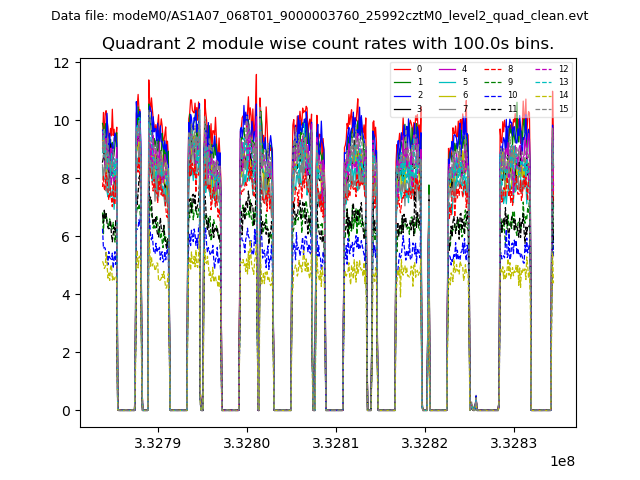
| Module-wise count rates for Quadrant B Data is divided into 100 sec bins |
 |
 |
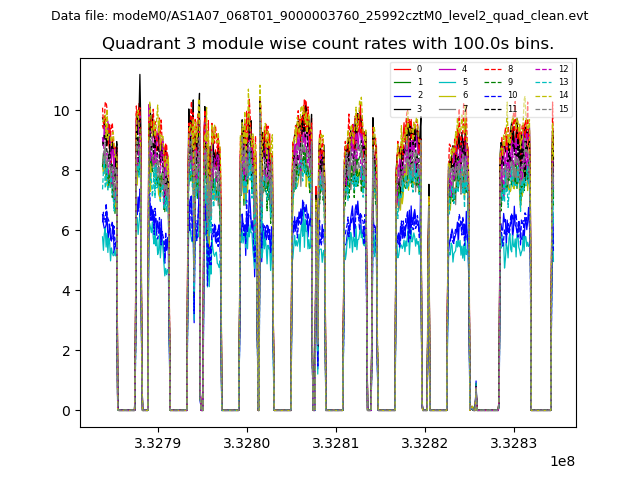
| Module-wise count rates for Quadrant C Data is divided into 100 sec bins |
 |
 |
| Module-wise count rates for Quadrant D Data is divided into 100 sec bins |
 |
 |
| Parameter | Plot |
|---|---|
| CZT HV Monitor | 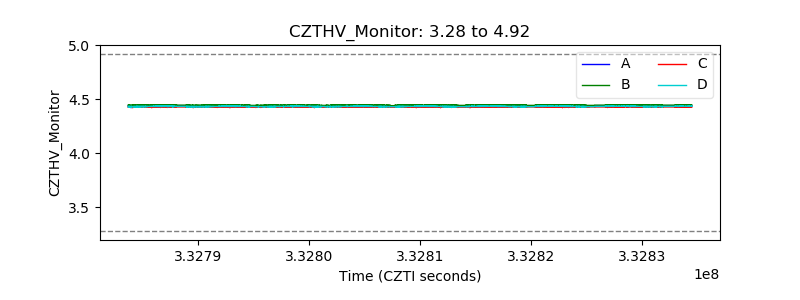 |
| D_VDD | 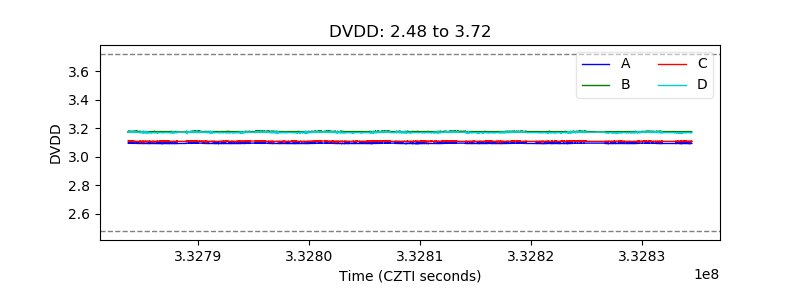 |
| Temperature 1 |  |
| Veto HV Monitor | 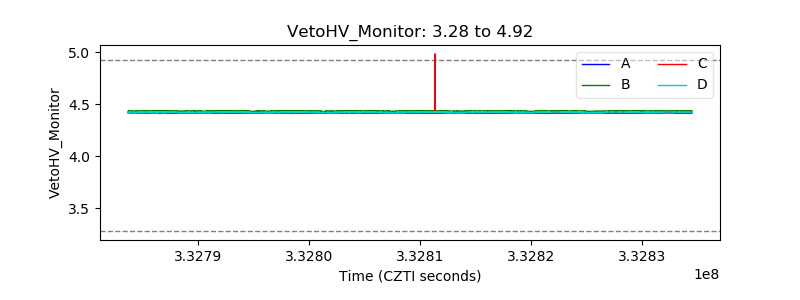 |
| Veto LLD | 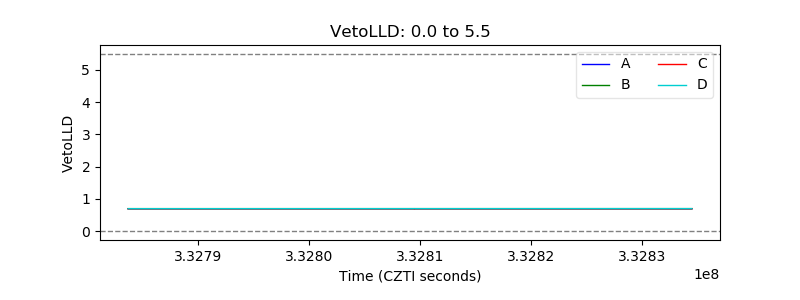 |
| Alpha Counter | 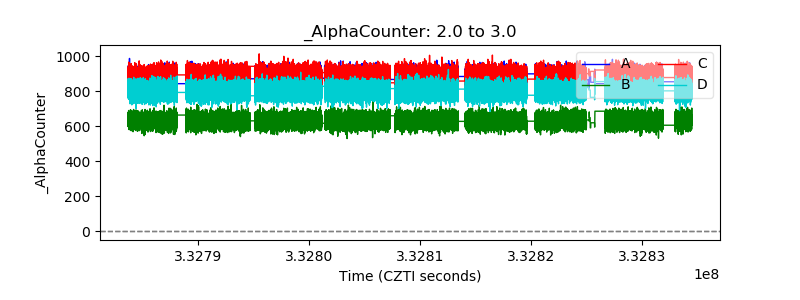 |
| _CPM_Rate | 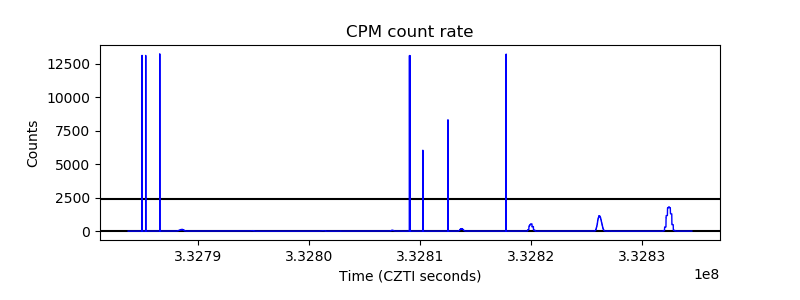 |
| CZT Counter | 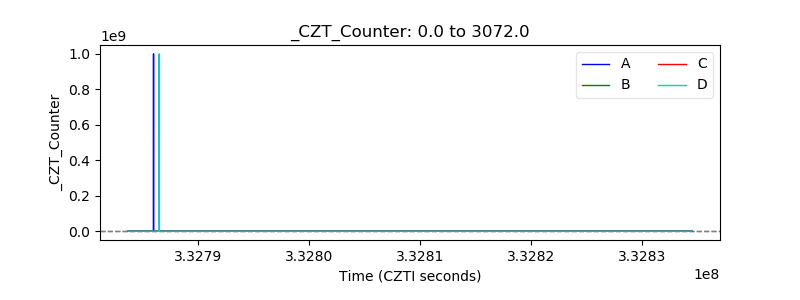 |
| +2.5 Volts monitor |  |
| +5 Volts monitor | 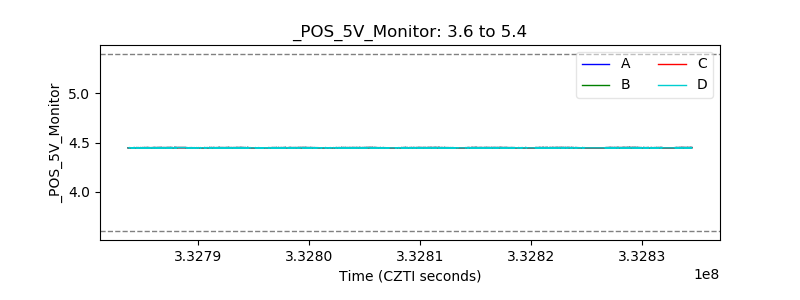 |
| _ROLL_ROT | 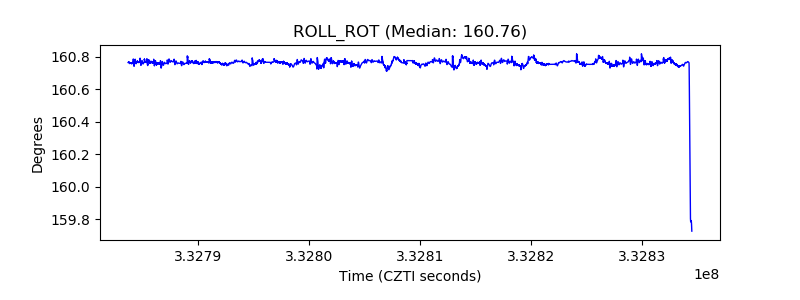 |
| _Roll_DEC |  |
| _Roll_RA | 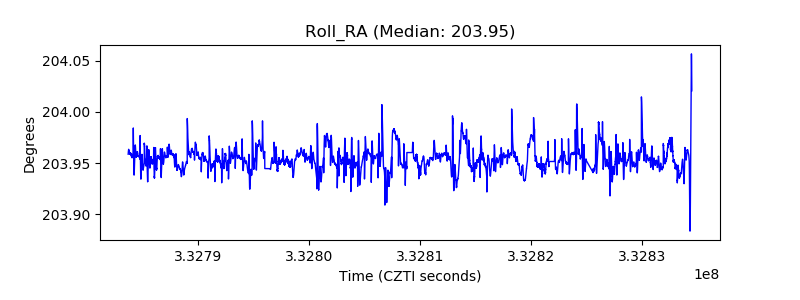 |
| Veto Counter | 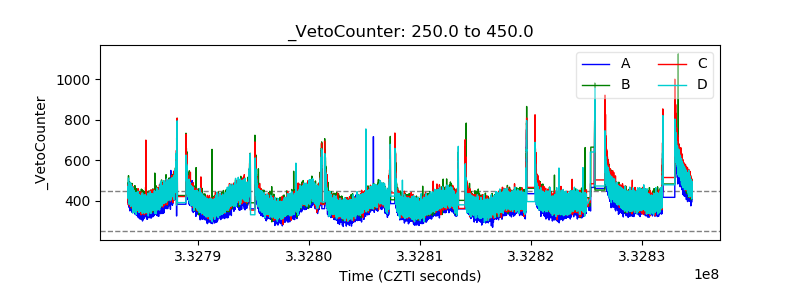 |