| Param | Original file | Final file |
|---|---|---|
| Filename | modeM0/AS1A07_068T01_9000003760_25994cztM0_level2.evt | modeM0/AS1A07_068T01_9000003760_25994cztM0_level2_quad_clean.evt |
| Size (bytes) | 800,297,280 | 167,253,120 |
| Size | 763.2 MB | 159.5 MB |
| Events in quadrant A | 5,684,234 | 1,094,389 |
| Events in quadrant B | 5,863,362 | 1,094,671 |
| Events in quadrant C | 5,715,301 | 1,045,438 |
| Events in quadrant D | 6,208,083 | 1,048,417 |
| Mode M0 | |||
|---|---|---|---|
| Quadrant | BADHDUFLAG | Total packets | Discarded packets |
| A | 0 | 23982 | 0 |
| B | 0 | 24473 | 0 |
| C | 0 | 24122 | 0 |
| D | 0 | 25536 | 0 |
| Mode M9 | |||
|---|---|---|---|
| Quadrant | BADHDUFLAG | Total packets | Discarded packets |
| A | 0 | 23 | 0 |
| B | 0 | 23 | 0 |
| C | 0 | 23 | 0 |
| D | 0 | 23 | 0 |
| Quadrant | Total seconds | Saturated seconds | Saturation percentage |
|---|---|---|---|
| A | 11316 | 82 | 0.724638% |
| B | 11316 | 129 | 1.139979% |
| C | 11316 | 170 | 1.502298% |
| D | 11316 | 145 | 1.281372% |
Noise dominated data is calculated using 1-second bins in cleaned event files. If a bin has >2000 counts, and if more than 50% of those come from <1% of pixels, then it is considered to be noise-dominated and hence unusable.
| Quadrant | # 1 sec bins | Bins with >0 counts | Bins with >2000 counts | High rate bins dominated by noise | Noise dominated (total time) | Noise dominated (detector-on time) | Marked lightcurve |
|---|---|---|---|---|---|---|---|
| A | 13561 | 11317 | 2 | 2 | 0.01% | 0.02% |  |
| B | 13561 | 11317 | 11 | 11 | 0.08% | 0.10% |  |
| C | 13561 | 11317 | 0 | 0 | 0.00% | 0.00% |  |
| D | 13561 | 11318 | 71 | 71 | 0.52% | 0.63% |  |
Top three noisy pixels from each quadrant. If the there are fewer than three noisy pixels in the level2.evt file, extra rows are filled as -1
| Pixel properties | Quadrant properties | ||||||
|---|---|---|---|---|---|---|---|
| Quadrant | DetID | PixID | Counts | Sigma | Mean | Median | Sigma |
| A | 13 | 254 | 15737 | 48.95 | 1473 | 1448 | 291.9 |
| A | 3 | 137 | 13075 | 39.83 | 1473 | 1448 | 291.9 |
| A | 0 | 226 | 12628 | 38.3 | 1473 | 1448 | 291.9 |
| B | 10 | 245 | 160275 | 584.29 | 1447 | 1411 | 271.9 |
| B | 12 | 111 | 32928 | 115.92 | 1447 | 1411 | 271.9 |
| B | 11 | 111 | 30005 | 105.17 | 1447 | 1411 | 271.9 |
| C | 14 | 238 | 230086 | 704.16 | 1402 | 1410 | 324.7 |
| C | 3 | 233 | 11980 | 32.55 | 1402 | 1410 | 324.7 |
| C | 0 | 207 | 10711 | 28.64 | 1402 | 1410 | 324.7 |
| D | 1 | 52 | 453087 | 1342.61 | 1424 | 1390 | 336.4 |
| D | 7 | 80 | 310005 | 917.32 | 1424 | 1390 | 336.4 |
| D | 12 | 233 | 55417 | 160.59 | 1424 | 1390 | 336.4 |
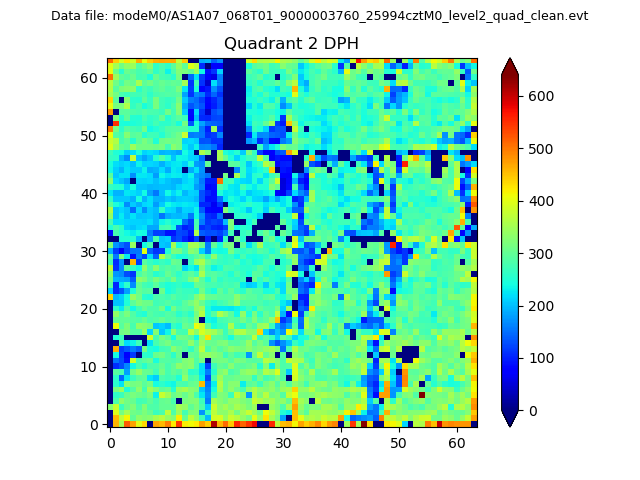
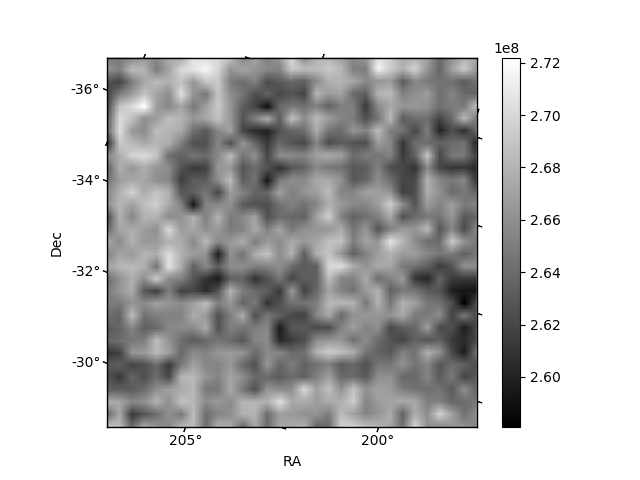
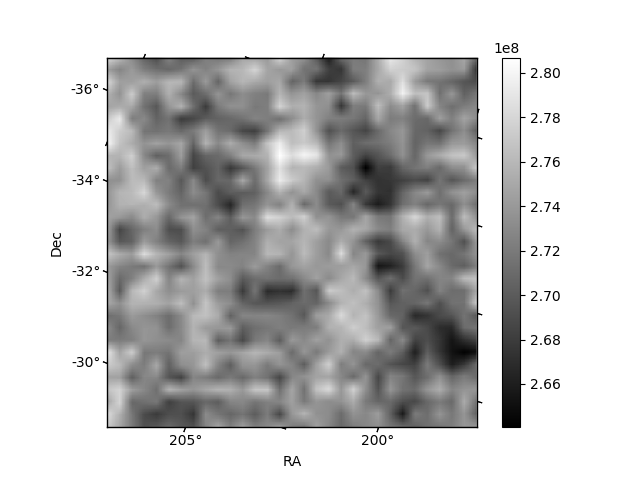
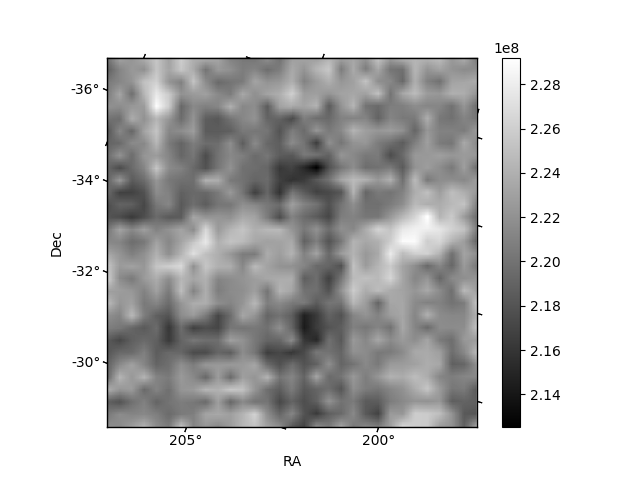
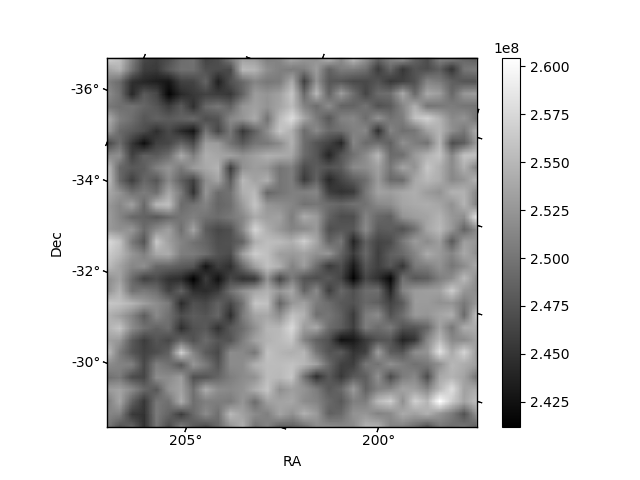
Histogram calculated using DETX and DETY for each event in the final _common_clean file
| Quadrant A | 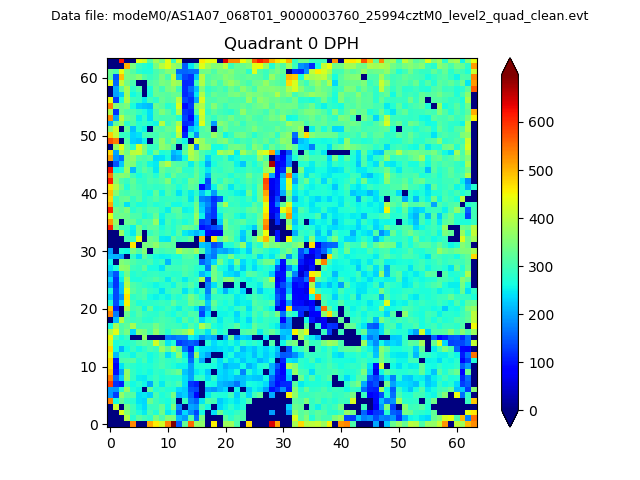 |
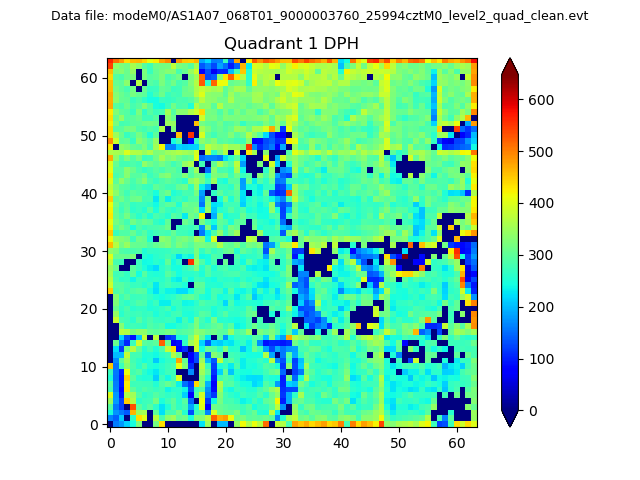 |
Quadrant B |
|---|---|---|---|
| Quadrant D | 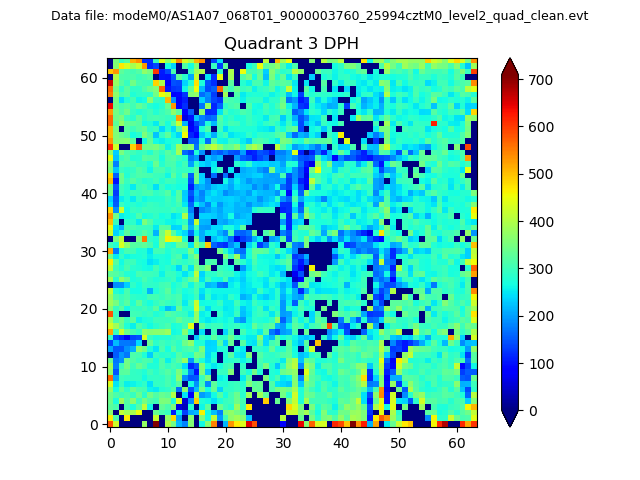 |
 |
Quadrant C |
| Plot type | Count rate plots | Images |
|---|---|---|
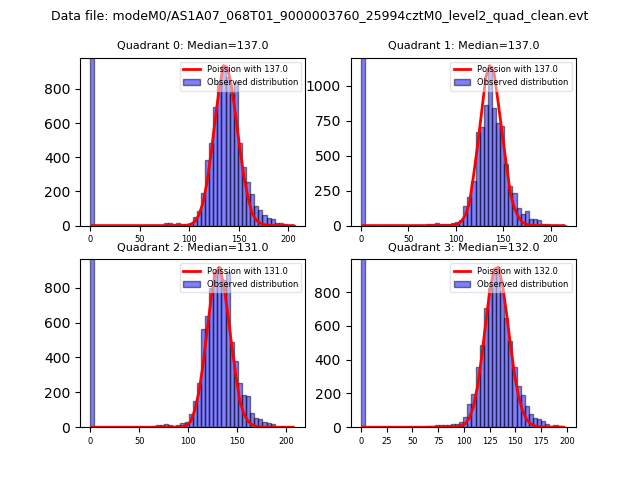
| Comparison with Poisson distribution Blue bars denote a histogram of data divided into 1 sec bins. Red curve is a Poisson curve with rate = median count rate of data. |
 |
 |
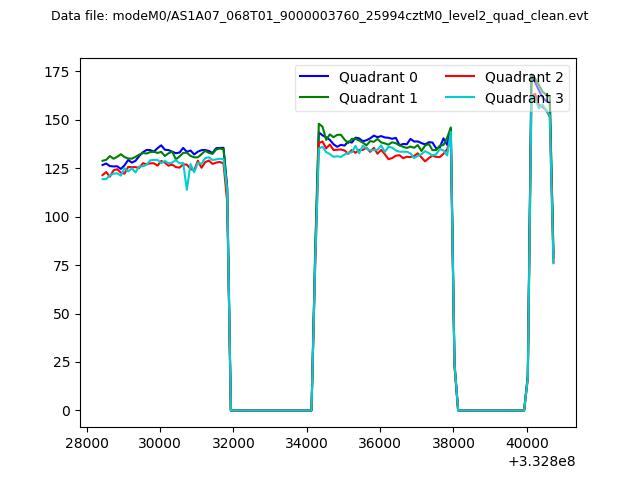
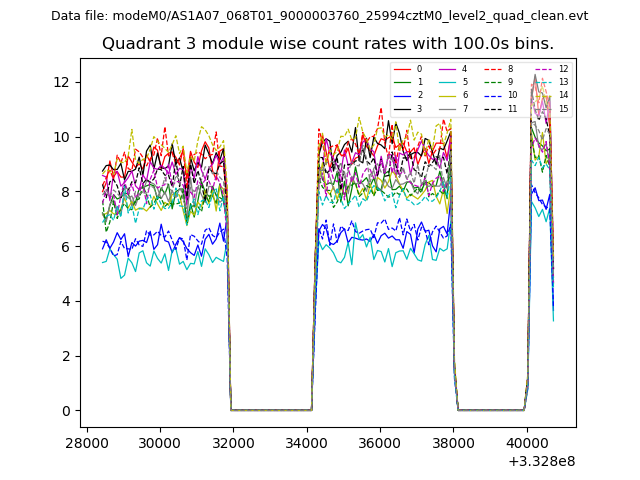
| Quadrant-wise count rates Data is divided into 100 sec bins |
 |
|
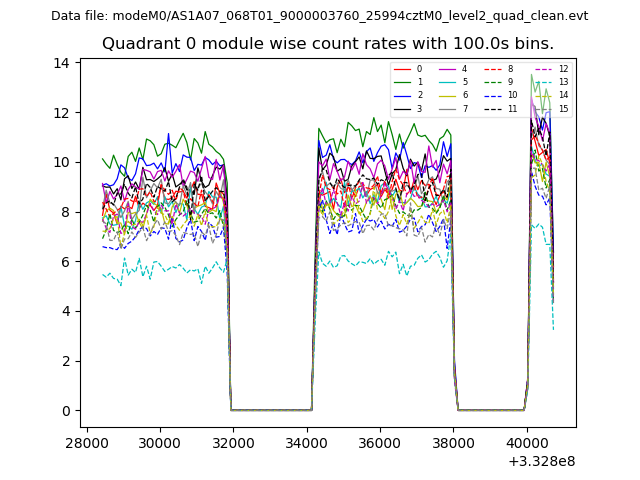
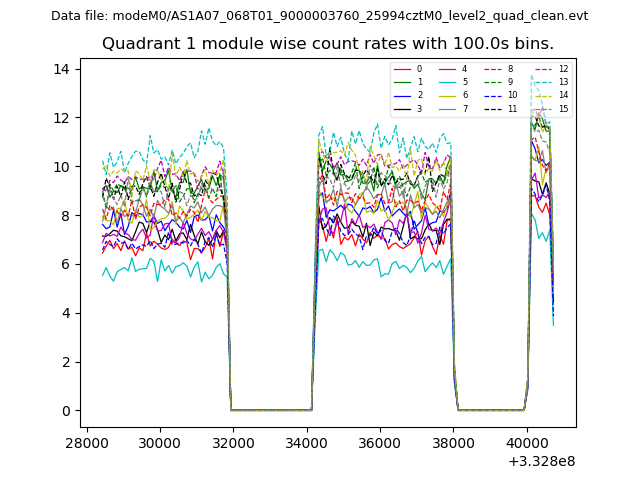
| Module-wise count rates for Quadrant A Data is divided into 100 sec bins |
 |
 |
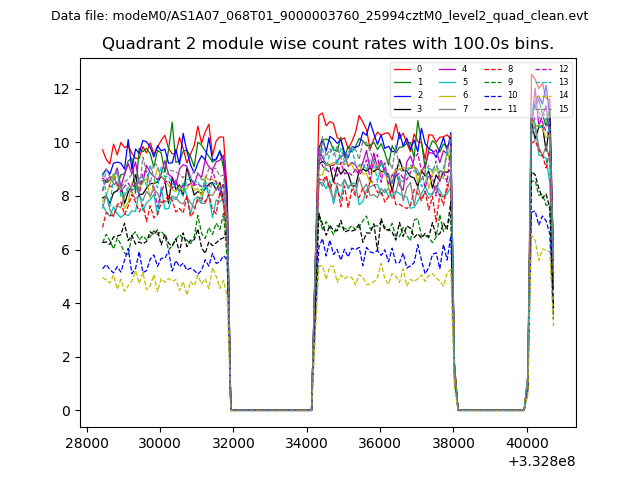
| Module-wise count rates for Quadrant B Data is divided into 100 sec bins |
 |
 |
| Module-wise count rates for Quadrant C Data is divided into 100 sec bins |
 |
 |
| Module-wise count rates for Quadrant D Data is divided into 100 sec bins |
 |
 |
| Parameter | Plot |
|---|---|
| CZT HV Monitor | 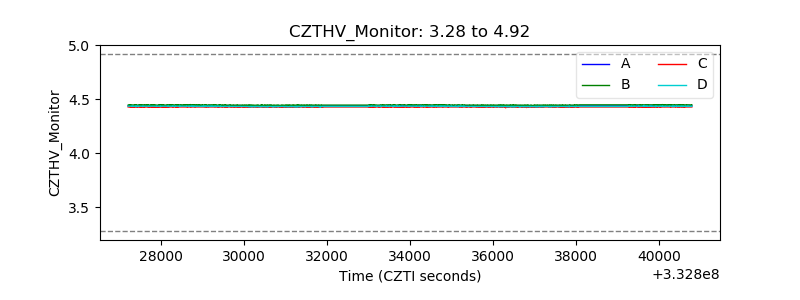 |
| D_VDD | 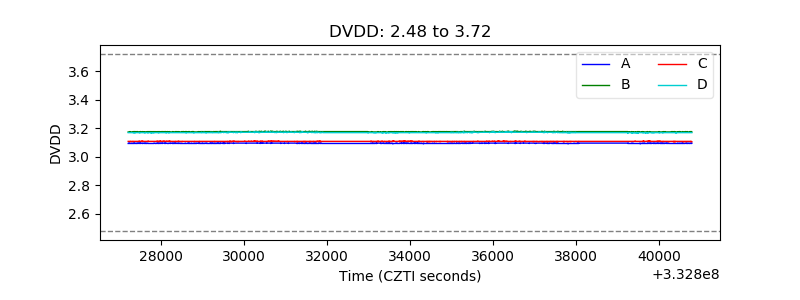 |
| Temperature 1 | 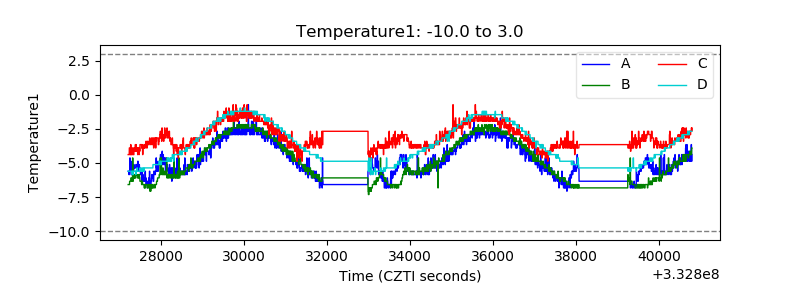 |
| Veto HV Monitor |  |
| Veto LLD | 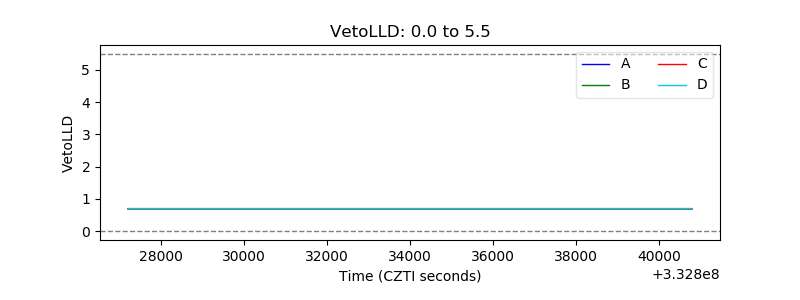 |
| Alpha Counter | 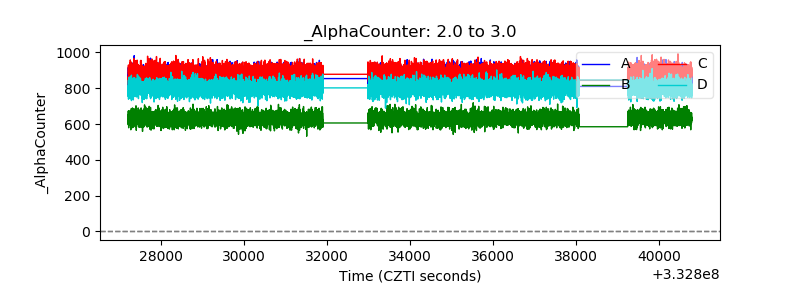 |
| _CPM_Rate | 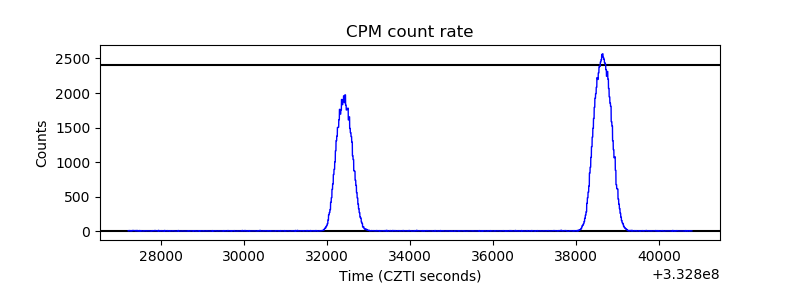 |
| CZT Counter | 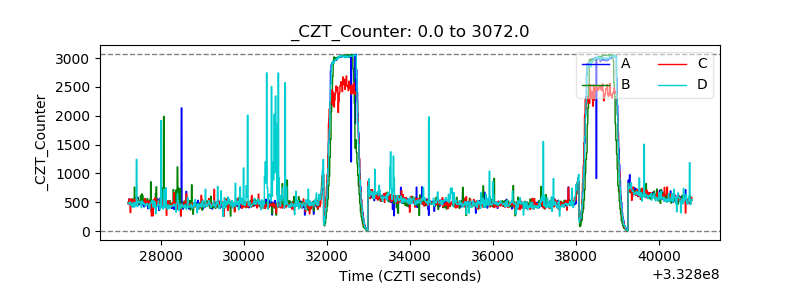 |
| +2.5 Volts monitor |  |
| +5 Volts monitor | 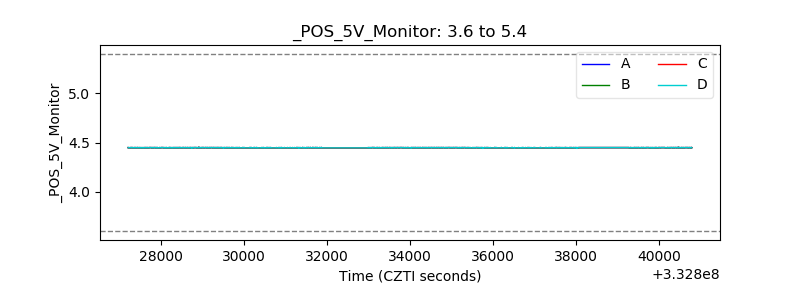 |
| _ROLL_ROT | 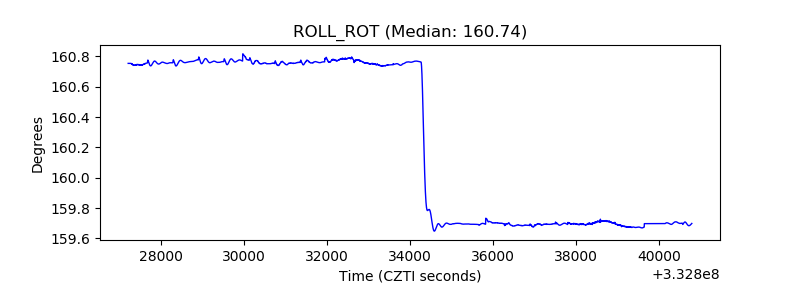 |
| _Roll_DEC | 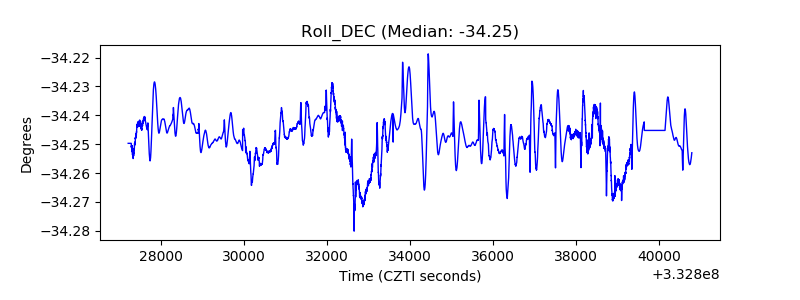 |
| _Roll_RA | 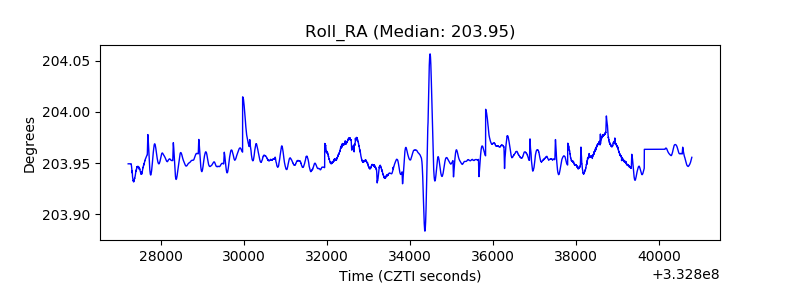 |
| Veto Counter | 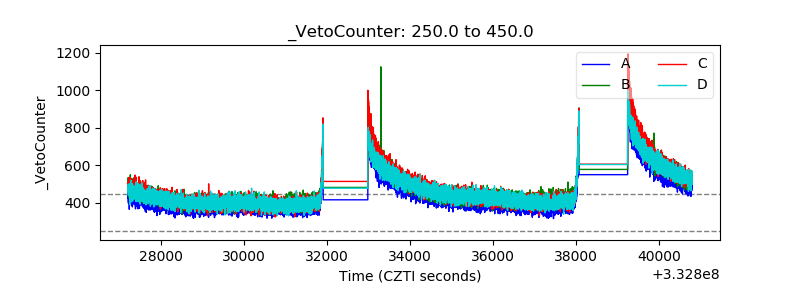 |