| Param | Original file | Final file |
|---|---|---|
| Filename | modeM0/AS1A07_068T01_9000003760_25995cztM0_level2.evt | modeM0/AS1A07_068T01_9000003760_25995cztM0_level2_quad_clean.evt |
| Size (bytes) | 452,589,120 | 106,217,280 |
| Size | 431.6 MB | 101.3 MB |
| Events in quadrant A | 3,278,253 | 715,291 |
| Events in quadrant B | 3,423,207 | 712,711 |
| Events in quadrant C | 3,289,843 | 681,835 |
| Events in quadrant D | 3,308,274 | 688,483 |
| Mode M0 | |||
|---|---|---|---|
| Quadrant | BADHDUFLAG | Total packets | Discarded packets |
| A | 0 | 13597 | 0 |
| B | 0 | 14042 | 0 |
| C | 0 | 13738 | 0 |
| D | 0 | 13701 | 0 |
| Mode M9 | |||
|---|---|---|---|
| Quadrant | BADHDUFLAG | Total packets | Discarded packets |
| A | 0 | 13 | 0 |
| B | 0 | 13 | 0 |
| C | 0 | 13 | 0 |
| D | 0 | 13 | 0 |
| Quadrant | Total seconds | Saturated seconds | Saturation percentage |
|---|---|---|---|
| A | 6000 | 71 | 1.183333% |
| B | 6000 | 112 | 1.866667% |
| C | 6000 | 133 | 2.216667% |
| D | 5999 | 61 | 1.016836% |
Noise dominated data is calculated using 1-second bins in cleaned event files. If a bin has >2000 counts, and if more than 50% of those come from <1% of pixels, then it is considered to be noise-dominated and hence unusable.
| Quadrant | # 1 sec bins | Bins with >0 counts | Bins with >2000 counts | High rate bins dominated by noise | Noise dominated (total time) | Noise dominated (detector-on time) | Marked lightcurve |
|---|---|---|---|---|---|---|---|
| A | 7250 | 6000 | 0 | 0 | 0.00% | 0.00% |  |
| B | 7250 | 6000 | 19 | 19 | 0.26% | 0.32% | 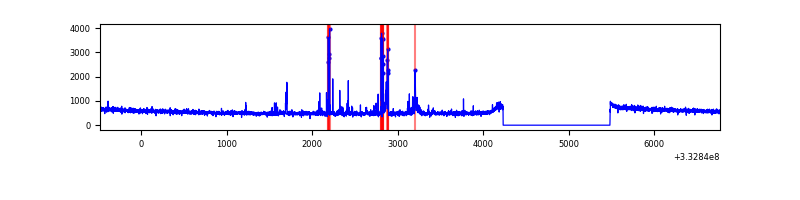 |
| C | 7250 | 6000 | 0 | 0 | 0.00% | 0.00% | 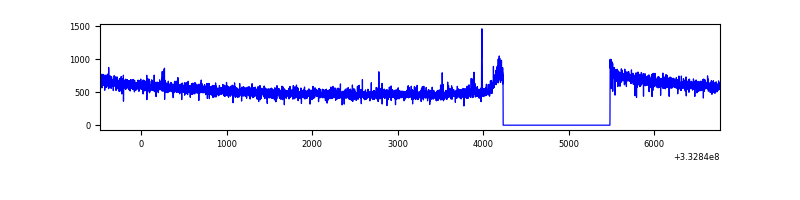 |
| D | 7249 | 5999 | 3 | 3 | 0.04% | 0.05% | 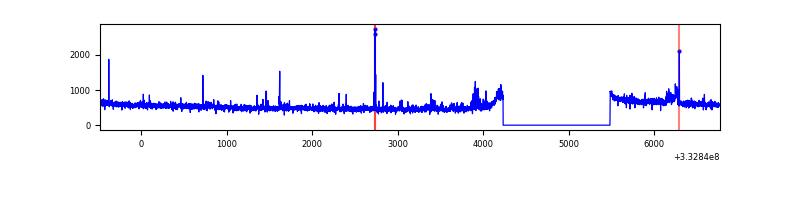 |
Top three noisy pixels from each quadrant. If the there are fewer than three noisy pixels in the level2.evt file, extra rows are filled as -1
| Pixel properties | Quadrant properties | ||||||
|---|---|---|---|---|---|---|---|
| Quadrant | DetID | PixID | Counts | Sigma | Mean | Median | Sigma |
| A | 13 | 254 | 8997 | 48.72 | 851 | 838 | 167.5 |
| A | 0 | 226 | 7401 | 39.19 | 851 | 838 | 167.5 |
| A | 3 | 137 | 7128 | 37.56 | 851 | 838 | 167.5 |
| B | 10 | 245 | 181018 | 1150.31 | 828 | 810 | 156.7 |
| B | 12 | 111 | 18192 | 110.95 | 828 | 810 | 156.7 |
| B | 11 | 111 | 16284 | 98.77 | 828 | 810 | 156.7 |
| C | 14 | 238 | 132305 | 709.75 | 806 | 812 | 185.3 |
| C | 3 | 233 | 14848 | 75.76 | 806 | 812 | 185.3 |
| C | 13 | 61 | 5464 | 25.11 | 806 | 812 | 185.3 |
| D | 1 | 52 | 114768 | 586.75 | 826 | 810 | 194.2 |
| D | 7 | 80 | 61220 | 311.04 | 826 | 810 | 194.2 |
| D | 2 | 234 | 20743 | 102.63 | 826 | 810 | 194.2 |
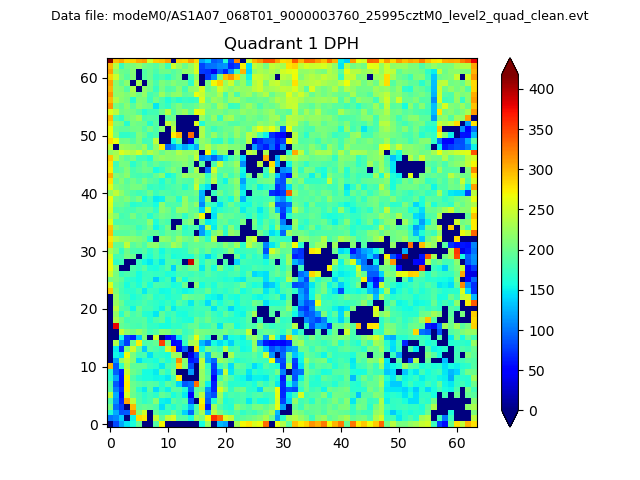
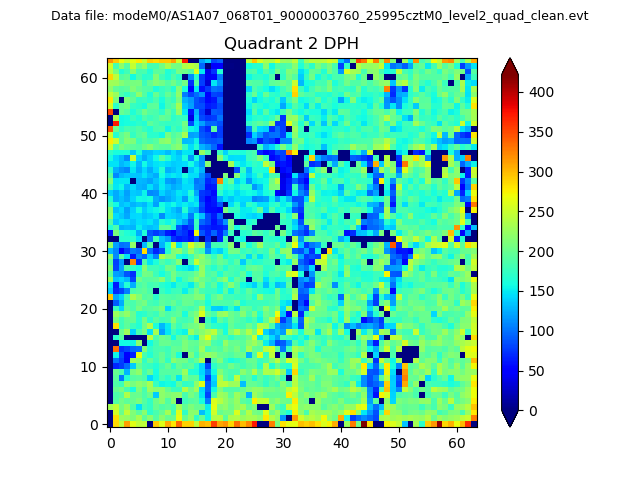
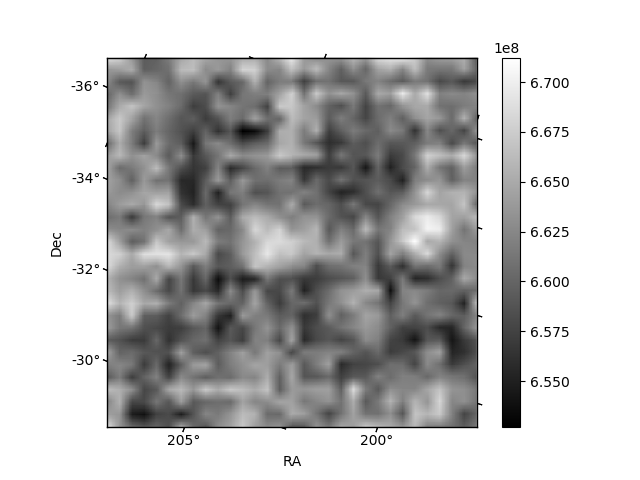
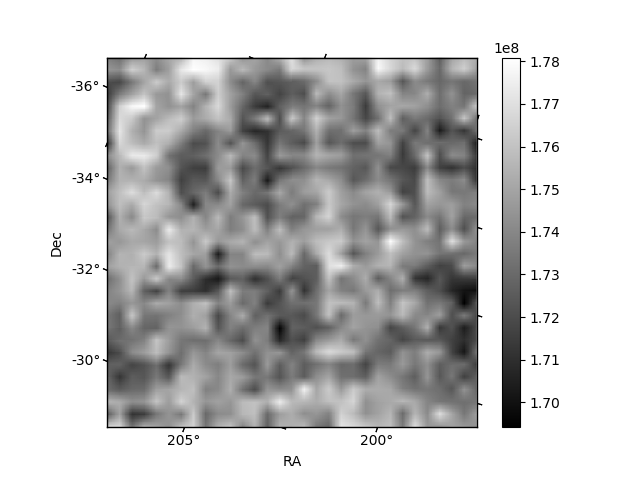
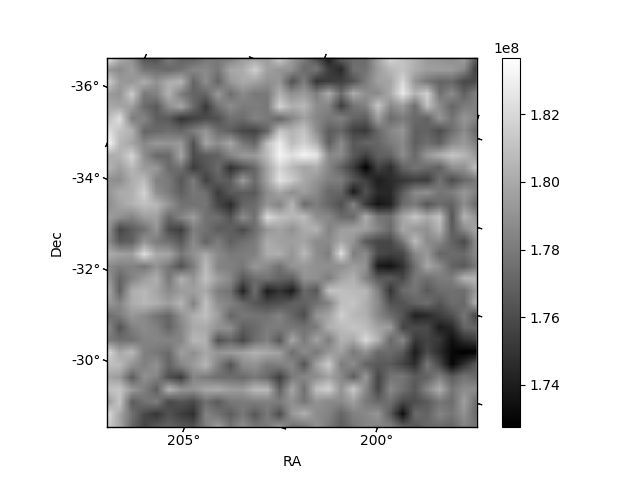
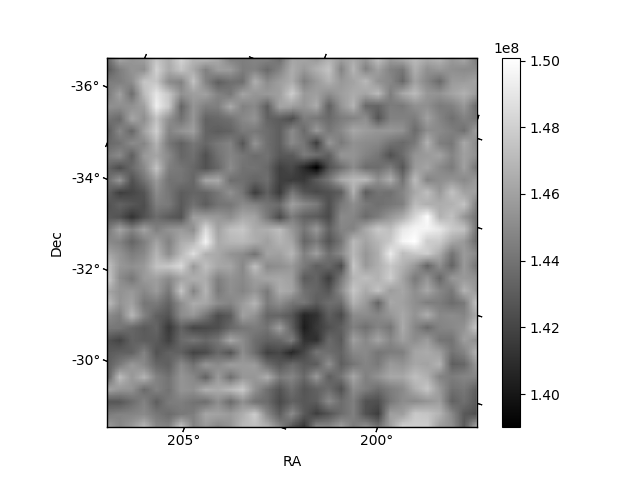
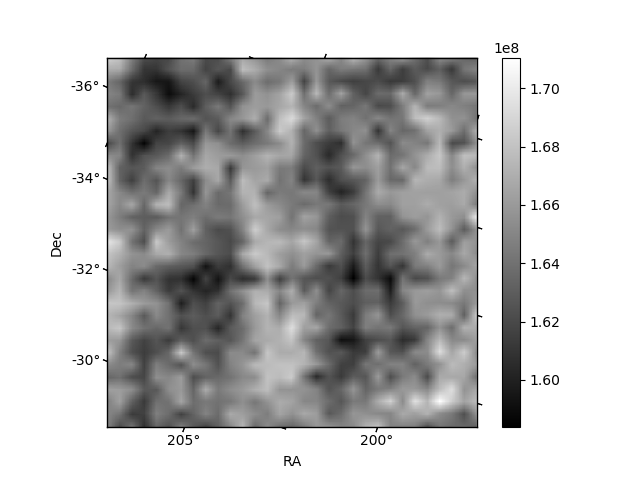
Histogram calculated using DETX and DETY for each event in the final _common_clean file
| Quadrant A | 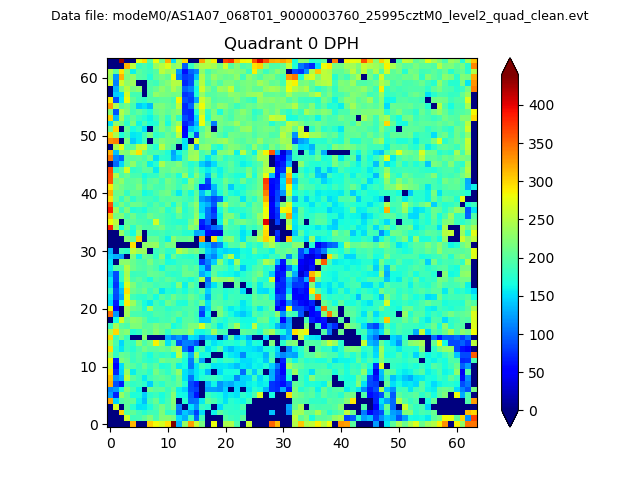 |
 |
Quadrant B |
|---|---|---|---|
| Quadrant D | 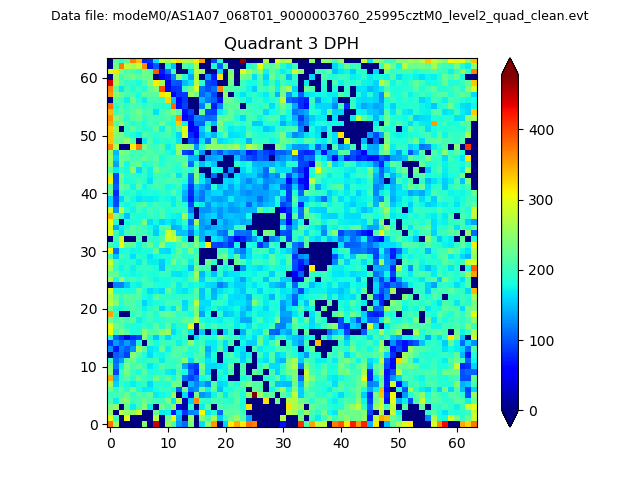 |
 |
Quadrant C |
| Plot type | Count rate plots | Images |
|---|---|---|
| Comparison with Poisson distribution Blue bars denote a histogram of data divided into 1 sec bins. Red curve is a Poisson curve with rate = median count rate of data. |
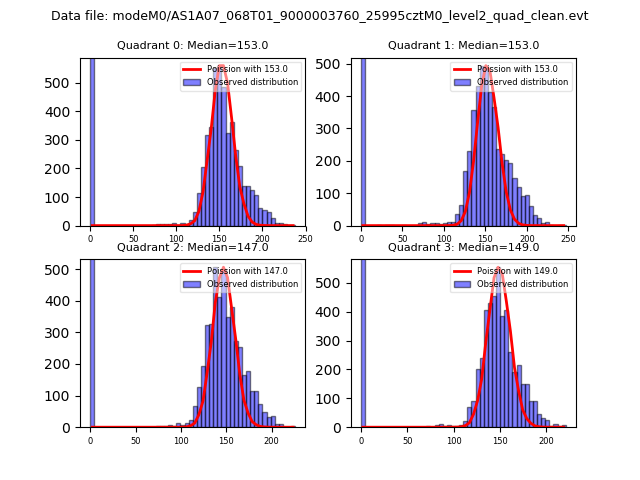 |
 |
| Quadrant-wise count rates Data is divided into 100 sec bins |
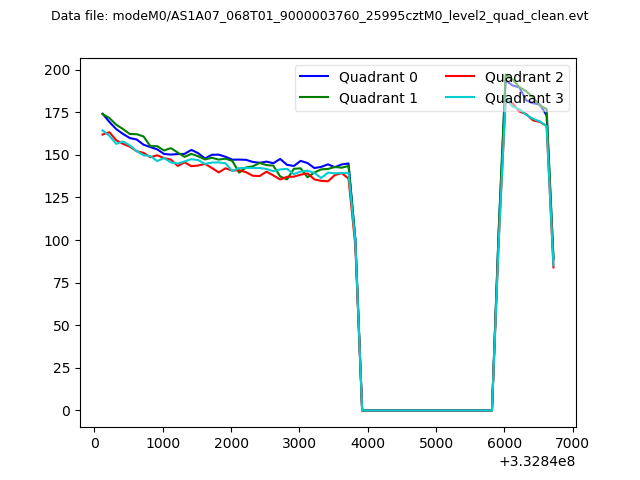 |
|
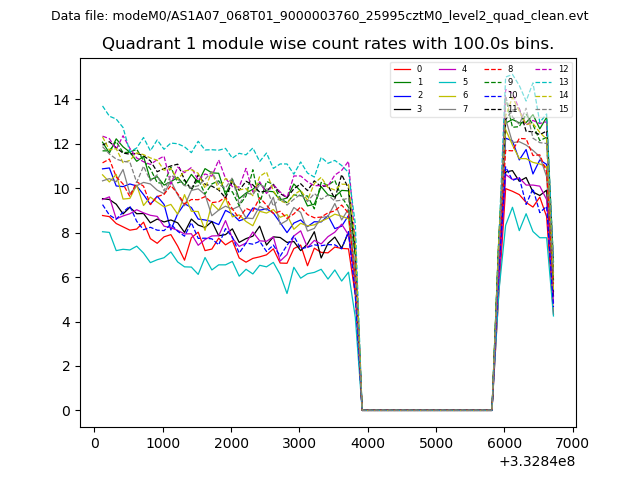
| Module-wise count rates for Quadrant A Data is divided into 100 sec bins |
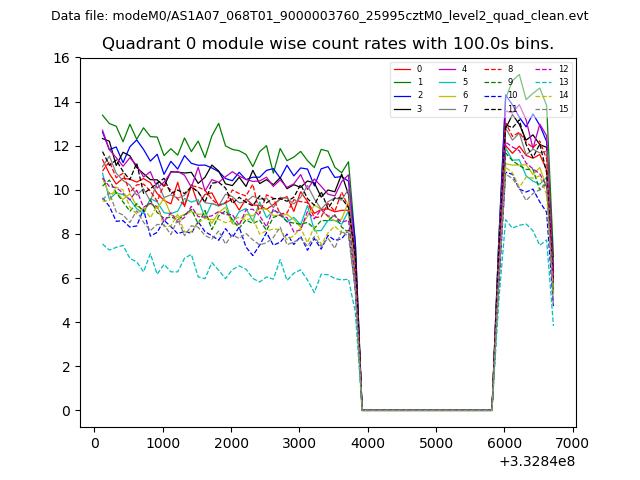 |
 |
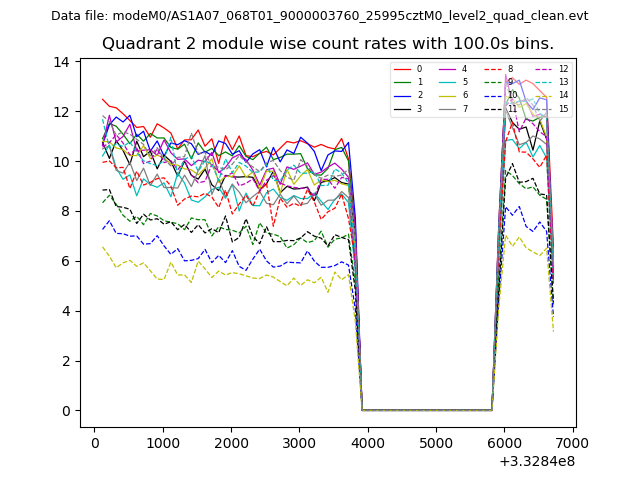
| Module-wise count rates for Quadrant B Data is divided into 100 sec bins |
 |
 |
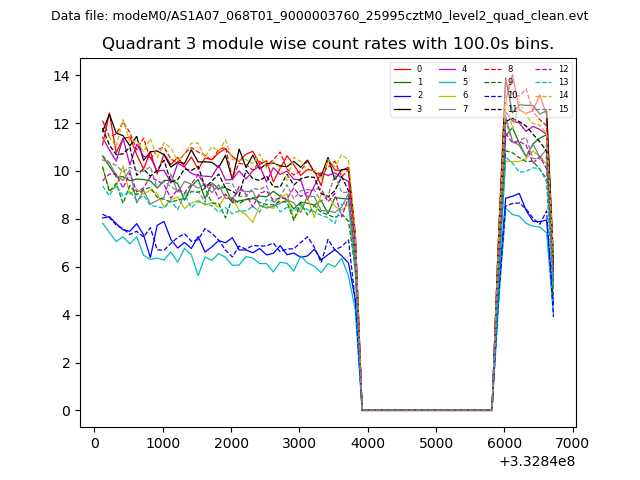
| Module-wise count rates for Quadrant C Data is divided into 100 sec bins |
 |
 |
| Module-wise count rates for Quadrant D Data is divided into 100 sec bins |
 |
 |
| Parameter | Plot |
|---|---|
| CZT HV Monitor | 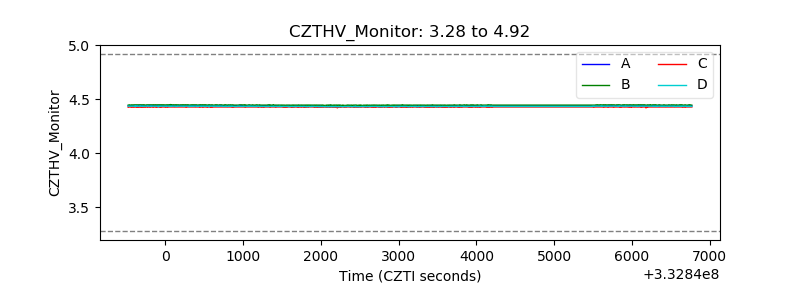 |
| D_VDD | 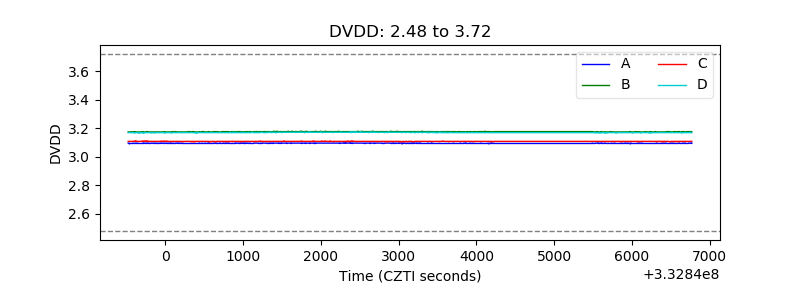 |
| Temperature 1 | 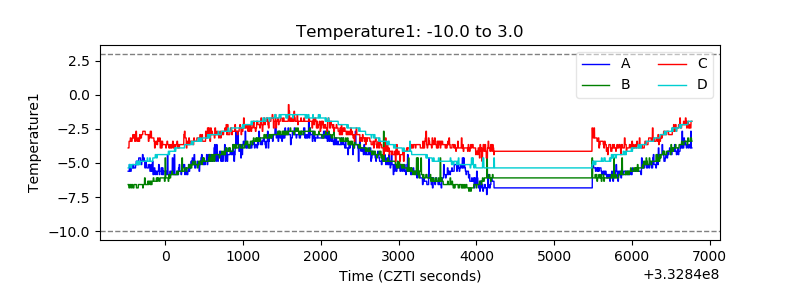 |
| Veto HV Monitor | 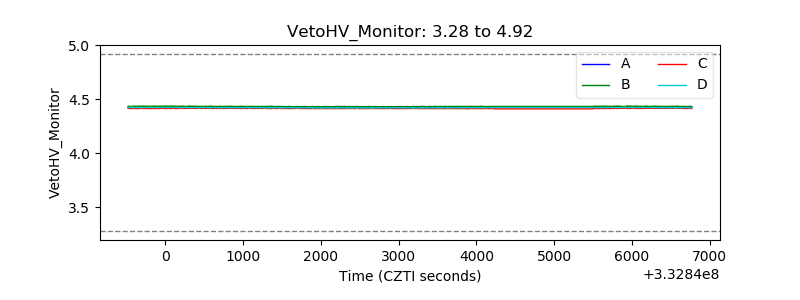 |
| Veto LLD | 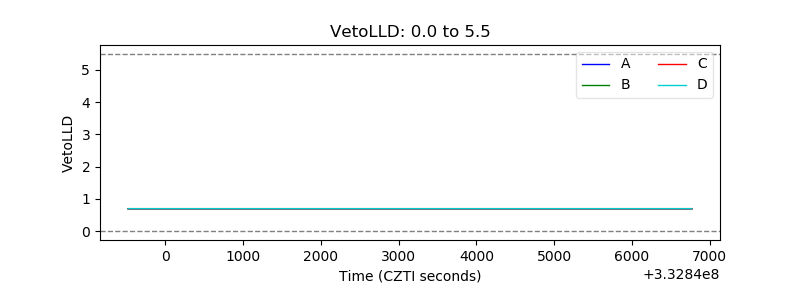 |
| Alpha Counter | 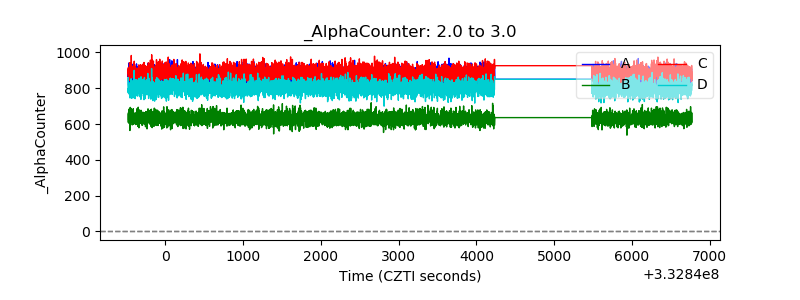 |
| _CPM_Rate | 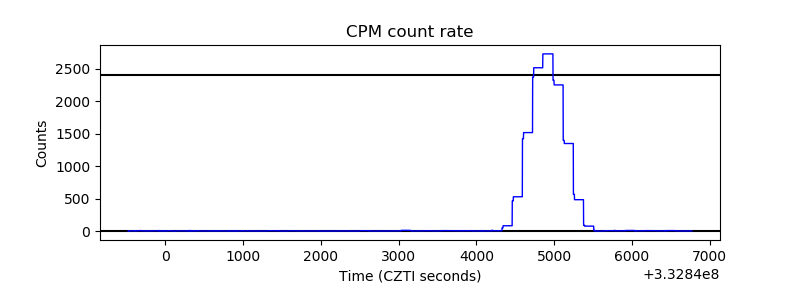 |
| CZT Counter | 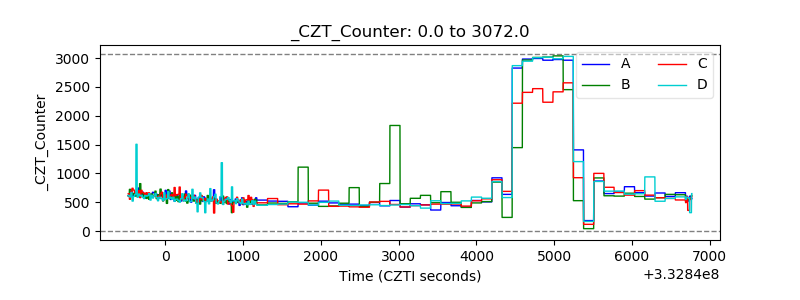 |
| +2.5 Volts monitor | 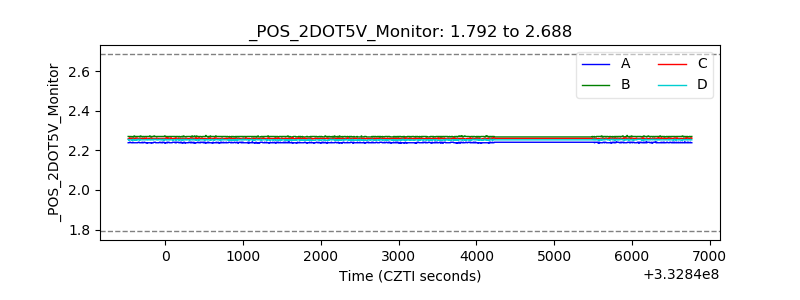 |
| +5 Volts monitor |  |
| _ROLL_ROT | 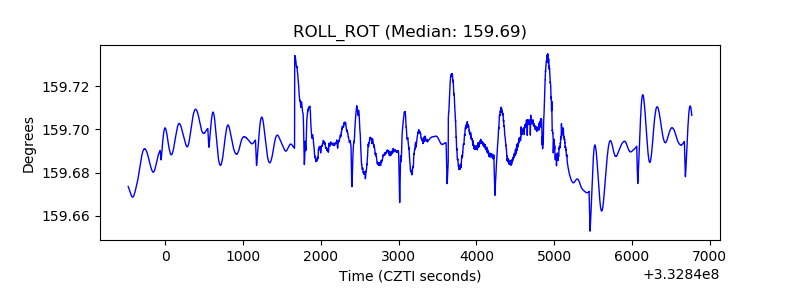 |
| _Roll_DEC |  |
| _Roll_RA | 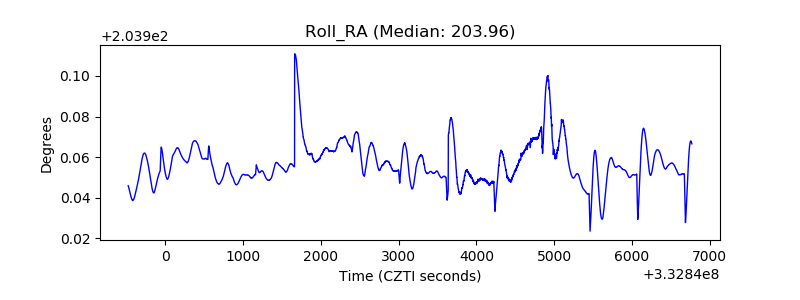 |
| Veto Counter | 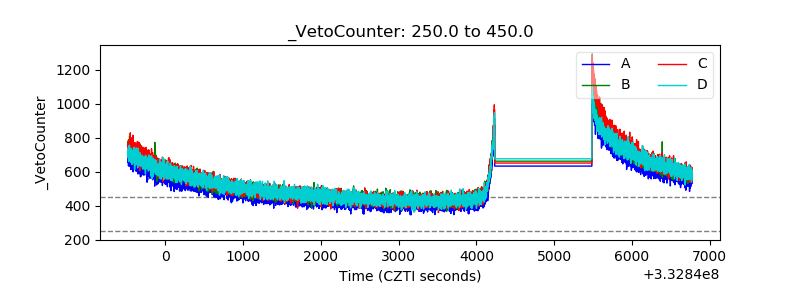 |