| Param | Original file | Final file |
|---|---|---|
| Filename | modeM0/AS1A07_068T01_9000003760_25996cztM0_level2.evt | modeM0/AS1A07_068T01_9000003760_25996cztM0_level2_quad_clean.evt |
| Size (bytes) | 3,046,129,920 | 618,923,520 |
| Size | 2.8 GB | 590.3 MB |
| Events in quadrant A | 20,874,689 | 4,087,618 |
| Events in quadrant B | 21,397,953 | 4,075,934 |
| Events in quadrant C | 20,965,681 | 3,889,479 |
| Events in quadrant D | 26,178,514 | 3,808,781 |
| Mode M0 | |||
|---|---|---|---|
| Quadrant | BADHDUFLAG | Total packets | Discarded packets |
| A | 0 | 88743 | 0 |
| B | 0 | 90131 | 0 |
| C | 0 | 88920 | 0 |
| D | 0 | 105276 | 0 |
| Mode M9 | |||
|---|---|---|---|
| Quadrant | BADHDUFLAG | Total packets | Discarded packets |
| A | 0 | 76 | 0 |
| B | 0 | 76 | 0 |
| C | 0 | 76 | 0 |
| D | 0 | 76 | 0 |
| Quadrant | Total seconds | Saturated seconds | Saturation percentage |
|---|---|---|---|
| A | 42033 | 378 | 0.899293% |
| B | 42033 | 494 | 1.175267% |
| C | 42033 | 633 | 1.505960% |
| D | 42033 | 1829 | 4.351343% |
Noise dominated data is calculated using 1-second bins in cleaned event files. If a bin has >2000 counts, and if more than 50% of those come from <1% of pixels, then it is considered to be noise-dominated and hence unusable.
| Quadrant | # 1 sec bins | Bins with >0 counts | Bins with >2000 counts | High rate bins dominated by noise | Noise dominated (total time) | Noise dominated (detector-on time) | Marked lightcurve |
|---|---|---|---|---|---|---|---|
| A | 49538 | 42037 | 15 | 15 | 0.03% | 0.04% |  |
| B | 49538 | 42037 | 33 | 33 | 0.07% | 0.08% |  |
| C | 49538 | 42037 | 1 | 1 | 0.00% | 0.00% |  |
| D | 49538 | 42038 | 1371 | 1371 | 2.77% | 3.26% |  |
Top three noisy pixels from each quadrant. If the there are fewer than three noisy pixels in the level2.evt file, extra rows are filled as -1
| Pixel properties | Quadrant properties | ||||||
|---|---|---|---|---|---|---|---|
| Quadrant | DetID | PixID | Counts | Sigma | Mean | Median | Sigma |
| A | 8 | 255 | 74191 | 64.64 | 5398 | 5296 | 1065.9 |
| A | 13 | 254 | 60396 | 51.7 | 5398 | 5296 | 1065.9 |
| A | 3 | 137 | 48477 | 40.51 | 5398 | 5296 | 1065.9 |
| B | 10 | 245 | 422750 | 420.37 | 5298 | 5167 | 993.4 |
| B | 12 | 111 | 122736 | 118.35 | 5298 | 5167 | 993.4 |
| B | 0 | 190 | 114730 | 110.3 | 5298 | 5167 | 993.4 |
| C | 14 | 238 | 832269 | 702.53 | 5107 | 5140 | 1177.4 |
| C | 3 | 233 | 147264 | 120.71 | 5107 | 5140 | 1177.4 |
| C | 0 | 207 | 82639 | 65.82 | 5107 | 5140 | 1177.4 |
| D | 1 | 52 | 5824528 | 4774.97 | 5134 | 5010 | 1218.8 |
| D | 7 | 80 | 621475 | 505.82 | 5134 | 5010 | 1218.8 |
| D | 12 | 233 | 259278 | 208.63 | 5134 | 5010 | 1218.8 |
Histogram calculated using DETX and DETY for each event in the final _common_clean file
| Quadrant A |  |
 |
Quadrant B |
|---|---|---|---|
| Quadrant D |  |
 |
Quadrant C |
| Plot type | Count rate plots | Images |
|---|---|---|
| Comparison with Poisson distribution Blue bars denote a histogram of data divided into 1 sec bins. Red curve is a Poisson curve with rate = median count rate of data. |
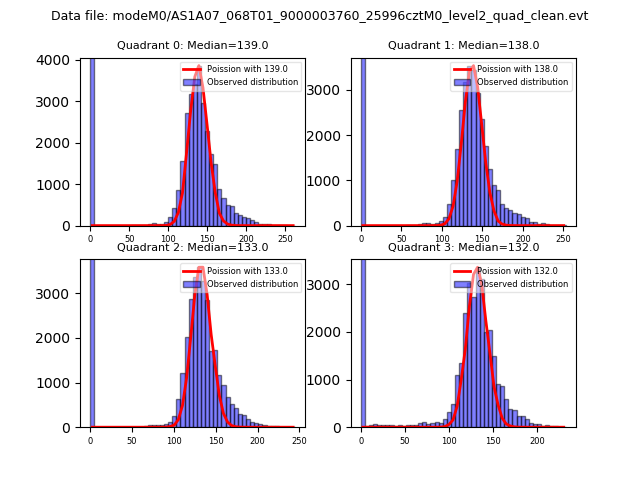 |
 |
| Quadrant-wise count rates Data is divided into 100 sec bins |
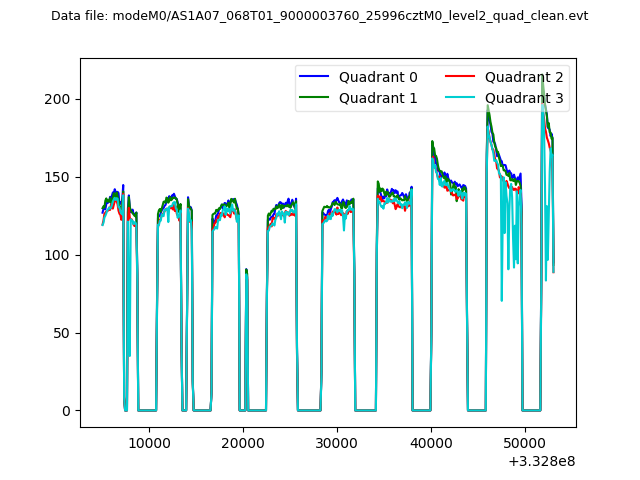 |
|
| Module-wise count rates for Quadrant A Data is divided into 100 sec bins |
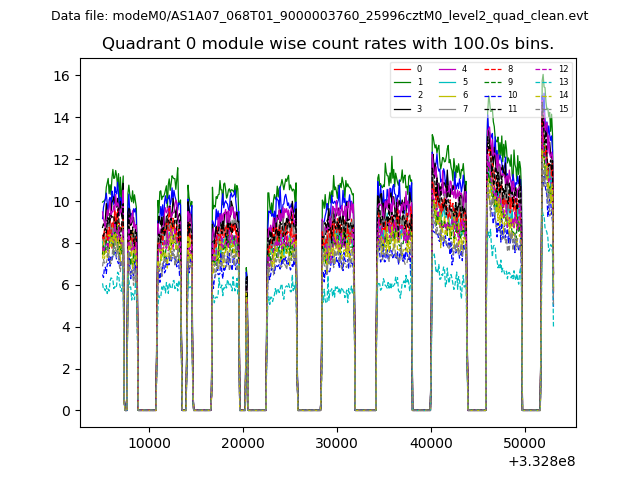 |
 |
| Module-wise count rates for Quadrant B Data is divided into 100 sec bins |
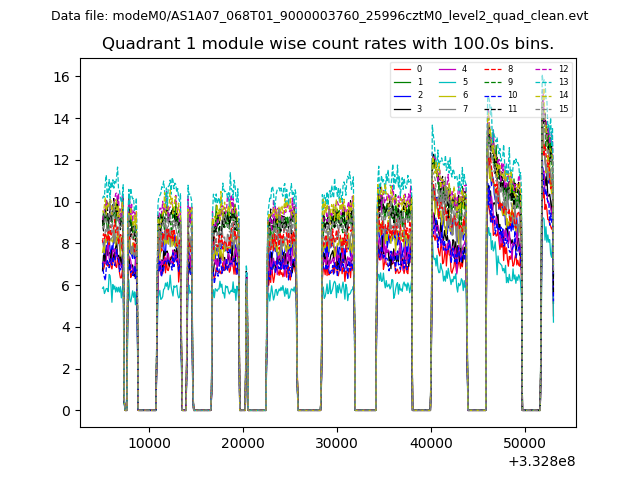 |
 |
| Module-wise count rates for Quadrant C Data is divided into 100 sec bins |
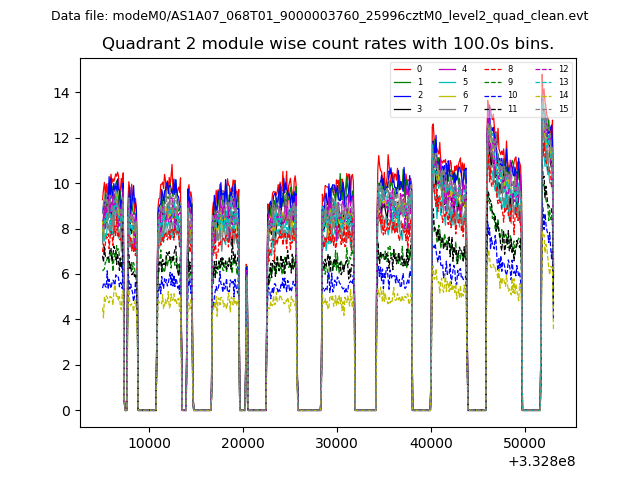 |
 |
| Module-wise count rates for Quadrant D Data is divided into 100 sec bins |
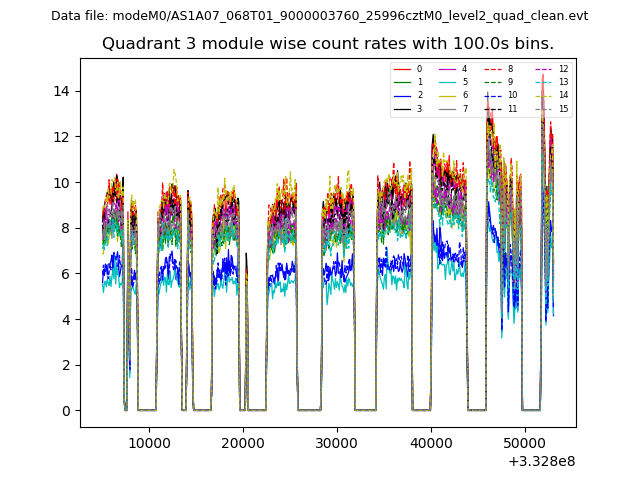 |
 |
| Parameter | Plot |
|---|---|
| CZT HV Monitor | 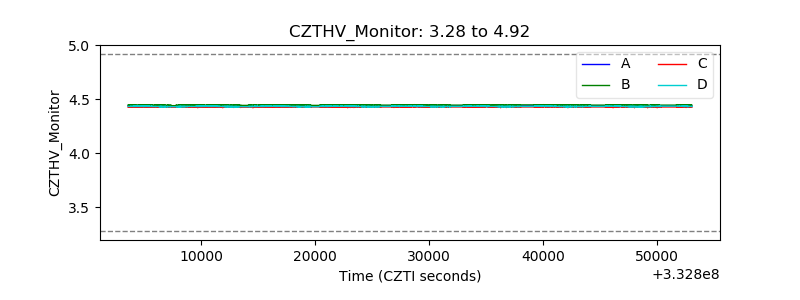 |
| D_VDD |  |
| Temperature 1 |  |
| Veto HV Monitor |  |
| Veto LLD |  |
| Alpha Counter | 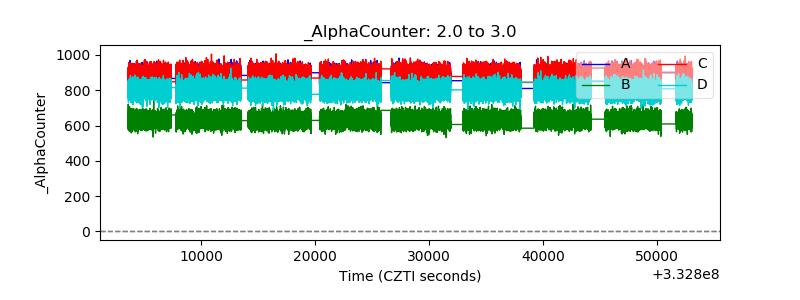 |
| _CPM_Rate | 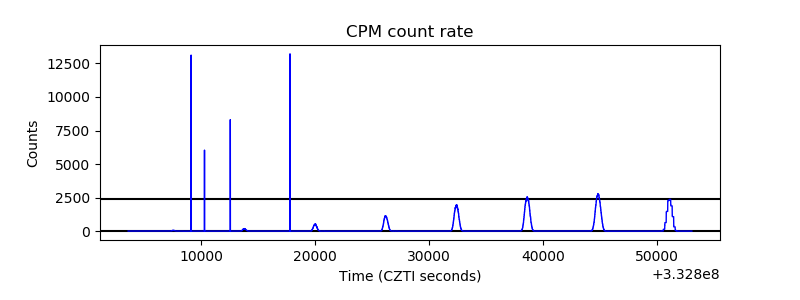 |
| CZT Counter |  |
| +2.5 Volts monitor |  |
| +5 Volts monitor |  |
| _ROLL_ROT | 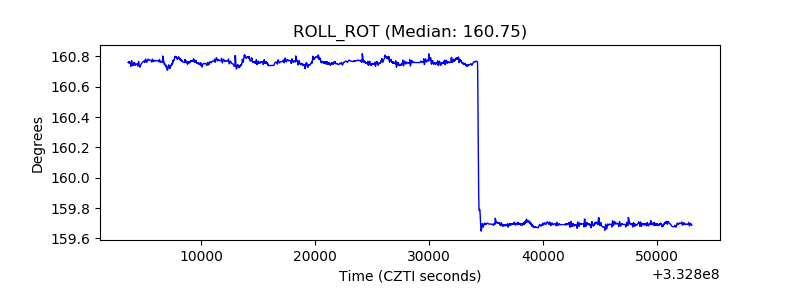 |
| _Roll_DEC |  |
| _Roll_RA |  |
| Veto Counter | 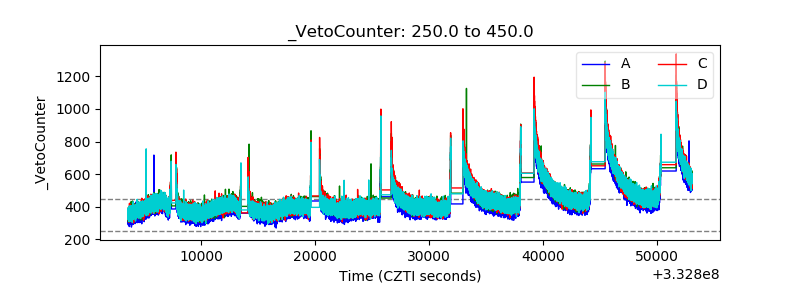 |