| Param | Original file | Final file |
|---|---|---|
| Filename | modeM0/AS1A07_068T01_9000003760_25997cztM0_level2.evt | modeM0/AS1A07_068T01_9000003760_25997cztM0_level2_quad_clean.evt |
| Size (bytes) | 530,095,680 | 119,376,000 |
| Size | 505.5 MB | 113.8 MB |
| Events in quadrant A | 3,320,242 | 839,669 |
| Events in quadrant B | 3,513,263 | 824,221 |
| Events in quadrant C | 3,252,762 | 781,106 |
| Events in quadrant D | 5,553,296 | 743,645 |
| Mode M0 | |||
|---|---|---|---|
| Quadrant | BADHDUFLAG | Total packets | Discarded packets |
| A | 0 | 13736 | 0 |
| B | 0 | 14275 | 0 |
| C | 0 | 13543 | 0 |
| D | 0 | 20883 | 0 |
| Mode M9 | |||
|---|---|---|---|
| Quadrant | BADHDUFLAG | Total packets | Discarded packets |
| A | 0 | 14 | 0 |
| B | 0 | 14 | 0 |
| C | 0 | 14 | 0 |
| D | 0 | 14 | 0 |
| Quadrant | Total seconds | Saturated seconds | Saturation percentage |
|---|---|---|---|
| A | 6119 | 99 | 1.617911% |
| B | 6119 | 147 | 2.402353% |
| C | 6120 | 130 | 2.124183% |
| D | 6120 | 616 | 10.065359% |
Noise dominated data is calculated using 1-second bins in cleaned event files. If a bin has >2000 counts, and if more than 50% of those come from <1% of pixels, then it is considered to be noise-dominated and hence unusable.
| Quadrant | # 1 sec bins | Bins with >0 counts | Bins with >2000 counts | High rate bins dominated by noise | Noise dominated (total time) | Noise dominated (detector-on time) | Marked lightcurve |
|---|---|---|---|---|---|---|---|
| A | 7444 | 6120 | 5 | 5 | 0.07% | 0.08% | 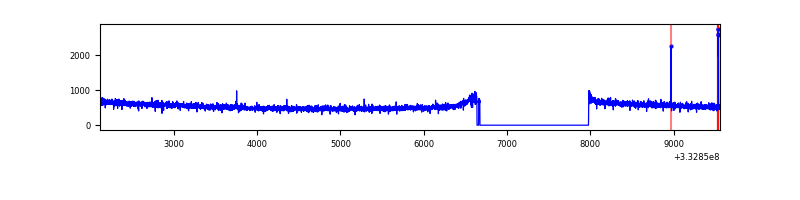 |
| B | 7444 | 6120 | 56 | 56 | 0.75% | 0.92% | 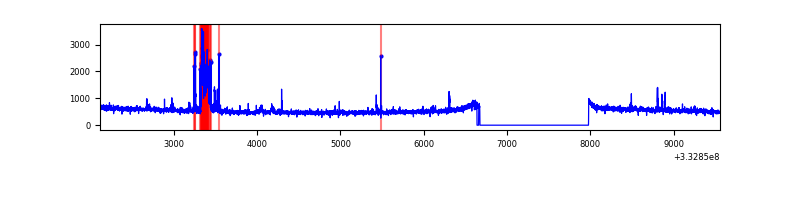 |
| C | 7445 | 6121 | 0 | 0 | 0.00% | 0.00% | 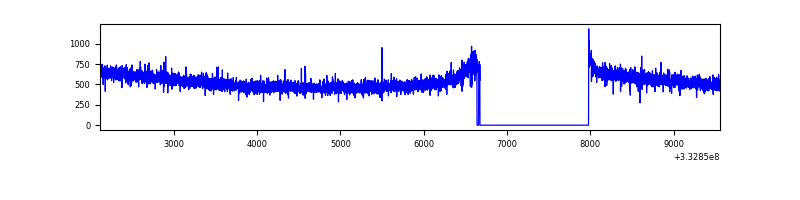 |
| D | 7445 | 6121 | 430 | 430 | 5.78% | 7.02% | 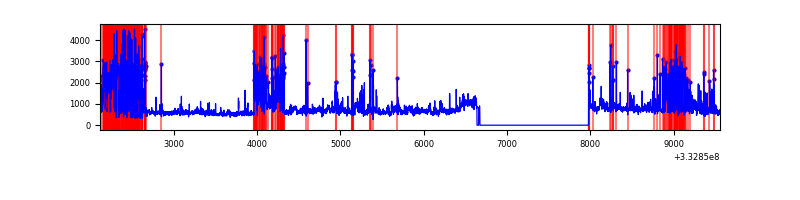 |
Top three noisy pixels from each quadrant. If the there are fewer than three noisy pixels in the level2.evt file, extra rows are filled as -1
| Pixel properties | Quadrant properties | ||||||
|---|---|---|---|---|---|---|---|
| Quadrant | DetID | PixID | Counts | Sigma | Mean | Median | Sigma |
| A | 4 | 208 | 12336 | 67.87 | 857 | 844 | 169.3 |
| A | 13 | 254 | 9137 | 48.98 | 857 | 844 | 169.3 |
| A | 0 | 226 | 7529 | 39.48 | 857 | 844 | 169.3 |
| B | 10 | 245 | 227328 | 1468.14 | 827 | 809 | 154.3 |
| B | 0 | 190 | 34381 | 217.59 | 827 | 809 | 154.3 |
| B | 12 | 111 | 17987 | 111.34 | 827 | 809 | 154.3 |
| C | 14 | 238 | 130780 | 707.85 | 797 | 803 | 183.6 |
| C | 3 | 233 | 8528 | 42.07 | 797 | 803 | 183.6 |
| C | 0 | 207 | 8200 | 40.28 | 797 | 803 | 183.6 |
| D | 1 | 52 | 2299866 | 12291.13 | 790 | 772 | 187.1 |
| D | 7 | 80 | 233255 | 1242.87 | 790 | 772 | 187.1 |
| D | 2 | 234 | 22091 | 113.97 | 790 | 772 | 187.1 |
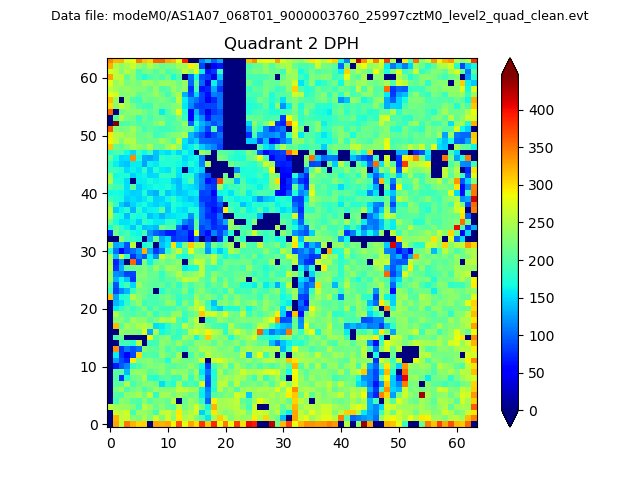
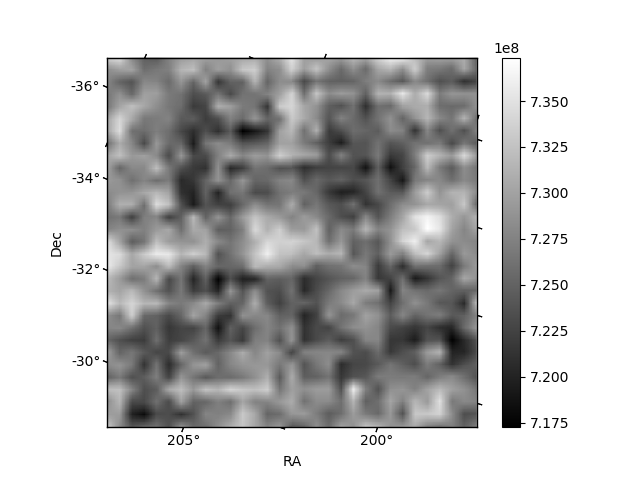
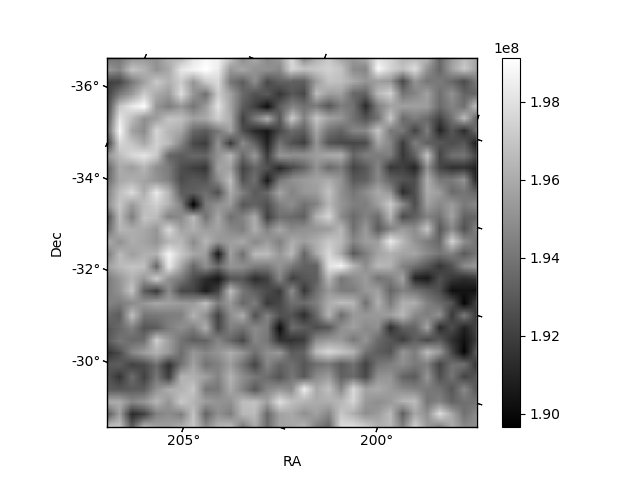
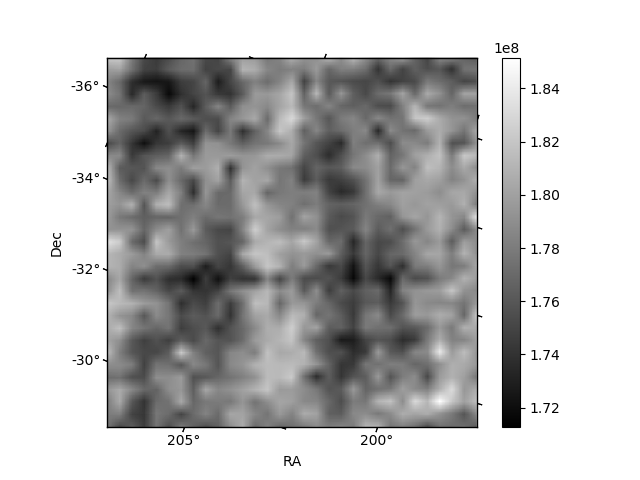
Histogram calculated using DETX and DETY for each event in the final _common_clean file
| Quadrant A | 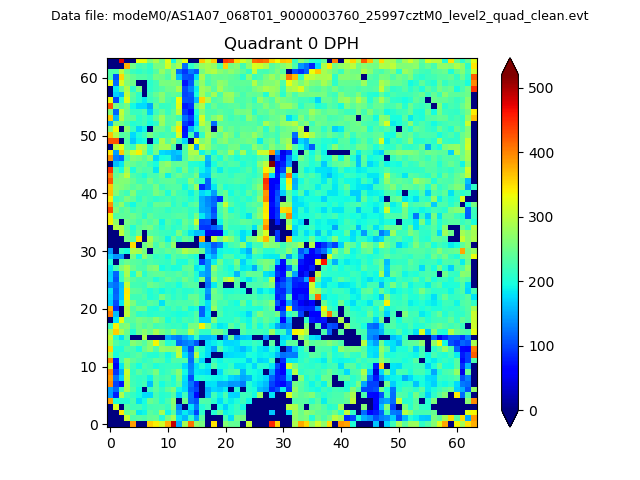 |
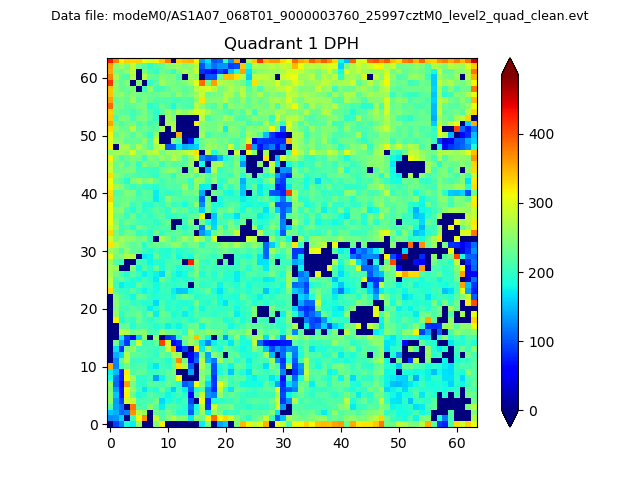 |
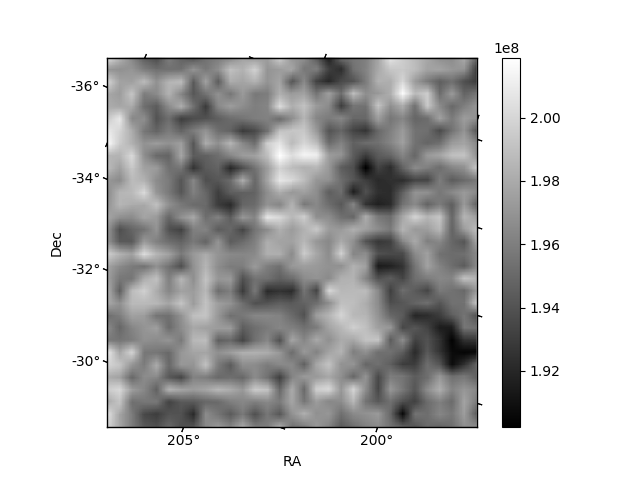
Quadrant B |
|---|---|---|---|
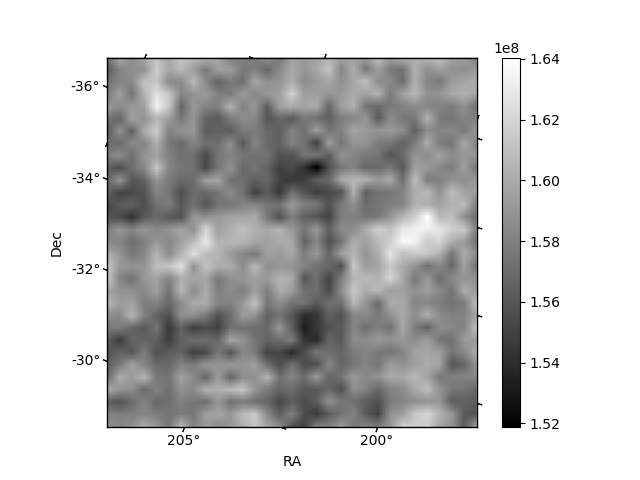
| Quadrant D | 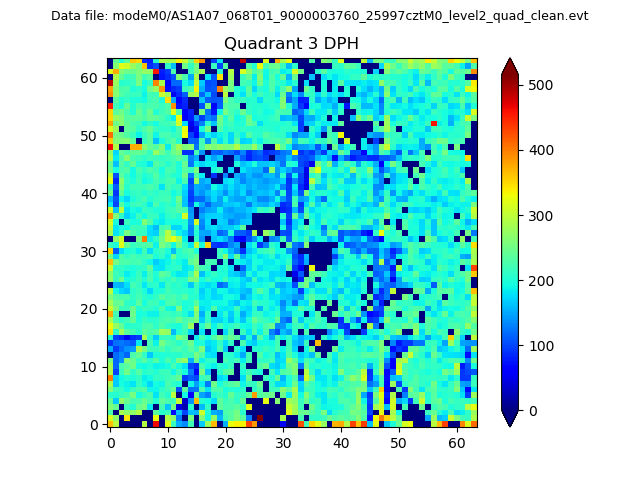 |
 |
Quadrant C |
| Plot type | Count rate plots | Images |
|---|---|---|
| Comparison with Poisson distribution Blue bars denote a histogram of data divided into 1 sec bins. Red curve is a Poisson curve with rate = median count rate of data. |
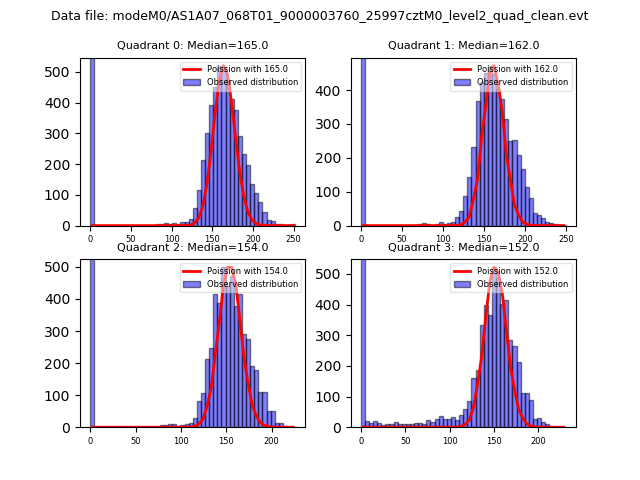 |
 |
| Quadrant-wise count rates Data is divided into 100 sec bins |
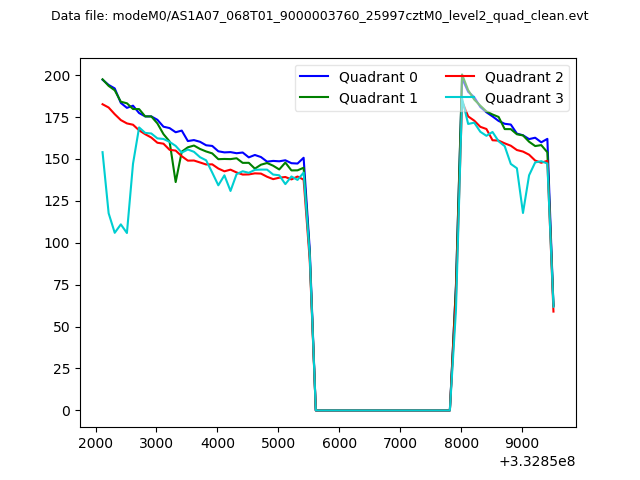 |
|
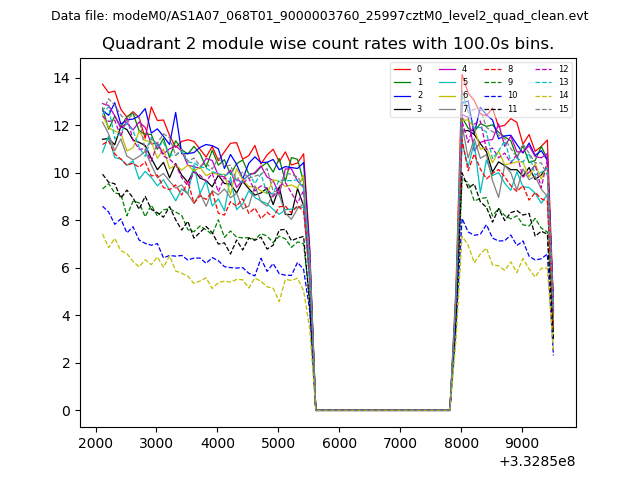
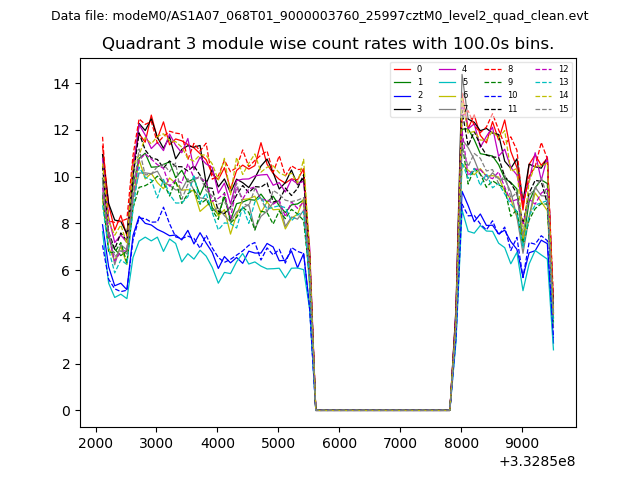
| Module-wise count rates for Quadrant A Data is divided into 100 sec bins |
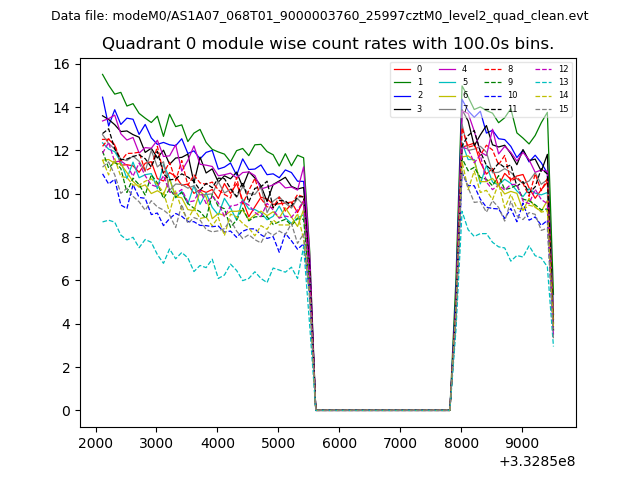 |
 |
| Module-wise count rates for Quadrant B Data is divided into 100 sec bins |
 |
 |
| Module-wise count rates for Quadrant C Data is divided into 100 sec bins |
 |
 |
| Module-wise count rates for Quadrant D Data is divided into 100 sec bins |
 |
 |
| Parameter | Plot |
|---|---|
| CZT HV Monitor | 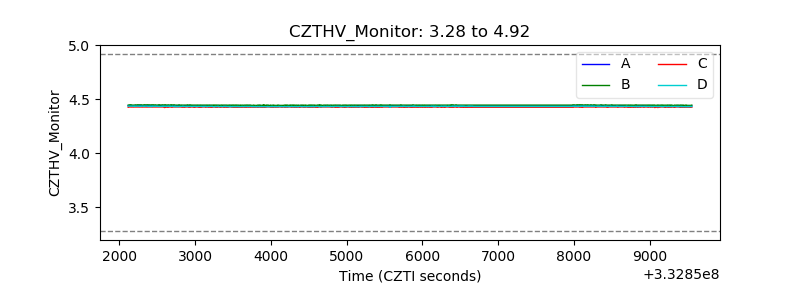 |
| D_VDD | 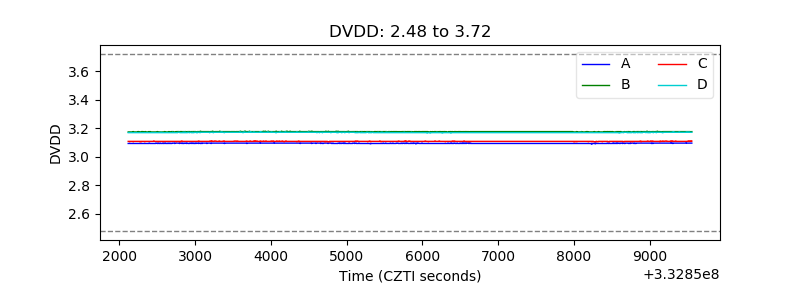 |
| Temperature 1 | 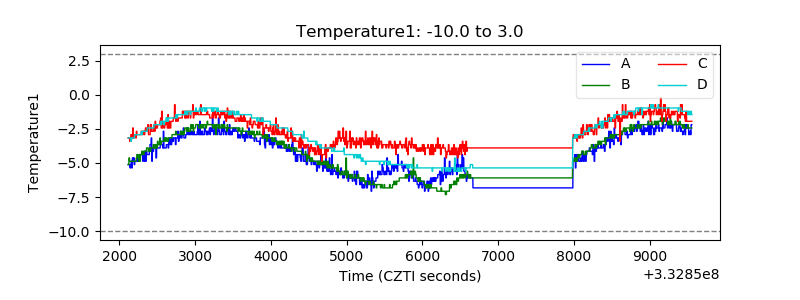 |
| Veto HV Monitor | 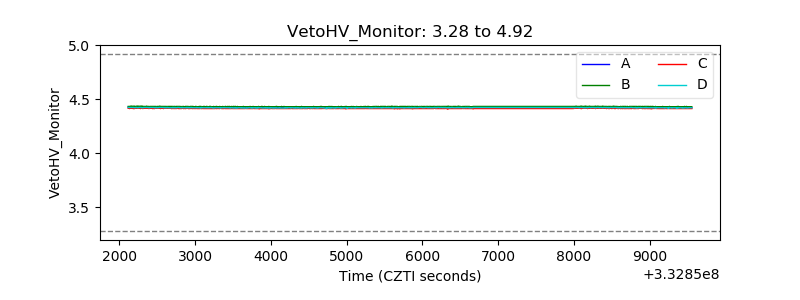 |
| Veto LLD | 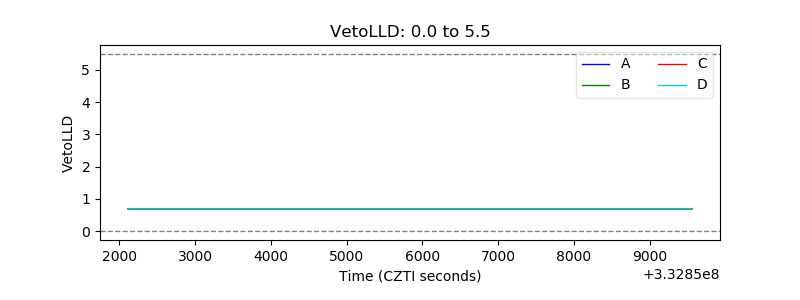 |
| Alpha Counter | 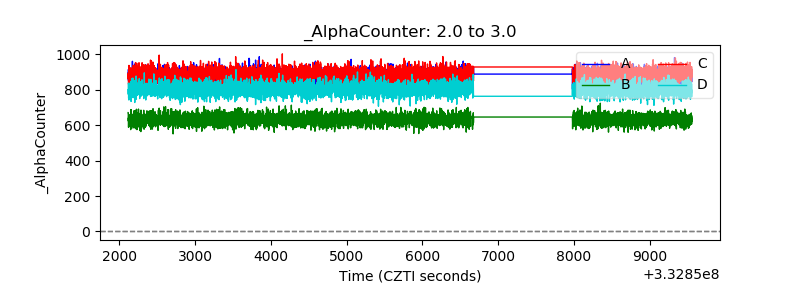 |
| _CPM_Rate | 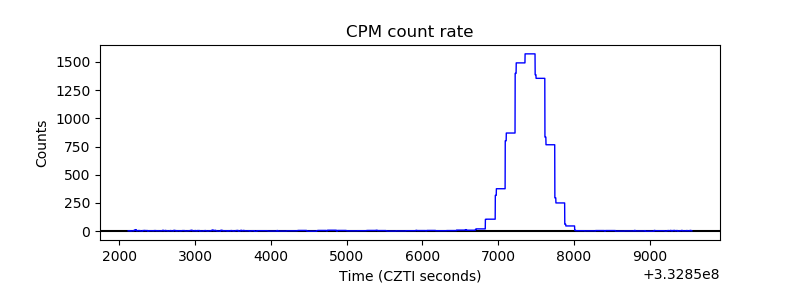 |
| CZT Counter | 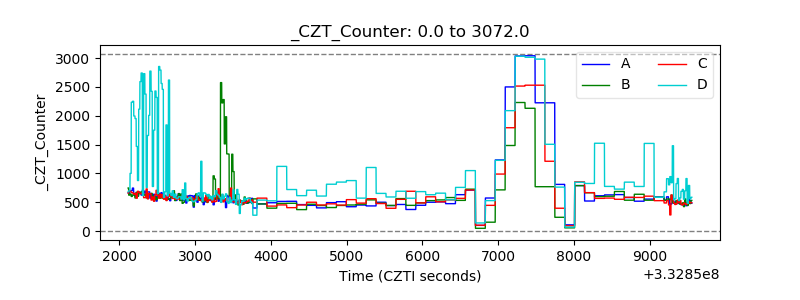 |
| +2.5 Volts monitor |  |
| +5 Volts monitor |  |
| _ROLL_ROT |  |
| _Roll_DEC | 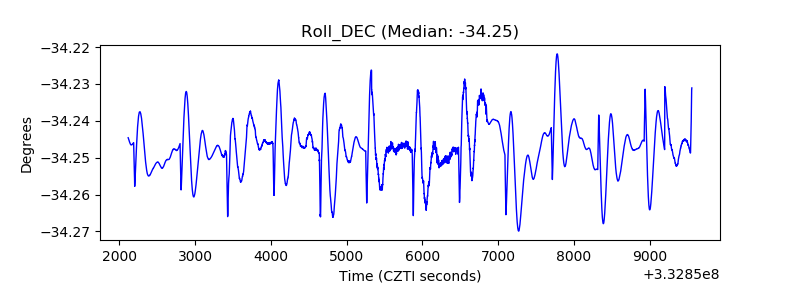 |
| _Roll_RA | 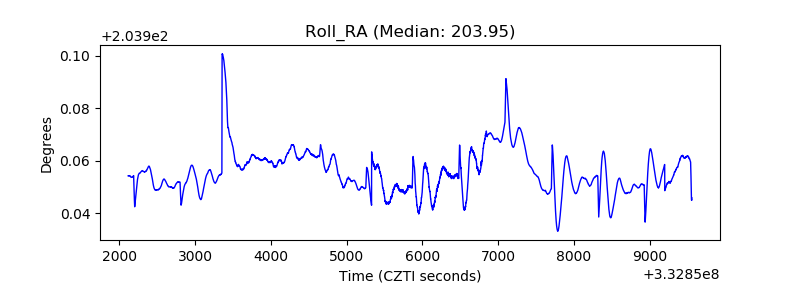 |
| Veto Counter | 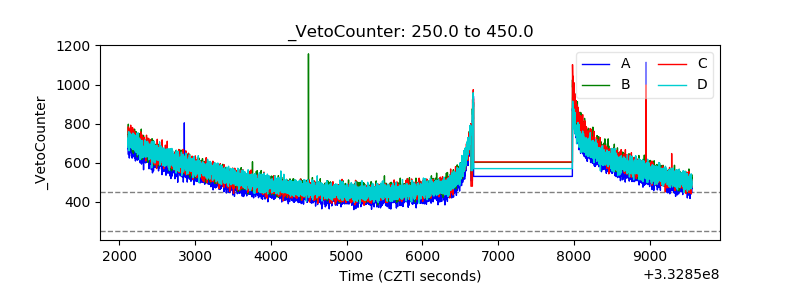 |