| Param | Original file | Final file |
|---|---|---|
| Filename | modeM0/AS1A07_068T01_9000003760_25998cztM0_level2.evt | modeM0/AS1A07_068T01_9000003760_25998cztM0_level2_quad_clean.evt |
| Size (bytes) | 467,870,400 | 100,857,600 |
| Size | 446.2 MB | 96.2 MB |
| Events in quadrant A | 3,129,825 | 687,933 |
| Events in quadrant B | 3,160,480 | 678,602 |
| Events in quadrant C | 3,064,212 | 640,007 |
| Events in quadrant D | 4,405,959 | 627,205 |
| Mode M0 | |||
|---|---|---|---|
| Quadrant | BADHDUFLAG | Total packets | Discarded packets |
| A | 0 | 12898 | 0 |
| B | 0 | 13024 | 0 |
| C | 0 | 12799 | 0 |
| D | 0 | 17175 | 0 |
| Mode M9 | |||
|---|---|---|---|
| Quadrant | BADHDUFLAG | Total packets | Discarded packets |
| A | 0 | 12 | 0 |
| B | 0 | 12 | 0 |
| C | 0 | 12 | 0 |
| D | 0 | 12 | 0 |
| Quadrant | Total seconds | Saturated seconds | Saturation percentage |
|---|---|---|---|
| A | 6026 | 90 | 1.493528% |
| B | 6027 | 100 | 1.659200% |
| C | 6027 | 126 | 2.090592% |
| D | 6027 | 306 | 5.077153% |
Noise dominated data is calculated using 1-second bins in cleaned event files. If a bin has >2000 counts, and if more than 50% of those come from <1% of pixels, then it is considered to be noise-dominated and hence unusable.
| Quadrant | # 1 sec bins | Bins with >0 counts | Bins with >2000 counts | High rate bins dominated by noise | Noise dominated (total time) | Noise dominated (detector-on time) | Marked lightcurve |
|---|---|---|---|---|---|---|---|
| A | 7231 | 6027 | 5 | 5 | 0.07% | 0.08% |  |
| B | 7232 | 6028 | 2 | 2 | 0.03% | 0.03% |  |
| C | 7232 | 6028 | 0 | 0 | 0.00% | 0.00% |  |
| D | 7232 | 6028 | 199 | 199 | 2.75% | 3.30% | 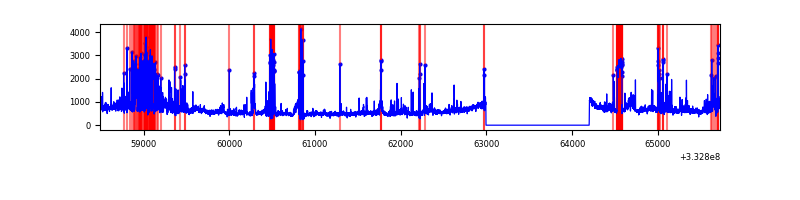 |
Top three noisy pixels from each quadrant. If the there are fewer than three noisy pixels in the level2.evt file, extra rows are filled as -1
| Pixel properties | Quadrant properties | ||||||
|---|---|---|---|---|---|---|---|
| Quadrant | DetID | PixID | Counts | Sigma | Mean | Median | Sigma |
| A | 4 | 208 | 12277 | 70.95 | 807 | 793 | 161.9 |
| A | 13 | 254 | 9755 | 55.37 | 807 | 793 | 161.9 |
| A | 0 | 226 | 7142 | 39.22 | 807 | 793 | 161.9 |
| B | 10 | 245 | 43262 | 284.7 | 783 | 763 | 149.3 |
| B | 0 | 190 | 32110 | 210.0 | 783 | 763 | 149.3 |
| B | 12 | 111 | 17201 | 110.12 | 783 | 763 | 149.3 |
| C | 14 | 238 | 124052 | 706.09 | 748 | 753 | 174.6 |
| C | 3 | 233 | 11765 | 63.06 | 748 | 753 | 174.6 |
| C | 0 | 207 | 9390 | 49.46 | 748 | 753 | 174.6 |
| D | 1 | 52 | 1294807 | 7191.48 | 757 | 741 | 179.9 |
| D | 7 | 80 | 161926 | 895.75 | 757 | 741 | 179.9 |
| D | 7 | 223 | 43077 | 235.27 | 757 | 741 | 179.9 |
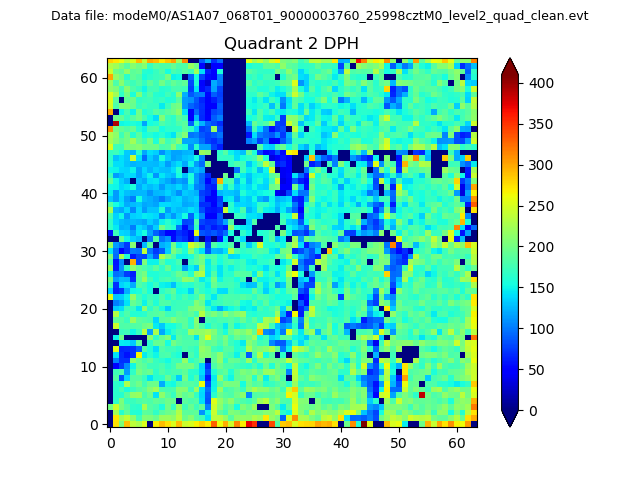
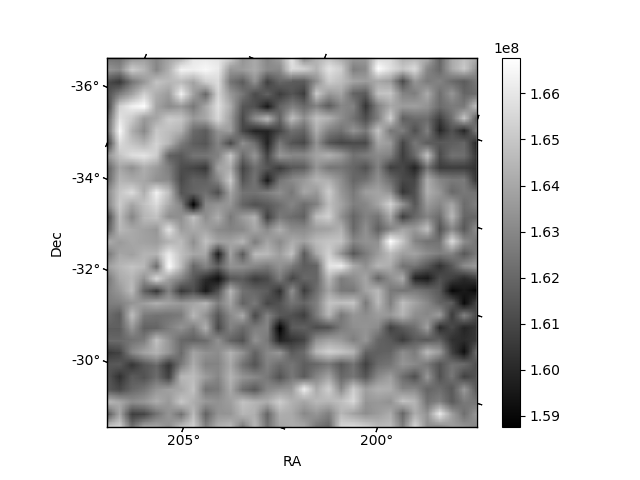
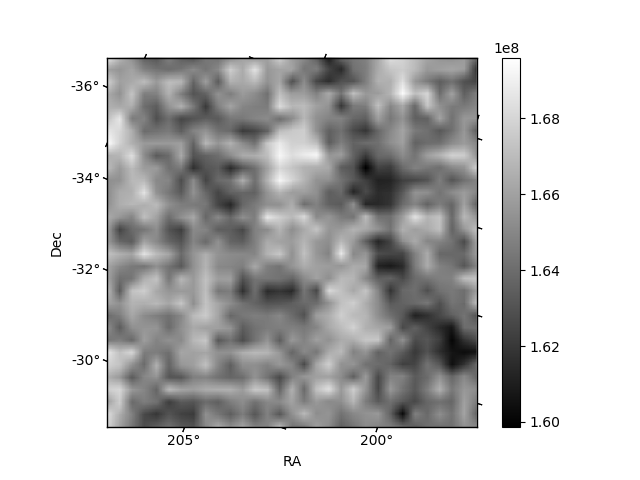
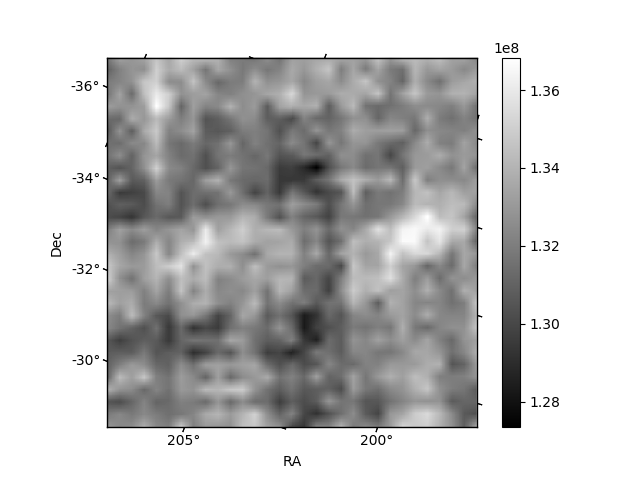
Histogram calculated using DETX and DETY for each event in the final _common_clean file
| Quadrant A | 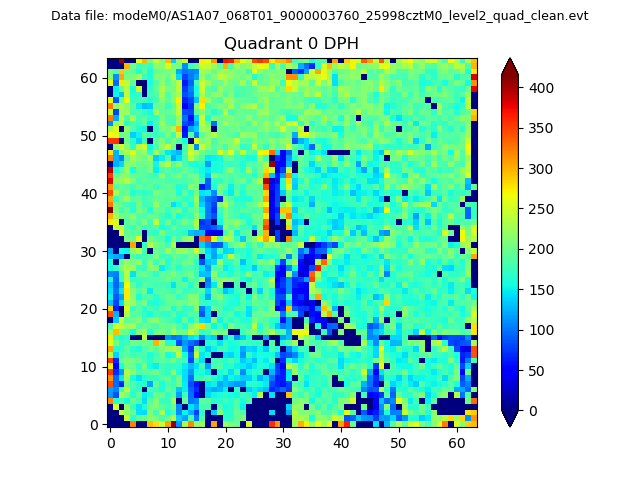 |
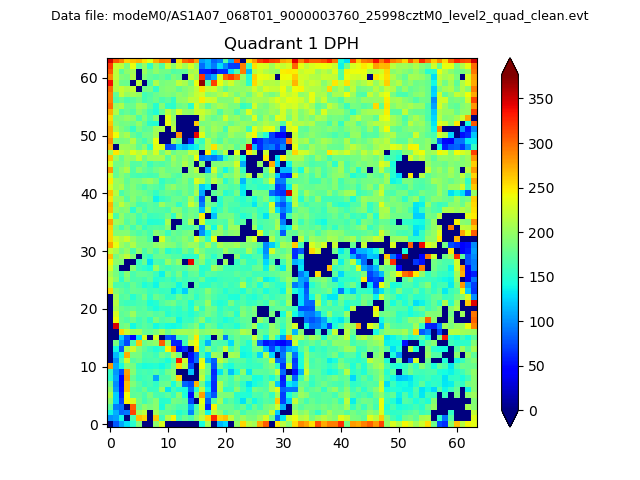 |
Quadrant B |
|---|---|---|---|
| Quadrant D | 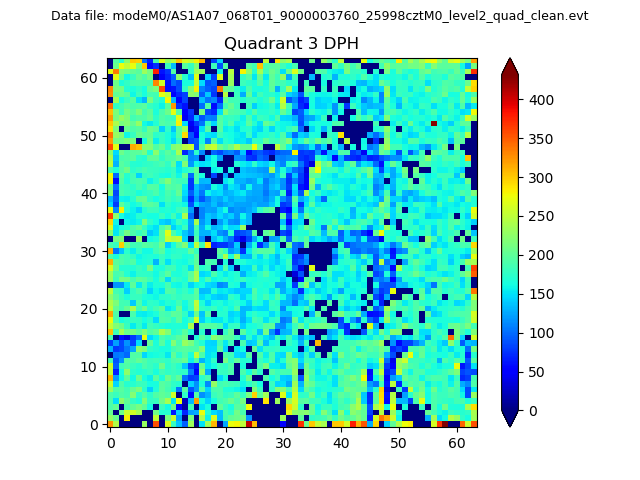 |
 |
Quadrant C |
| Plot type | Count rate plots | Images |
|---|---|---|
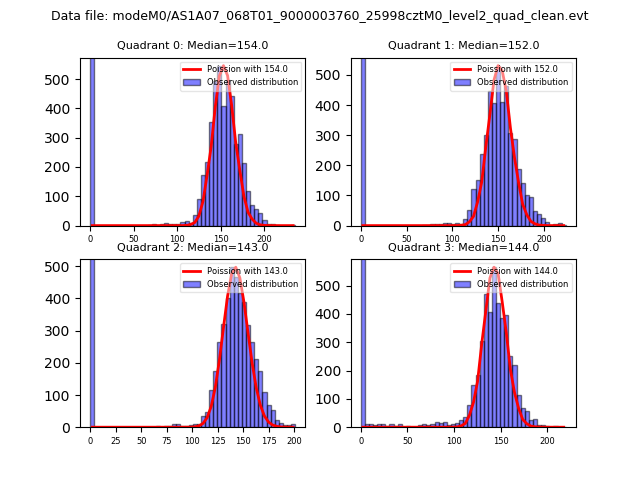
| Comparison with Poisson distribution Blue bars denote a histogram of data divided into 1 sec bins. Red curve is a Poisson curve with rate = median count rate of data. |
 |
 |
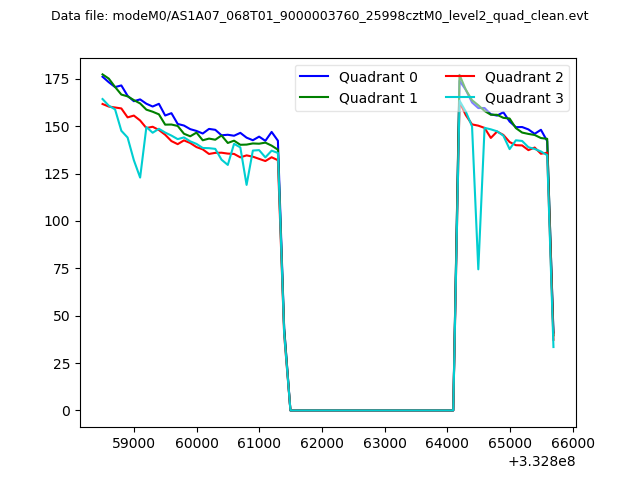
| Quadrant-wise count rates Data is divided into 100 sec bins |
 |
|
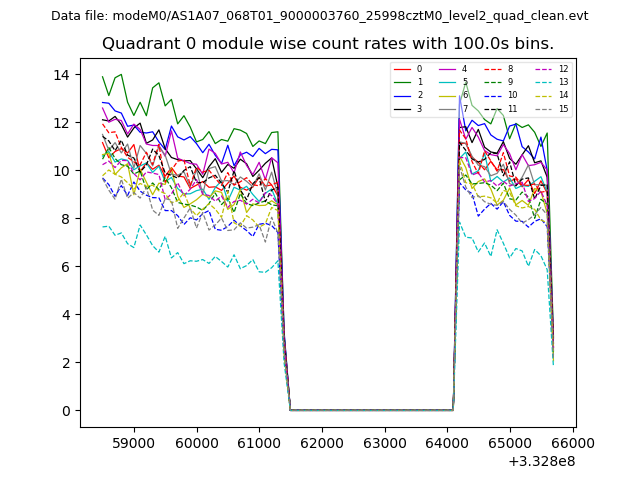
| Module-wise count rates for Quadrant A Data is divided into 100 sec bins |
 |
 |
| Module-wise count rates for Quadrant B Data is divided into 100 sec bins |
 |
 |
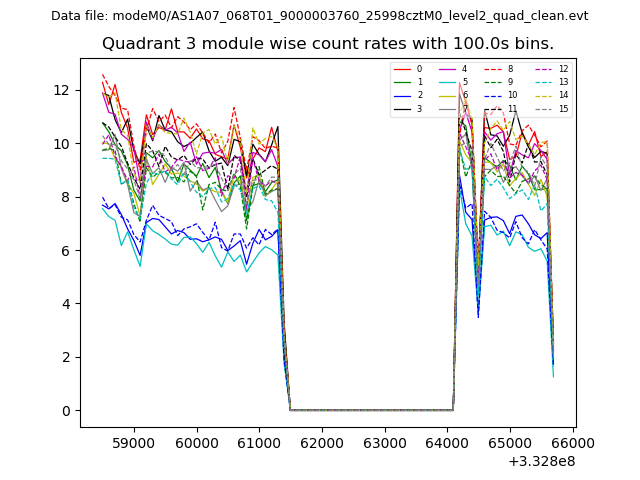
| Module-wise count rates for Quadrant C Data is divided into 100 sec bins |
 |
 |
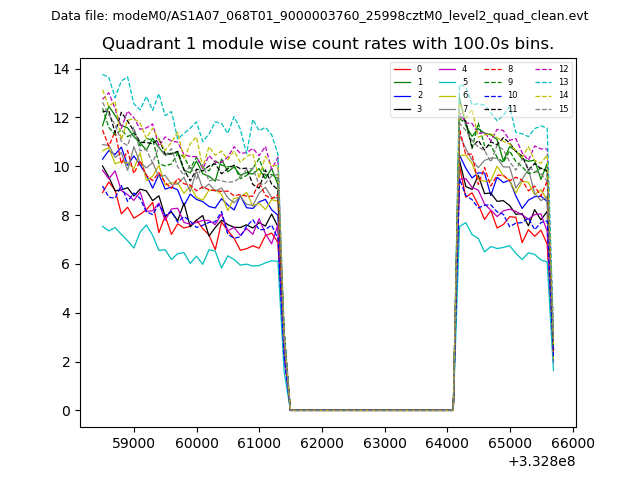
| Module-wise count rates for Quadrant D Data is divided into 100 sec bins |
 |
 |
| Parameter | Plot |
|---|---|
| CZT HV Monitor |  |
| D_VDD | 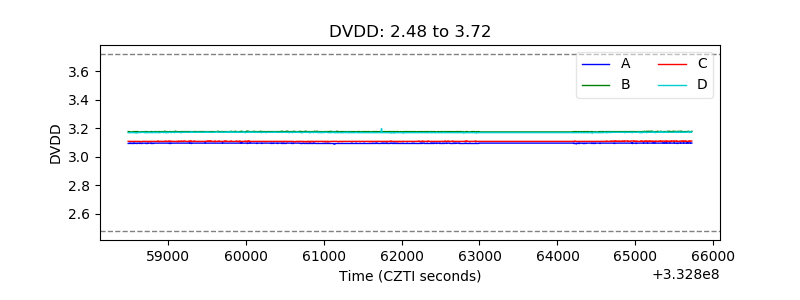 |
| Temperature 1 | 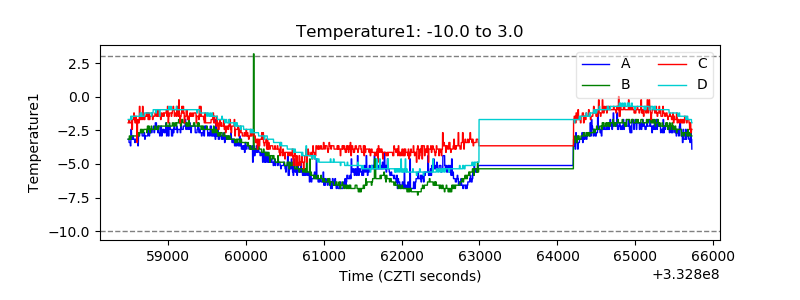 |
| Veto HV Monitor | 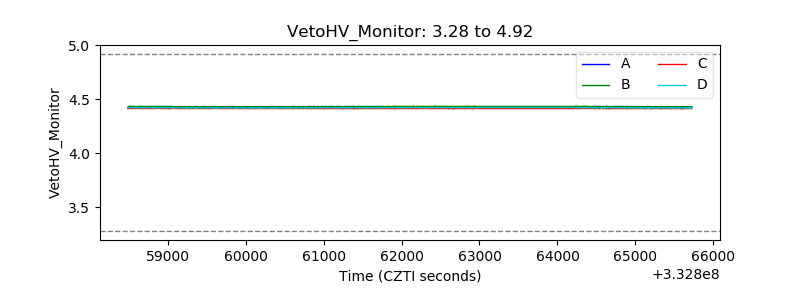 |
| Veto LLD | 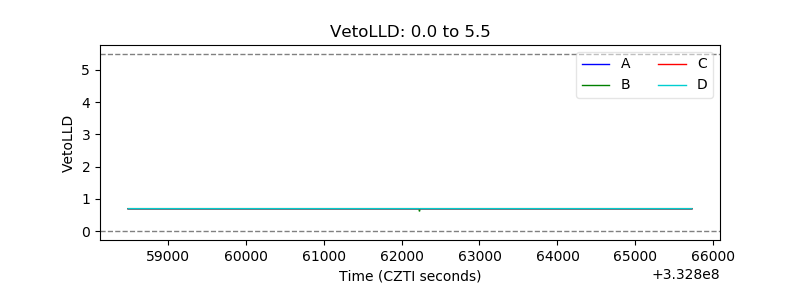 |
| Alpha Counter | 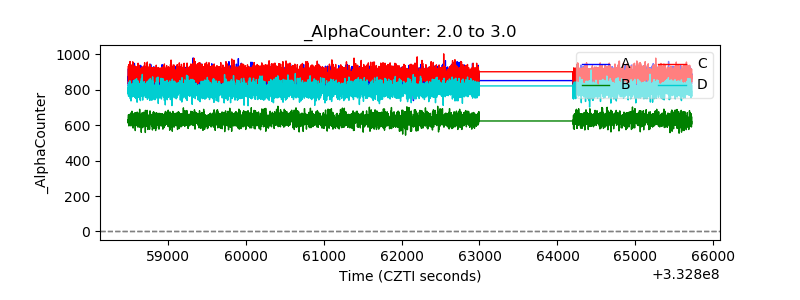 |
| _CPM_Rate | 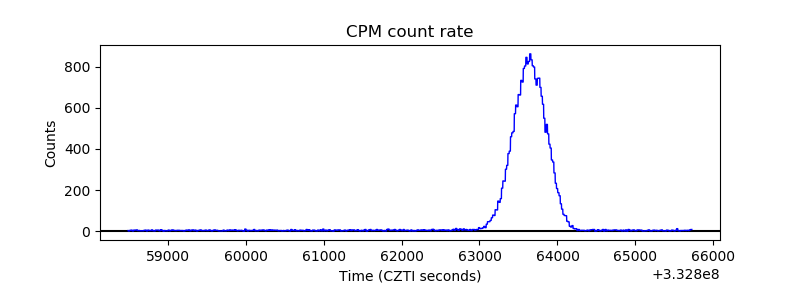 |
| CZT Counter | 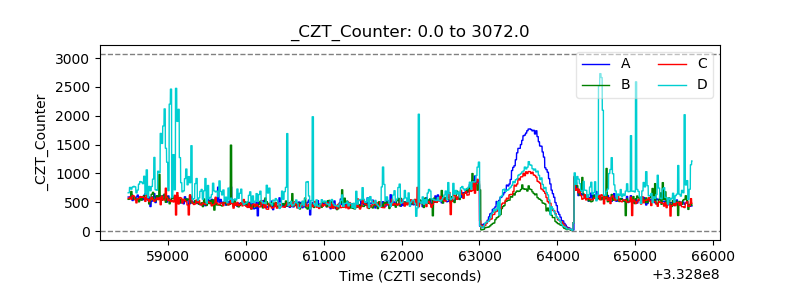 |
| +2.5 Volts monitor |  |
| +5 Volts monitor |  |
| _ROLL_ROT | 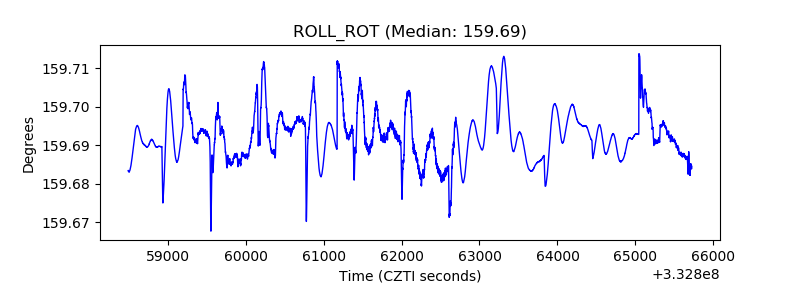 |
| _Roll_DEC | 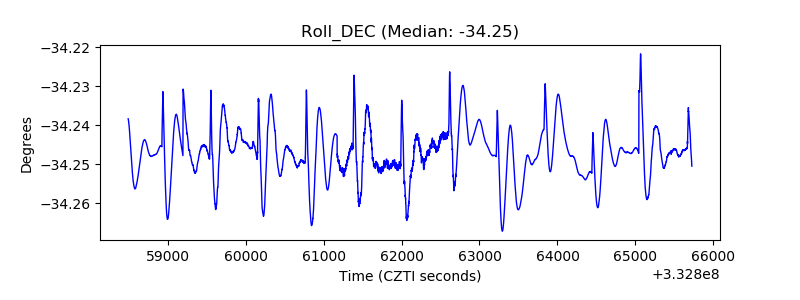 |
| _Roll_RA | 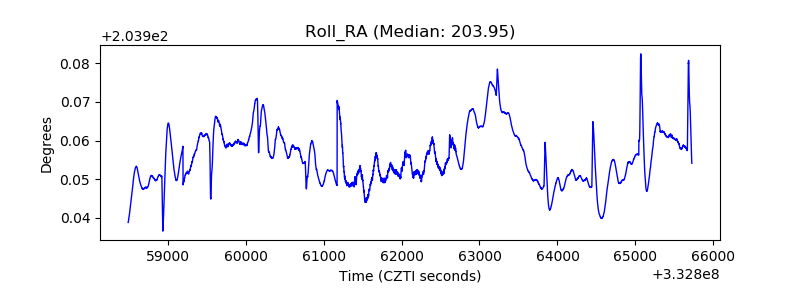 |
| Veto Counter | 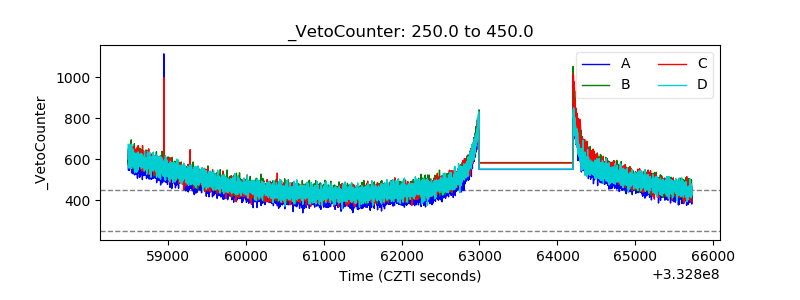 |