| Param | Original file | Final file |
|---|---|---|
| Filename | modeM0/AS1A07_068T01_9000003760_25999cztM0_level2.evt | modeM0/AS1A07_068T01_9000003760_25999cztM0_level2_quad_clean.evt |
| Size (bytes) | 481,176,000 | 86,641,920 |
| Size | 458.9 MB | 82.6 MB |
| Events in quadrant A | 2,985,775 | 571,128 |
| Events in quadrant B | 3,135,234 | 564,087 |
| Events in quadrant C | 3,136,232 | 535,316 |
| Events in quadrant D | 4,900,908 | 526,927 |
| Mode M0 | |||
|---|---|---|---|
| Quadrant | BADHDUFLAG | Total packets | Discarded packets |
| A | 0 | 12671 | 0 |
| B | 0 | 13097 | 0 |
| C | 0 | 13193 | 0 |
| D | 0 | 18775 | 0 |
| Mode M9 | |||
|---|---|---|---|
| Quadrant | BADHDUFLAG | Total packets | Discarded packets |
| A | 0 | 9 | 0 |
| B | 0 | 9 | 0 |
| C | 0 | 9 | 0 |
| D | 0 | 9 | 0 |
| Quadrant | Total seconds | Saturated seconds | Saturation percentage |
|---|---|---|---|
| A | 6097 | 78 | 1.279318% |
| B | 6098 | 103 | 1.689078% |
| C | 6098 | 115 | 1.885864% |
| D | 6098 | 339 | 5.559200% |
Noise dominated data is calculated using 1-second bins in cleaned event files. If a bin has >2000 counts, and if more than 50% of those come from <1% of pixels, then it is considered to be noise-dominated and hence unusable.
| Quadrant | # 1 sec bins | Bins with >0 counts | Bins with >2000 counts | High rate bins dominated by noise | Noise dominated (total time) | Noise dominated (detector-on time) | Marked lightcurve |
|---|---|---|---|---|---|---|---|
| A | 7027 | 6098 | 0 | 0 | 0.00% | 0.00% | 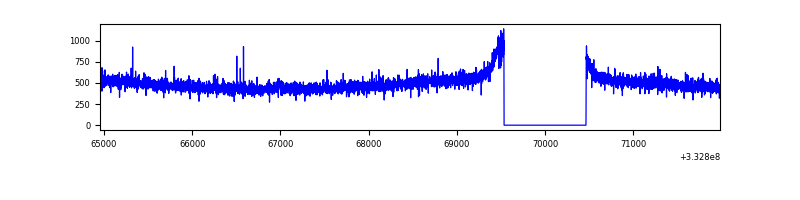 |
| B | 7028 | 6099 | 6 | 6 | 0.09% | 0.10% | 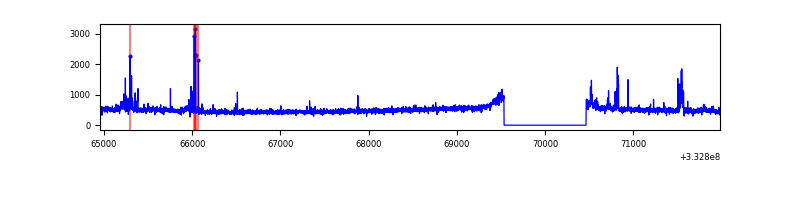 |
| C | 7028 | 6099 | 0 | 0 | 0.00% | 0.00% | 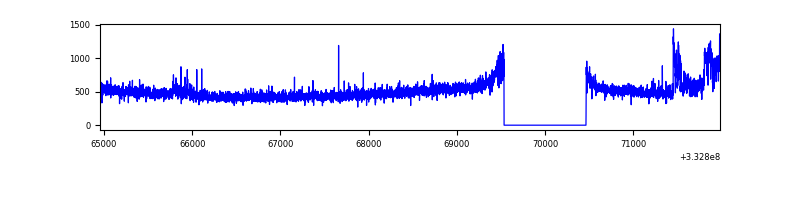 |
| D | 7028 | 6099 | 209 | 209 | 2.97% | 3.43% | 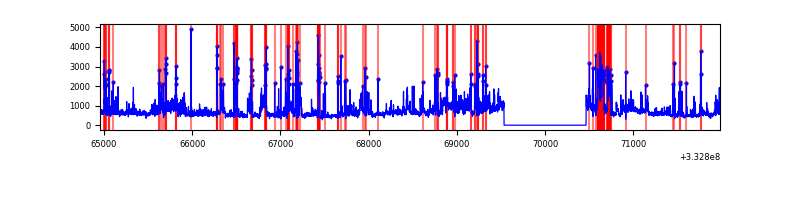 |
Top three noisy pixels from each quadrant. If the there are fewer than three noisy pixels in the level2.evt file, extra rows are filled as -1
| Pixel properties | Quadrant properties | ||||||
|---|---|---|---|---|---|---|---|
| Quadrant | DetID | PixID | Counts | Sigma | Mean | Median | Sigma |
| A | 13 | 254 | 9207 | 54.34 | 774 | 758 | 155.5 |
| A | 3 | 137 | 7031 | 40.35 | 774 | 758 | 155.5 |
| A | 0 | 226 | 6650 | 37.9 | 774 | 758 | 155.5 |
| B | 0 | 190 | 90930 | 617.13 | 758 | 739 | 146.1 |
| B | 10 | 245 | 78655 | 533.14 | 758 | 739 | 146.1 |
| B | 12 | 111 | 17483 | 114.57 | 758 | 739 | 146.1 |
| C | 0 | 239 | 158640 | 926.78 | 724 | 728 | 170.4 |
| C | 14 | 238 | 117598 | 685.9 | 724 | 728 | 170.4 |
| C | 3 | 233 | 25733 | 146.75 | 724 | 728 | 170.4 |
| D | 1 | 52 | 1933057 | 11020.46 | 729 | 712 | 175.3 |
| D | 7 | 80 | 86849 | 491.25 | 729 | 712 | 175.3 |
| D | 2 | 153 | 56405 | 317.63 | 729 | 712 | 175.3 |
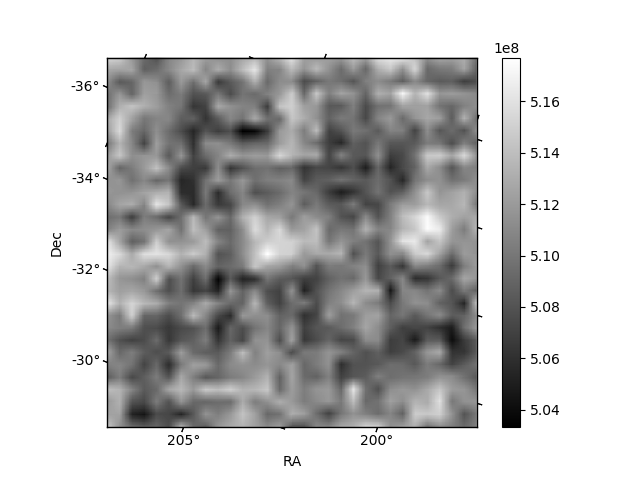
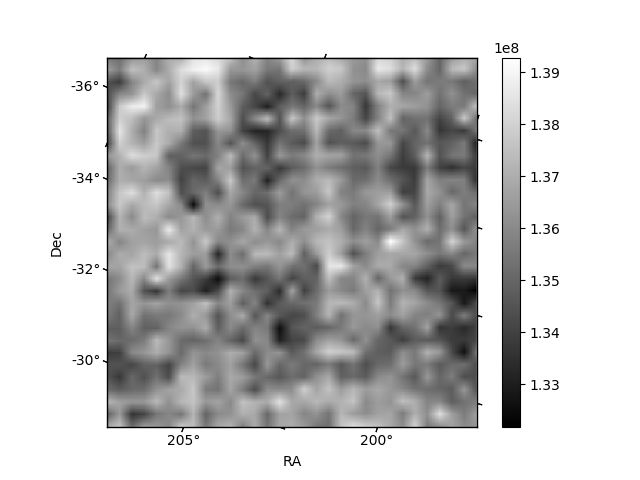
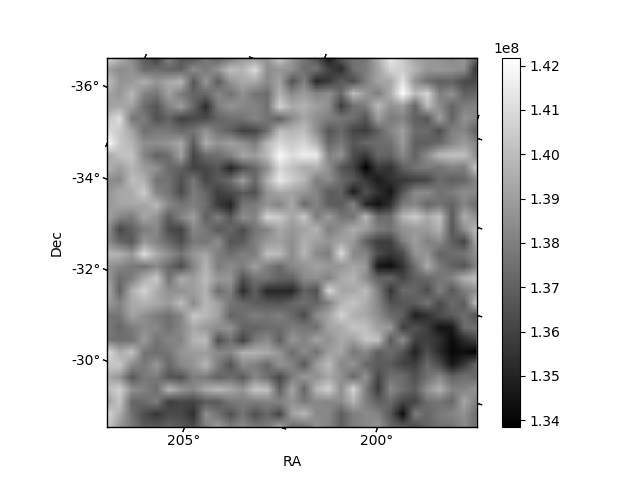
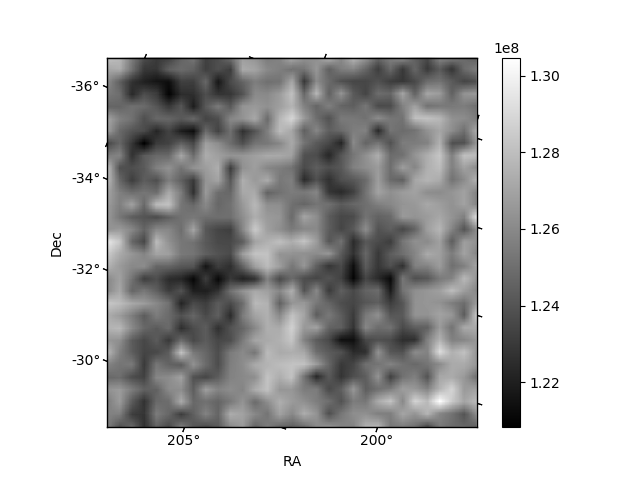
Histogram calculated using DETX and DETY for each event in the final _common_clean file
| Quadrant A | 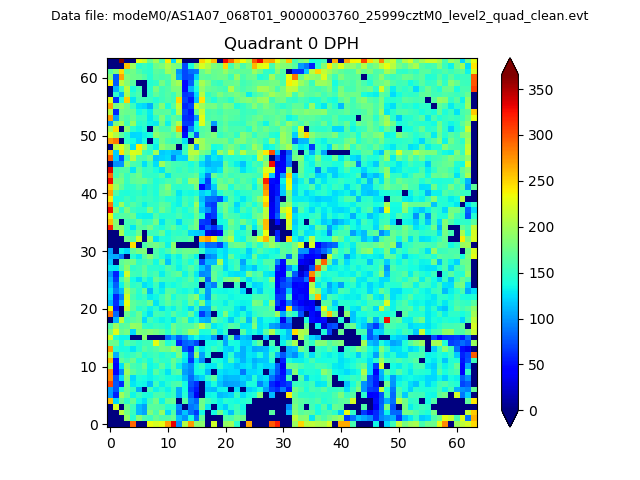 |
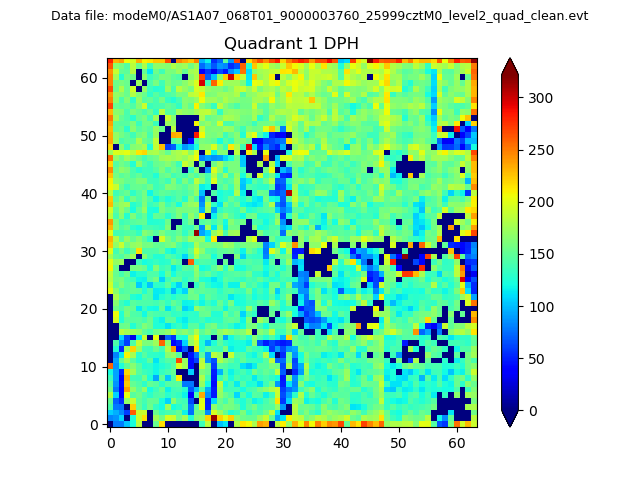 |
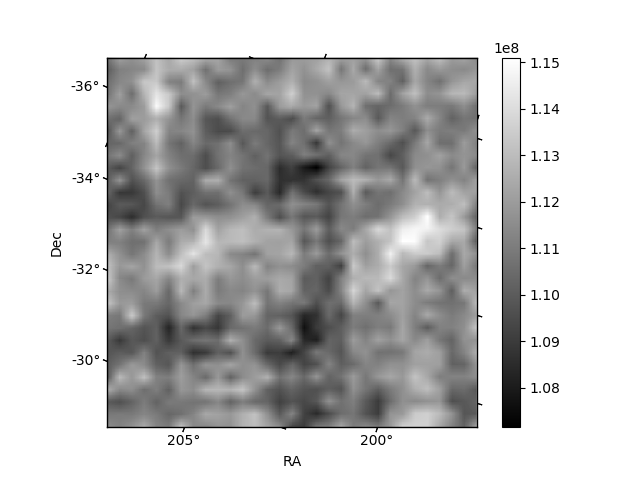
Quadrant B |
|---|---|---|---|
| Quadrant D |  |
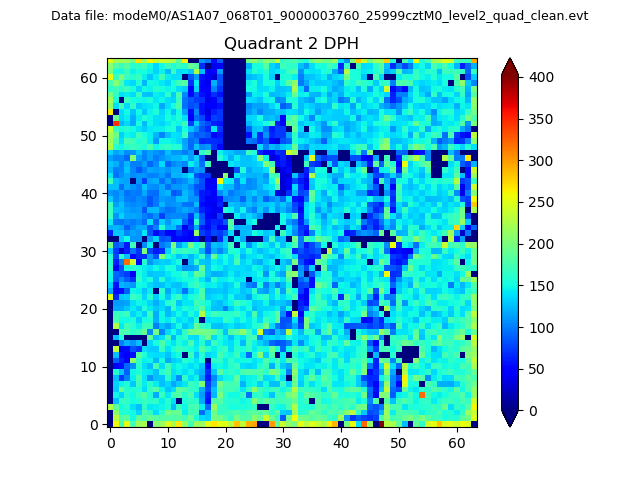 |
Quadrant C |
| Plot type | Count rate plots | Images |
|---|---|---|
| Comparison with Poisson distribution Blue bars denote a histogram of data divided into 1 sec bins. Red curve is a Poisson curve with rate = median count rate of data. |
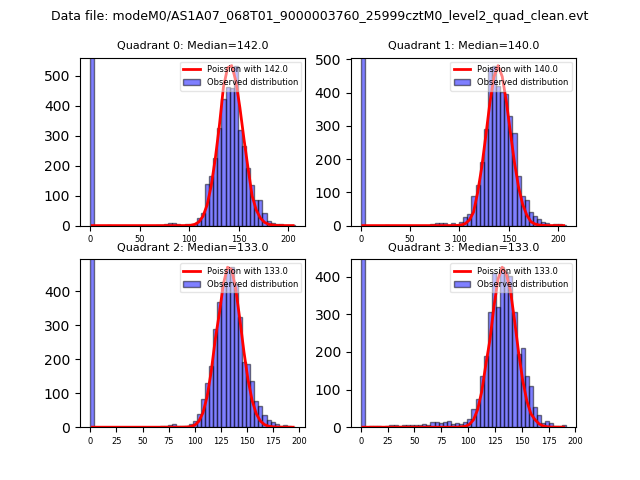 |
 |
| Quadrant-wise count rates Data is divided into 100 sec bins |
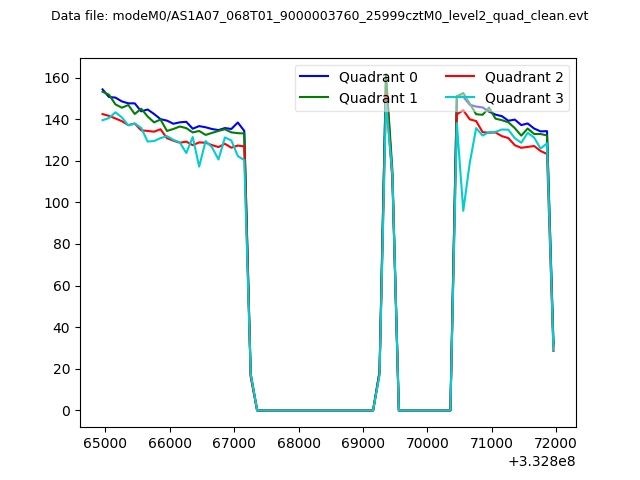 |
|
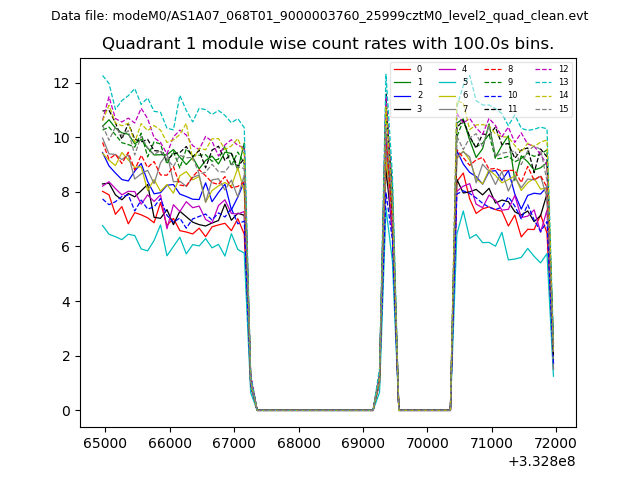
| Module-wise count rates for Quadrant A Data is divided into 100 sec bins |
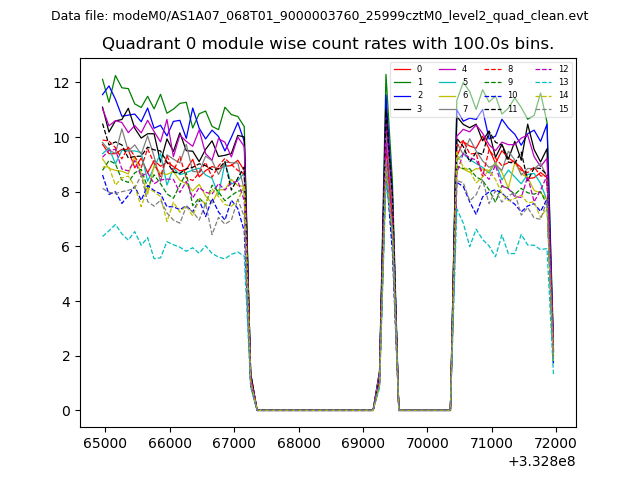 |
 |
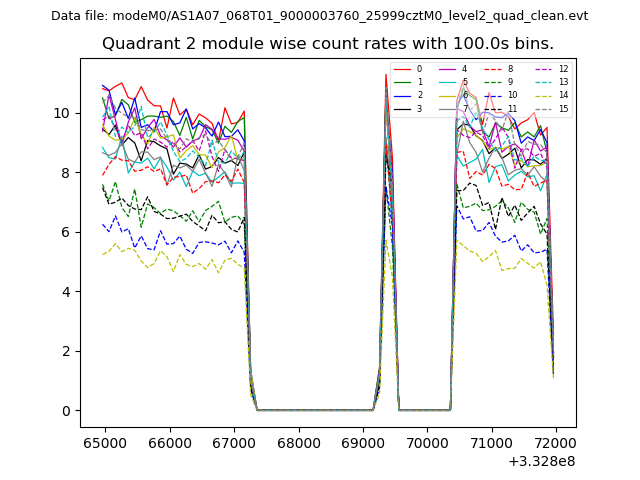
| Module-wise count rates for Quadrant B Data is divided into 100 sec bins |
 |
 |
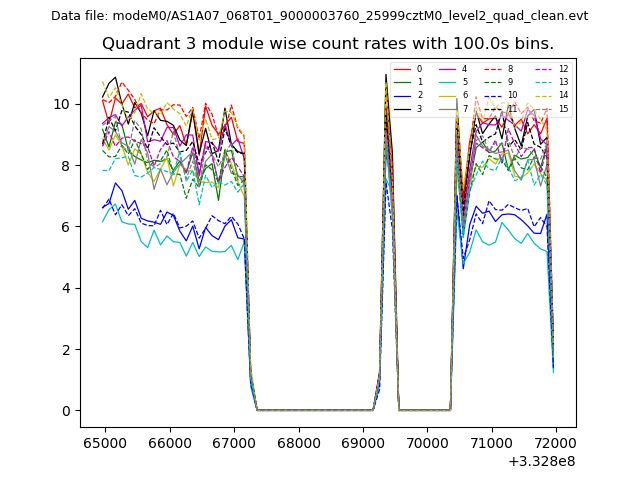
| Module-wise count rates for Quadrant C Data is divided into 100 sec bins |
 |
 |
| Module-wise count rates for Quadrant D Data is divided into 100 sec bins |
 |
 |
| Parameter | Plot |
|---|---|
| CZT HV Monitor | 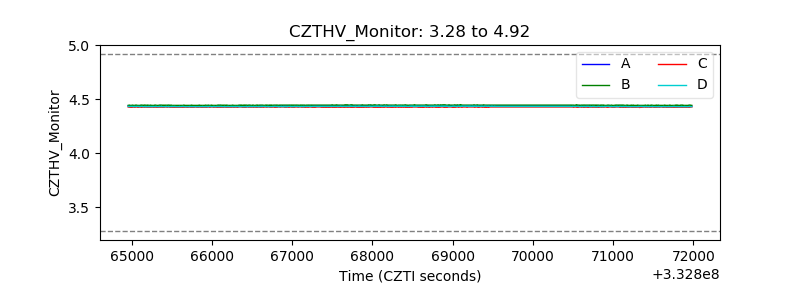 |
| D_VDD | 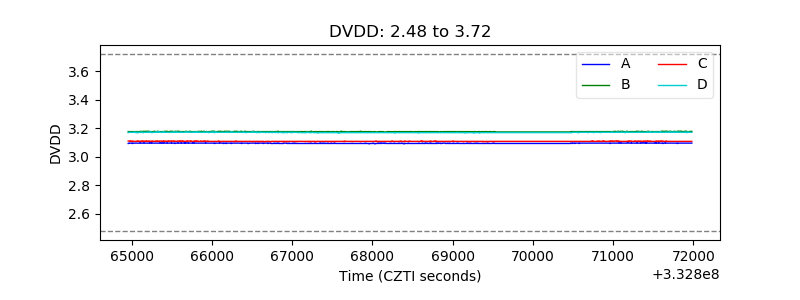 |
| Temperature 1 | 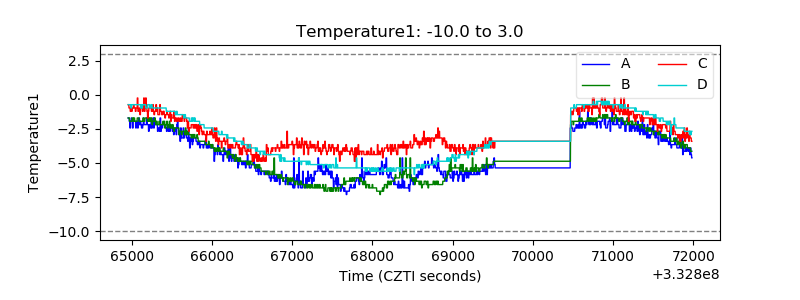 |
| Veto HV Monitor | 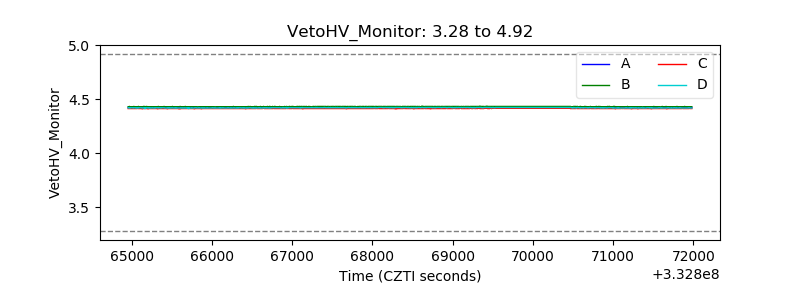 |
| Veto LLD | 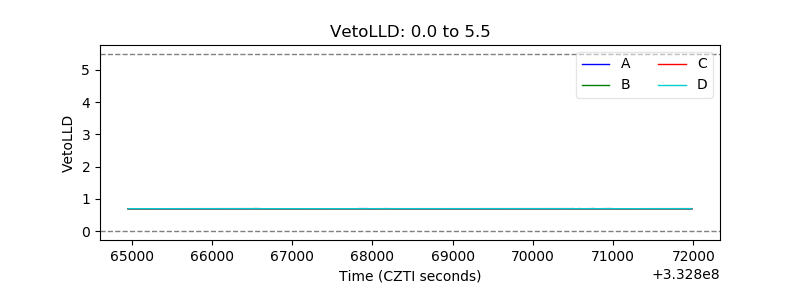 |
| Alpha Counter | 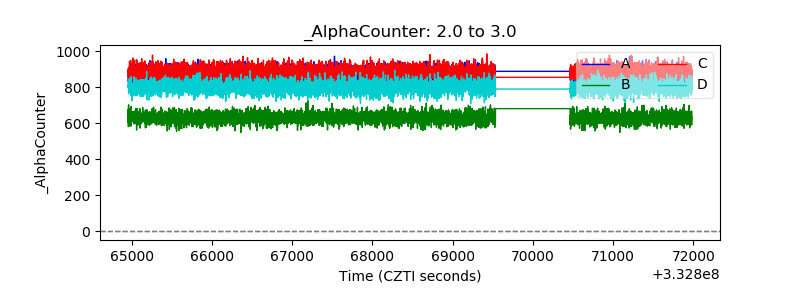 |
| _CPM_Rate | 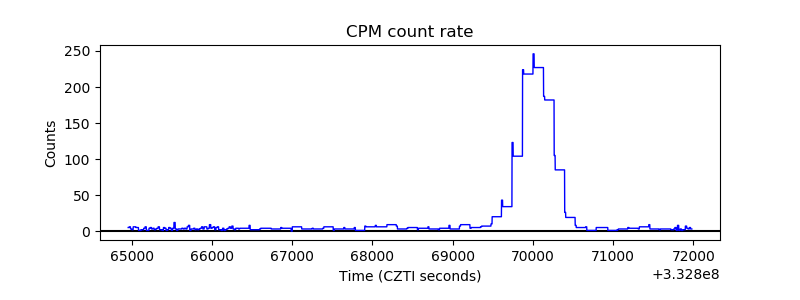 |
| CZT Counter | 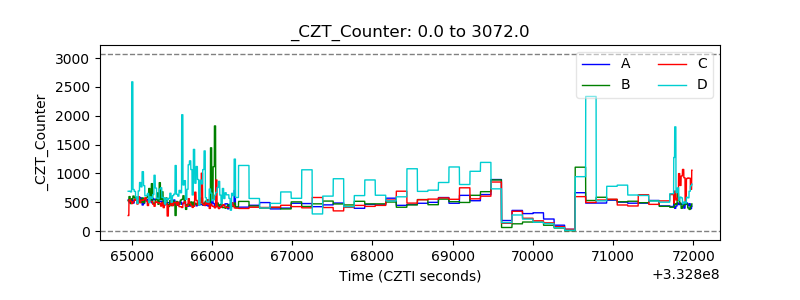 |
| +2.5 Volts monitor |  |
| +5 Volts monitor |  |
| _ROLL_ROT | 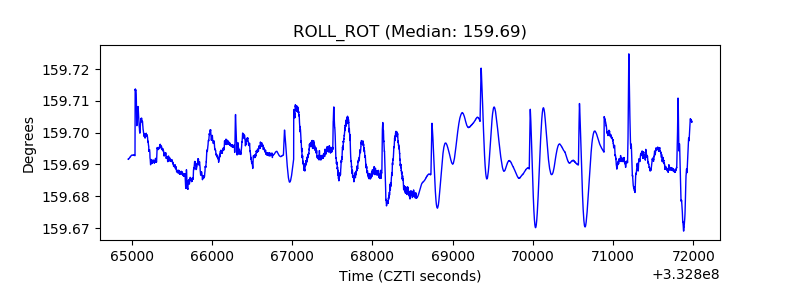 |
| _Roll_DEC | 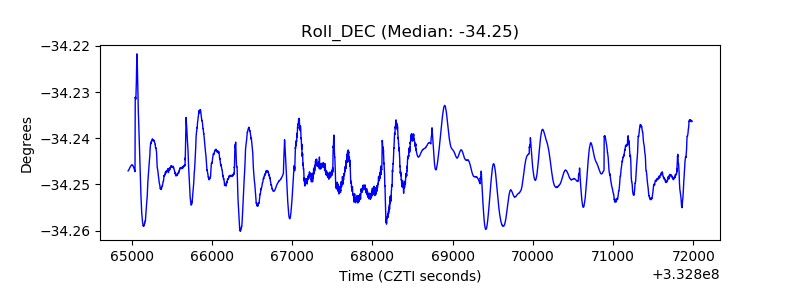 |
| _Roll_RA | 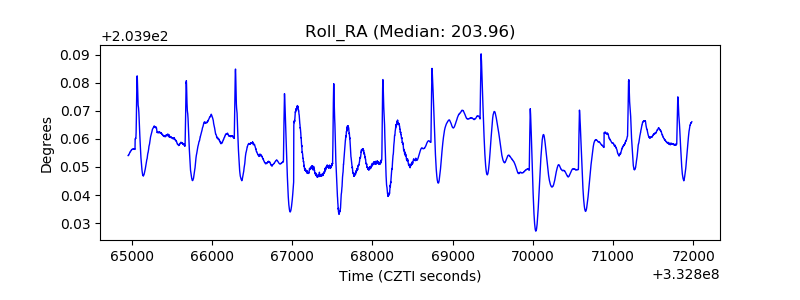 |
| Veto Counter | 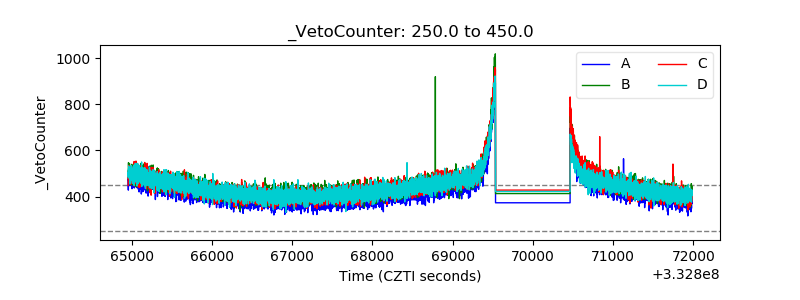 |